10-K: Annual report pursuant to Section 13 and 15(d)
Published on March 8, 2019
UNITED STATES
SECURITIES AND EXCHANGE COMMISSION
Washington, D.C. 20549
FORM 10-K
(Mark One)
|
☒ |
Annual Report pursuant to Section 13 or 15(d) of the Securities Exchange Act of 1934 |
For the fiscal year ended December 30, 2018
or
|
☐ |
Transition report pursuant to Section 13 or 15(d) of the Securities Exchange Act of 1934 |
For the transition period from to
Commission File Number: 0-21660
PAPA JOHN’S INTERNATIONAL, INC.
(Exact name of registrant as specified in its charter)
|
Delaware |
|
61-1203323 |
|
(State or other jurisdiction of |
|
(I.R.S. Employer |
|
incorporation or organization) |
|
Identification No.) |
|
2002 Papa John’s Boulevard |
|
|
|
Louisville, Kentucky |
|
40299-2367 |
|
(Address of principal executive offices) |
|
(Zip Code) |
(502) 261-7272
(Registrant’s telephone number, including area code)
Securities registered pursuant to Section 12(b) of the Act:
|
(Title of Each Class) |
|
(Name of each exchange on which registered) |
|
Common Stock, $0.01 par value |
|
The NASDAQ Stock Market LLC |
Securities registered pursuant to Section 12(g) of the Act: None
Indicate by check mark if the registrant is a well-known seasoned issuer, as defined in Rule 405 of the Securities Act. Yes ☒ No ☐
Indicate by check mark if the registrant is not required to file reports pursuant to Section 13 or Section 15(d) of the Act. Yes ☐ No ☒
Indicate by check mark whether the registrant (1) has filed all reports required to be filed by Section 13 or 15(d) of the Securities Exchange Act of 1934 during the preceding 12 months (or for such shorter period that the registrant was required to file such reports), and (2) has been subject to such filing requirements for the past 90 days. Yes ☒ No ☐
Indicate by check mark whether the registrant has submitted electronically every Interactive Data File required to be submitted pursuant to Rule 405 of Regulation S-T (§232.405 of this chapter) during the preceding 12 months (or for such shorter period that the registrant was required to submit such files). Yes ☒ No ☐
Indicate by check mark if disclosure of delinquent filers pursuant to Item 405 of Regulation S-K (§229.405 of this chapter) is not contained herein, and will not be contained, to the best of registrant’s knowledge, in definitive proxy or information statements incorporated by reference in Part III of this Form 10-K or any amendment to this Form 10-K. ☒
Indicate by check mark whether the registrant is a large accelerated filer, an accelerated filer, a non-accelerated filer, a smaller reporting company or an emerging growth company. See the definitions of “large accelerated filer,” “accelerated filer” “smaller reporting company” and “emerging growth company” in Rule 12b-2 of the Exchange Act.
|
Large accelerated filer ☒ |
|
Accelerated filer ☐ |
|
Non-accelerated filer ☐ |
|
Smaller reporting company ☐ Emerging growth company ☐
|
If an emerging growth company, indicate by check mark if the Registrant has elected not to use the extended transition period for complying with any new or revised financial accounting standards provided pursuant to Section 13(a) of the Exchange Act.☐
Indicate by check mark whether the registrant is a shell company (as defined in Rule 12b-2 of the Act). Yes ☐ No ☒
The aggregate market value of the common stock held by non-affiliates of the Registrant, computed by reference to the closing sale price on The NASDAQ Stock Market as of the last business day of the Registrant’s most recently completed second fiscal quarter, July 1, 2018, was $1,120,697,454.
As of March 4, 2019, there were 31,642,269 shares of the Registrant’s common stock outstanding.
DOCUMENTS INCORPORATED BY REFERENCE
Portions of Part III of this annual report are incorporated by reference to the Registrant’s Proxy Statement for the Annual Meeting of Stockholders to be held April 30, 2019.
2
General
Papa John’s International, Inc., a Delaware corporation (referred to as the “Company”, “Papa John’s” or in the first person notations of “we”, “us” and “our”), operates and franchises pizza delivery and carryout restaurants and, in certain international markets, dine-in and delivery restaurants under the trademark “Papa John’s”. Papa John’s began operations in 1984. At December 30, 2018, there were 5,303 Papa John’s restaurants in operation, consisting of 645 Company-owned and 4,658 franchised restaurants operating domestically in all 50 states and in 46 countries and territories. Our Company-owned restaurants include 183 restaurants operated under three joint venture arrangements.
Papa John’s has defined four reportable segments: domestic Company-owned restaurants, North America commissaries (Quality Control Centers), North America franchising and international operations. North America is defined as the United States and Canada. Domestic is defined as the contiguous United States. International franchisees are defined as all franchise operations outside of the United States and Canada. See “Management’s Discussion and Analysis of Financial Condition and Results of Operations” and “Note 22” of “Notes to Consolidated Financial Statements” for financial information about our segments.
All of our periodic and current reports filed with the Securities and Exchange Commission (the “SEC”) pursuant to Section 13(a) or 15(d) of the Securities and Exchange Act of 1934, as amended (the “Exchange Act”), are available, free of charge, through our website located at www.papajohns.com. These reports include our annual reports on Form 10-K, quarterly reports on Form 10-Q, current reports on Form 8-K and any amendments to those reports. These reports are available through our website as soon as reasonably practicable after we electronically file them with the SEC. We also make available free of charge on our website our Corporate Governance Guidelines, Board Committee Charters, and our Code of Ethics, which applies to Papa John’s directors, officers and employees. Printed copies of such documents are also available free of charge upon written request to Investor Relations, Papa John’s International, Inc., P.O. Box 99900, Louisville, KY 40269-0900. The SEC maintains an internet site that contains reports, proxy and information statements, and other information regarding issuers that file electronically with the SEC, including us, at www.sec.gov. The references to these website addresses do not constitute incorporation by reference of the information contained on the websites, which should not be considered part of this document.
We have experienced negative publicity and consumer sentiment as a result of statements by the Company’s founder and former spokesperson John H. Schnatter in late 2017 and in July 2018, which contributed to our negative sales results in 2018. Mr. Schnatter resigned as Chairman of the Board on July 11, 2018, the same day that the media reported certain controversial statements made by Mr. Schnatter. A Special Committee of the Board of Directors consisting of all of the independent directors (the “Special Committee”) was formed on July 15, 2018 to evaluate and take action with respect to all of the Company’s relationships and arrangements with Mr. Schnatter. In addition, on July 27, 2018, the Company announced that the Board’s Lead Independent Director, Olivia F. Kirtley, had been unanimously appointed by the Board of Directors to serve as Chairman of the Company’s Board of Directors. Following its formation, the Special Committee terminated Mr. Schnatter’s Founder Agreement, which defined his role in the Company, among other things, as advertising and brand spokesperson for the Company. The Special Committee, among other things, oversaw the previously announced external audit and investigation of all the Company’s existing processes, policies and systems related to diversity and inclusion, supplier and vendor engagement and Papa John’s culture, which is substantially complete. The Special Committee has delivered recommendations resulting from the audit to Company management, who will implement the recommendations, including initiatives and training regarding Diversity, Equity, and Inclusion. The Company is also implementing various branding and marketing initiatives, including a new advertising and marketing campaign.
In September 2018, the Company began a process to evaluate a wide range of strategic options with the goal of improving sales, maximizing value for all shareholders and serving the best interest of the Company’s stakeholders. As part of this strategic review, the Special Committee also engaged legal and financial advisors. After extensive discussions with a wide group of strategic and financial investors, the Special Committee concluded that an investment agreement with funds
3
affiliated with Starboard Value LP (together with its affiliates, “Starboard”) was in the best interest of shareholders. On February 3, 2019, the Company entered into a Securities Purchase Agreement (the “Securities Purchase Agreement”) with Starboard pursuant to which Starboard made a $200 million strategic investment in the Company’s newly designated Series B convertible preferred stock, par value $0.01 per share (the “Series B Preferred Stock”), with the option to make an additional $50 million investment in the Series B Preferred Stock through March 29, 2019. In addition, the Company has the right to offer up to 10,000 shares of Series B Preferred Stock to Papa John’s franchisees, on the same terms as to Starboard, provided such franchisees satisfy accredited investor and other requirements of the offering under securities laws.
The Company will use approximately half of the proceeds from the sale of the Series B Preferred Stock to reduce the outstanding principal amount under the Company’s unsecured revolving credit facility. The remaining proceeds are expected to be used to make investments in the business and for general corporate purposes.
In connection with Starboard’s investment, the Company expanded its Board of Directors to include two new independent directors, Jeffrey C. Smith, Chief Executive Officer of Starboard, who was appointed Chairman of the Board, and Anthony M. Sanfilippo, former Chairman and Chief Executive Officer of Pinnacle Entertainment, Inc. The Board of Directors believes Mr. Smith’s business expertise and new perspectives will help support the Company’s strategy to capitalize on its differentiated “BETTER INGREDIENTS. BETTER PIZZA.” market position and build a better pizza company for the benefit of its shareholders, team members, franchisees and customers. In addition, the Company’s President and Chief Executive Officer, Steve Ritchie, has been appointed to the Board. With the addition of the new directors, the Board currently is comprised of nine directors, seven of whom are independent.
Comparable Sales Trends. For the period from December 31, 2018 to January 31, 2019, system-wide North America comparable sales decreased 10.5% and system-wide International comparable sales were flat. The Company believes the disparity in North America and International comparable sales reflects the consumer sentiment challenges the brand has encountered in the United States. The Company is implementing various brand initiatives, including a new advertising and marketing campaign, in an effort to reverse the negative North America sales trend. However, the Company cannot predict whether or how long the negative sales trend will continue.
Special Charges. The Company also incurred significant costs (defined as “Special charges”) as a result of the above-mentioned recent events in the second half of 2018. We incurred $50.7 million of Special charges as follows:
|
· |
franchise royalty reductions of approximately $15.4 million for all North America franchisees, |
|
· |
reimaging costs at nearly all domestic restaurants and replacement or write off of certain branded assets totaling $5.8 million, |
|
· |
contribution of $10.0 million to the Papa John’s National Marketing Fund (“PJMF”), and |
|
· |
legal and professional fees, which amounted to $19.5 million, for various matters relating to the review of a wide range of strategic opportunities for the Company that culminated in the recent strategic investment in the Company by affiliates of Starboard, as well as a previously announced external culture audit and other activities overseen by the Special Committee. |
The Company estimates that these costs will amount to between $30 million and $50 million for 2019.
Following these events in 2018, we became a party to litigation, including class action securities litigation and litigation with Mr. Schnatter. See Item 1A. Risk Factors and “Note 19” to the “Consolidated Financial Statements” for additional information regarding these and other lawsuits.
Strategy
Early in 2018, we outlined five strategic priorities to improve upon the execution of the Company’s strategy, including:
|
· |
People: Focus on making people a priority with advanced career opportunities and more efficient restaurant procedures to support improved recruitment and retention. |
|
· |
Brand differentiation messaging: Develop improved marketing messaging that highlights our quality products and ingredients. |
4
|
· |
Value perception: Provide everyday accessible value to consumers. |
|
· |
Technological advancements: Promote technological advancements with enhanced data and analytics capabilities. |
|
· |
Restaurant unit economics: Invest further in our restaurants to operate more efficiently while improving the customer experience. |
We believe investments in these areas will provide the enhanced focus and support necessary to achieve our goal to build brand loyalty over the long-term by delivering on our “BETTER INGREDIENTS. BETTER PIZZA.” promise. Despite our recent brand challenges, we believe we are recognized as a trusted brand and quality leader in the domestic pizza category, and we believe focusing on these areas will enable us to build our brand on a global basis and increase sales and global units.
High-Quality Menu Offerings. Our menu strategy focuses on the quality of our ingredients. Domestic Papa John’s restaurants offer high-quality pizza along with side items, including breadsticks, cheesesticks, chicken poppers and wings, dessert items and canned or bottled beverages. Papa John’s original crust pizza is prepared using fresh dough (never frozen). Papa John’s pizzas are made from a proprietary blend of wheat flour; real cheese made from mozzarella; fresh-packed pizza sauce made from vine-ripened tomatoes (not from concentrate) and a proprietary mix of savory spices; and a choice of high-quality meat and vegetable toppings. Our original and pan dough crust pizza is delivered with a container of our special garlic sauce and a pepperoncini pepper. In addition to our fresh dough pizzas, we offer a par-baked thin crust and a gluten free crust. Each is served with a pepperoncini pepper. We have a continuing “clean label” initiative to remove unwanted ingredients from our product offerings over the next few years, such as synthetic colors, artificial flavors and preservatives.
We also offer limited-time pizzas on a regular basis and expect to expand these offerings in 2019. We also test new product offerings both domestically and internationally. The new products can become a part of the permanent menu if they meet certain internally established guidelines.
All ingredients and toppings can be purchased by our Company-owned and franchised restaurants from our North American Quality Control Center (“QC Center”) system, which delivers to individual restaurants twice weekly. To ensure consistent food quality, each domestic franchisee is required to purchase dough and pizza sauce from our QC Centers and to purchase all other supplies from our QC Centers or other approved suppliers. Internationally, the menu may be more diverse than in our domestic operations to meet local tastes and customs. Most QC Centers outside the U.S. are operated by franchisees pursuant to license agreements or by other third parties. The Company currently operates only one international QC Center, which is in the United Kingdom (“UK”). Our China QC Center was sold to a franchisee in 2018 and our QC Center in Mexico City was sold to a franchisee in early 2019. We provide significant assistance to licensed QC Centers in sourcing approved quality suppliers. All QC Centers are required to meet food safety and quality standards and to be in compliance with all applicable laws.
Efficient Operating System. We believe our operating and distribution systems, restaurant layout and designated delivery areas result in improved food quality and customer service as well as lower restaurant operating costs. Our QC Center system takes advantage of volume purchasing of food and supplies. The QC Center system also provides consistency and efficiencies of scale in fresh dough production. This eliminates the need for each restaurant to order food from multiple vendors and commit substantial labor and other resources to dough preparation.
Commitment to Team Member Training and Development. We are committed to the development and motivation of our team members through training programs, including our leadership development programs, Diversity, Equity and Inclusion initiatives and training, incentive and recognition programs and opportunities for advancement. Team member training programs are conducted for Company-owned restaurant team members, and operational training is offered to our franchisees. We offer performance-based financial incentives to corporate team members and restaurant managers.
Marketing. Our branding efforts seek to showcase the values of the Company and its team members. We evaluate marketing investments with respect to their ability to activate and accelerate positive consumer sentiment, utilizing campaigns that spotlight the Company’s differentiated focus on quality, better ingredients and better pizza.
5
Our domestic marketing strategy consists of both national and local components. Our national strategy includes national advertising via television, print, direct mail, digital, mobile marketing and social media channels. Our digital marketing activities have increased significantly over the past several years in response to increasing customer use of online and mobile web technology. Local advertising programs include television, radio, print, direct mail, store-to-door flyers, digital, mobile marketing and local social media channels. See “Marketing Programs” below, which describes more local marketing programs.
In international markets, our marketing focuses on reaching customers who live or work within a small radius of a Papa John’s restaurant. Our international markets use a combination of advertising strategies, including television, radio, print, digital, mobile marketing and local social media depending on the size of the local market.
Technology. We use technology to deliver a better customer experience, focusing on key strategies that offer benefits to the customer as well as advancing our objectives of higher customer lifetime value and deeper brand affinity.
Our technology initiatives build on our past milestones, which include the introduction of digital ordering across all our U.S. delivery restaurants in 2001 and the launch of a domestic digital rewards program in 2010. In 2018, over 60% of domestic sales were placed through digital channels. Technology investments have included enhanced digital ordering and expanded mobile app capabilities. As we continue to enhance our digital capabilities, we have focused on technology investments that allow us to use data to target marketing programs to individual customers as well as customer segments. In late 2018, we relaunched our digital rewards program with enhanced targeted marketing capabilities.
Franchise System. We are committed to developing and maintaining a strong franchise system by attracting experienced operators, supporting them to expand and grow their business and monitoring their compliance with our high standards. We seek to attract and retain franchisees with experience in restaurant or retail operations and with the financial resources and management capability to open single or multiple locations. While each Papa John’s franchisee manages and operates its own restaurants and business, we devote significant resources to providing franchisees with assistance in restaurant operations, training, marketing, site selection and restaurant design.
Our strategy for global franchise unit growth focuses on our sound unit economics model. We strive to eliminate barriers to expansion in existing international markets, and identify new market opportunities. Our growth strategy varies based on the maturity and penetration of the market and other factors in specific domestic and international markets, with overall unit growth expected to come increasingly from international markets.
Restaurant Sales and Investment Costs
We are committed to maintaining sound restaurant unit economics. In 2018, the 637 domestic Company-owned restaurants included in the full year’s comparable restaurant base generated average annual unit sales of $1.07 million. Our North American franchise restaurants, which included 2,396 restaurants in the full year’s comparable base for 2018, generated average annual unit sales of $840,000. Average annual unit sales for North American franchise restaurants are lower than those of Company-owned restaurants as a higher percentage of our Company-owned restaurants are located in more heavily penetrated markets.
With only a few exceptions, domestic restaurants do not offer dine-in service, which reduces our restaurant capital investment. The average cash investment for the six domestic traditional Company-owned restaurants opened during 2018, exclusive of land, was approximately $345,000 per unit, compared to the $354,000 investment for the 12 domestic traditional units opened in 2017, excluding tenant allowances that we received. In recent years, we have experienced an increase in the cost of our new restaurants primarily as a result of building larger units and incurring higher costs of certain equipment as a result of technology enhancements and increased costs to comply with applicable regulations.
We define a “traditional” domestic Papa John’s restaurant as a delivery and carryout unit that services a defined trade area. We consider the location of a traditional restaurant to be important and therefore devote significant resources to the investigation and evaluation of potential sites. The site selection process includes a review of trade area demographics, target population density and competitive factors. A member of our development team inspects each potential domestic Company-owned restaurant location and substantially all franchised restaurant locations before a site is approved. Papa
6
John’s restaurants are typically located in strip shopping centers or freestanding buildings that provide visibility, curb appeal and accessibility. Our restaurant design can be configured to fit a wide variety of building shapes and sizes, which increases the number of suitable locations for our Company-owned and franchised restaurants. A typical traditional domestic Papa John’s restaurant averages 1,100 to 1,500 square feet with visible exterior signage.
“Non-traditional” Papa John’s restaurants generally do not provide delivery service but rather provide walk-up or carryout service to a captive customer group within a designated facility, such as a food court at an airport, university or military base or an event-driven service at facilities such as sports stadiums or entertainment venues. Non-traditional units are designed to fit the unique requirements of the venue and may not offer the full range of menu items available in our traditional restaurants.
As of December 30, 2018, all of our international restaurants are franchised. Generally, our international Papa John’s restaurants are slightly smaller than our domestic restaurants and average between 900 and 1,400 square feet; however, in order to meet certain local customer preferences, some international restaurants have been opened in larger spaces to accommodate both dine-in and restaurant-based delivery service, ranging from 35 to 140 seats.
Development
At December 30, 2018, there were 5,303 Papa John’s restaurants operating in all 50 states and in 46 international countries and territories, as follows:
|
|
Domestic Company-owned |
Franchised North America |
Total North America |
International |
System-wide |
|
|
|
|
|
|
|
|
Beginning - December 31, 2017 |
708 |
2,733 |
3,441 |
1,758 |
5,199 |
|
Opened |
6 |
83 |
89 |
304 |
393 |
|
Closed |
(7) |
(186) |
(193) |
(96) |
(289) |
|
Acquired |
- |
62 |
62 |
34 |
96 |
|
Sold |
(62) |
- |
(62) |
(34) |
(96) |
|
Ending - December 30, 2018 |
645 |
2,692 |
3,337 |
1,966 |
5,303 |
Although most of our domestic Company-owned markets are well-penetrated, our Company-owned growth strategy is to continue to open domestic restaurants in existing markets as appropriate, thereby increasing consumer awareness and enabling us to take advantage of operational and marketing efficiencies. Our experience in developing markets indicates that market penetration through the opening of multiple restaurants in a particular market results in increased average restaurant sales in that market over time. We have co-developed domestic markets with some franchisees or divided markets among franchisees and will continue to utilize market co-development in the future, where appropriate.
Of the total 3,337 North American restaurants open as of December 30, 2018, 645 units, or approximately 19%, were Company-owned (including 183 restaurants owned in joint venture arrangements with franchisees in which the Company has a majority ownership position and control). Operating Company-owned restaurants allows us to improve operations, training, marketing and quality standards for the benefit of the entire system. From time to time, we evaluate the purchase or sale of units or markets, which could change the percentage of Company-owned units. During 2018, we sold 62 restaurants located in Denver, Colorado and in Minnesota, in each case to a franchise group.
All of the 1,966 international restaurants are franchised after the 2018 sale of the Company’s 34 restaurants located in Beijing and North China.
QC Center System and Supply Chain Management
Our North American QC Center system currently comprises 11 full-service regional production and distribution centers in the U.S which supply pizza sauce, dough, food products, paper products, smallwares and cleaning supplies twice weekly to each traditional restaurant served. Additionally, we have one QC Center in Canada, which produces and distributes fresh dough. This system enables us to monitor and control product quality and consistency while lowering food and other
7
costs. We evaluate the QC Center system capacity in relation to existing restaurants’ volumes and planned restaurant growth, and facilities are developed or upgraded as operational or economic conditions warrant.
In addition, we currently own a full-service international QC Center in Milton Keynes, United Kingdom. Other international QC Centers are licensed to franchisees or non-franchisee third parties and are generally located in the markets where our franchisees have restaurants.
We set quality standards for all products used in Papa John’s restaurants and designate approved outside suppliers of food and paper products that meet our quality standards. To ensure product quality and consistency, all domestic Papa John’s restaurants are required to purchase pizza sauce and dough from QC Centers. Franchisees may purchase other goods directly from our QC Centers or other approved suppliers. National purchasing agreements with most of our suppliers generally result in volume discounts to us, allowing us to sell products to our restaurants at prices we believe are below those generally available to other restaurants. Within our North American QC Center system, products are primarily distributed to restaurants by leased refrigerated trucks operated by us.
Marketing Programs
Our local restaurant-level marketing programs target potential customers within the delivery area of each restaurant through the use of local television, radio, print materials, targeted direct mail, store-to-door flyers, digital display advertising, email marketing, text messages and local social media. Local marketing efforts also include a variety of community-oriented activities within schools, sports venues and other organizations supported with some of the same advertising vehicles mentioned above. We recently began working with delivery aggregators to reach other customer channels and also enhanced our domestic loyalty program at the end of 2018.
Domestic Company-owned and franchised Papa John’s restaurants within a defined market may be required to join an area advertising cooperative (“Co-op”). Each member restaurant contributes a percentage of sales to the Co-op for market-wide programs, such as television, radio, digital and print advertising, and sports sponsorships. The rate of contribution and uses of the monies collected are determined by a majority vote of the Co-op’s members. The contribution rate for Co-ops generally may not be below 2% of sales without approval from Papa John’s.
The restaurant-level and Co-op marketing efforts are supported by media, print, digital and electronic advertising materials that are produced by Papa John’s Marketing Fund, Inc. (“PJMF”). PJMF is an unconsolidated nonstock corporation designed to operate at break-even for the purpose of designing and administering advertising and promotional programs for all participating domestic restaurants. PJMF produces and buys air time for Papa John’s national television commercials, and advertises the Company’s products through digital media including banner advertising, paid search-engine advertising, mobile marketing, social media advertising and marketing, text messaging, and emailing. It also engages in other brand-building activities, such as consumer research and public relations activities. Domestic Company-owned and franchised Papa John’s restaurants are required to contribute a certain minimum percentage of sales to PJMF. The contribution rate to PJMF can be set at up to 3% of sales, if approved by the governing board of PJMF, and beyond that level if approved by a supermajority of domestic restaurants. The domestic franchise system approved a new contribution rate of 4.50% effective in the fourth quarter of 2017. The rate increased an additional 0.25% to 4.75% effective at the beginning of 2019.
Our proprietary domestic digital ordering platform allows customers to order online, including “plan ahead ordering,” Apple TV ordering and Spanish-language ordering capability. Digital payment platforms include VISA Checkout, PayPal, and Venmo PayShare. We provide enhanced mobile ordering for our customers, including Papa John’s iPhone® and Android® applications. Our Papa Rewards® program is a customer loyalty program designed to increase loyalty and frequency; we offer this program domestically, in the UK, and in several international markets. We receive a percentage-based fee from North American franchisees for online sales, in addition to royalties, to defray development and operating costs associated with our digital ordering platform. We believe continued innovation and investment in the design and functionality of our online and mobile platforms is critical to the success of our brand.
Our domestic restaurants offer customers the opportunity to purchase reloadable gift cards, sold as either a plastic gift card purchased in our restaurants, or an online digital card. Gift cards are sold to customers on our website, through third-party
8
retailers, and in bulk to business entities and organizations. We continue to explore other gift card distribution opportunities. Gift cards may be redeemed for delivery, carryout, and digital orders and are accepted at all Papa John’s traditional domestic restaurants.
We provide both Company-owned and franchised restaurants with pre-approved marketing materials and catalogs for the purchase of promotional items. We also provide direct marketing services to Company-owned and domestic franchised restaurants using customer information gathered by our proprietary point-of-sale technology (see “Company Operations —North America Point-of-Sale Technology”). In addition, we provide database tools, templates and training for operators to facilitate local email marketing and text messaging through our approved tools.
In international markets, our marketing focuses on customers who live or work within a small radius of a Papa John’s restaurant. Certain markets can effectively use television and radio as part of their marketing strategies. The majority of the marketing efforts include using print materials such as flyers, newspaper inserts, in-store marketing materials, and to a growing extent, digital marketing such as display, search engine marketing, social media, mobile marketing, email, and text messaging. Local marketing efforts, such as sponsoring or participating in community events, sporting events and school programs, are also used to build customer awareness.
Company Operations
Domestic Restaurant Personnel. A typical Papa John’s Company-owned domestic restaurant employs a restaurant manager and approximately 20 to 25 hourly team members, many of whom work part-time. The manager is responsible for the day-to-day operation of the restaurant and maintaining Company-established operating standards. We seek to hire experienced restaurant managers and staff and provide comprehensive training programs in areas such as operations and managerial skills. We also employ directors of operations who are responsible for overseeing an average of seven Company-owned restaurants. Senior management and corporate staff also support the field teams in many areas, including, but not limited to, quality assurance, food safety, training, marketing and technology. We seek to motivate and retain personnel by providing opportunities for advancement and performance-based financial incentives.
Training and Education. We believe training is very important to delivering consistent operational execution, and we create tools and materials for the operational training and development of both corporate and franchise team members. Operations personnel complete our management training program and ongoing development programs, including multi-unit training, in which instruction is given on all aspects of our systems and operations.
North America Point-of-Sale Technology. Our proprietary point-of-sale technology, “FOCUS”, is in place in all North America traditional Papa John’s restaurants. We believe this technology facilitates fast and accurate order-taking and pricing, and allows the restaurant manager to better monitor and control food and labor costs, including food inventory management and order placement from QC Centers. The system allows us to obtain restaurant operating information, providing us with timely access to sales and customer information. The FOCUS system is also integrated with our digital ordering solutions in all North American traditional Papa John’s restaurants.
Domestic Hours of Operation. Our domestic restaurants are open seven days a week, typically from 11:00 a.m. to 12:30 a.m. Monday through Thursday, 11:00 a.m. to 1:30 a.m. on Friday and Saturday and 12:00 noon to 11:30 p.m. on Sunday. Carryout hours are generally more limited for late night service, for security purposes.
Franchise Program
General. We continue to attract qualified and experienced franchisees, whom we consider to be a vital part of our system’s continued growth. We believe our relationship with our franchisees is fundamental to the performance of our brand and we strive to maintain a collaborative relationship with our franchisees. As of December 30, 2018, there were 4,658 franchised Papa John’s restaurants operating in all 50 states and 46 countries and territories. During 2018, our franchisees opened an additional 387 (83 North America and 304 internationally) restaurants, which includes the opening of Papa John’s restaurants in three new countries: the Bahamas, Kazakhstan and Kyrgyzstan. As of December 30, 2018, we have development agreements with our franchisees for approximately 130 additional North America restaurants, the majority of which are committed to open over the next two years, and agreements for approximately 900 additional international franchised restaurants, the majority of which are scheduled to open over the next six years. There can be no assurance that
9
all of these restaurants will be opened or that the development schedules set forth in the development agreements will be achieved.
Approval. Franchisees are approved on the basis of the applicant’s business background, restaurant operating experience and financial resources. We seek franchisees to enter into development agreements for single or multiple restaurants. We require each franchisee to complete our training program or to hire a full-time operator who completes the training and has either an equity interest or the right to acquire an equity interest in the franchise operation. For most non-traditional operations and for operations outside the United States, we will allow an approved operator bonus plan to substitute for the equity interest.
North America Development and Franchise Agreements. We enter into development agreements with our franchisees in North America for the opening of a specified number of restaurants within a defined period of time and specified geographic area. Our standard domestic development agreement includes a fee of $25,000 before consideration of any incentives. The franchise agreement is generally executed once a franchisee secures a location. Our current standard franchise agreement requires the franchisee to pay a royalty fee of 5% of sales, and the majority of our existing franchised restaurants have a 5% contractual royalty rate in effect. Incentives offered from time to time, including new store incentives, will reduce the actual royalty rate paid. Incentives in effect in the later part of 2018 to support the franchise system included a royalty reduction of 2% and 1% for the third and fourth quarters, respectively.
Over the past several years, we have offered various development incentive programs for domestic franchisees to accelerate unit openings. Such incentives included the following for 2018 traditional openings: (1) waiver of the standard one-time $25,000 franchise fee if the unit opens on time in accordance with the agreed-upon development schedule, or a reduced fee of $5,000 if the unit opens late; (2) the waiver of some or all of the 5% royalty fee for a period of time; (3) a credit for new store equipment; and (4) a credit to be applied toward a future food purchase, under certain circumstances. We believe development incentive programs have accelerated unit openings.
Substantially all existing franchise agreements have an initial 10-year term with a 10-year renewal option. We have the right to terminate a franchise agreement for a variety of reasons, including a franchisee’s failure to make payments when due or failure to adhere to our operational policies and standards. Many state franchise laws limit our ability as a franchisor to terminate or refuse to renew a franchise.
We provide assistance to Papa John’s franchisees in selecting sites, developing restaurants and evaluating the physical specifications for typical restaurants. We provide layout and design services and recommendations for subcontractors, signage installers and telephone systems to Papa John’s franchisees. Our franchisees can purchase complete new store equipment packages through an approved third-party supplier. We sell replacement smallwares and related items to our franchisees. Each franchisee is responsible for selecting the location for its restaurants, but must obtain our approval of the restaurant design and location based on traffic accessibility and visibility of the site and targeted demographic factors, including population density, income, age and traffic.
Domestic Franchise Support Initiatives. In 2018, we have increased our franchise support initiatives in light of the current sales pressures by providing additional royalty reductions of 2% and 1% in the third and fourth quarters, respectively. Historically, discretionary support initiatives to our domestic franchisees, included the following:
|
· |
Performance-based incentives; |
|
· |
Targeted royalty relief and local marketing support to assist certain identified franchisees or markets; |
|
· |
Restaurant opening incentives; and |
|
· |
Reduced-cost direct mail campaigns from Preferred Marketing Solutions (“Preferred”), our wholly owned print and promotions subsidiary. |
In 2019, we plan to offer some or all of these domestic franchise support initiatives, with a particular focus of providing assistance to franchisees in emerging and/or high cost markets.
International Development and Franchise Agreements. We define “international” as all markets outside the United States and Canada. In international markets, we have either a development agreement or a master franchise agreement with a
10
franchisee for the opening of a specified number of restaurants within a defined period of time and specified geographic area. Under a master franchise agreement, the franchisee has the right to sub-franchise a portion of the development to one or more sub-franchisees approved by us. Under our current standard international development or master franchise agreement, the franchisee is required to pay total fees of $25,000 per restaurant: $5,000 at the time of signing the agreement and $20,000 when the restaurant opens or on the agreed-upon development date, whichever comes first. Additionally, under our current standard master franchise agreement, the master franchisee is required to pay $15,000 for each sub-franchised restaurant — $5,000 at the time of signing the agreement and $10,000 when the restaurant opens or on the agreed-upon development date, whichever comes first.
Our current standard international master franchise and development agreements provide for payment to us of a royalty fee of 5% of sales. For international markets with sub-franchise agreements, the effective sub-franchise royalty received by the Company is generally 3% of sales and the master franchisee generally receives a royalty of 2% of sales. The remaining terms applicable to the operation of individual restaurants are substantially equivalent to the terms of our domestic franchise agreement. Development agreements will be negotiated at other-than-standard terms for fees and royalties, and we may offer various development and royalty incentives to help drive net unit growth and results.
Non-traditional Restaurant Development. We had 247 non-traditional domestic restaurants at December 30, 2018. Non-traditional restaurants generally cover venues or areas not originally targeted for traditional unit development, and our franchised non-traditional restaurants have terms differing from the standard agreements.
Franchisee Loans. Selected domestic and international franchisees have borrowed funds from us, principally for the purchase of restaurants from us or other franchisees or for construction and development of new restaurants. Loans made to franchisees can bear interest at fixed or floating rates and in most cases are secured by the fixtures, equipment and signage of the restaurant and/or are guaranteed by the franchise owners. At December 30, 2018, net loans outstanding totaled $28.8 million. See “Note 13” of “Notes to Consolidated Financial Statements” for additional information.
Domestic Franchise Training and Support. Our domestic field support structure consists of franchise business directors who are responsible for serving an average of 165 franchised units each. Our franchise business directors maintain open communication with the franchise community, relaying operating and marketing information and new initiatives between franchisees and us.
Every franchisee is required to have a principal operator approved by us who satisfactorily completes our required training program. Principal operators for traditional restaurants are required to devote their full business time and efforts to the operation of the franchisee’s traditional restaurants. Each franchised restaurant manager is also required to complete our Company-certified management operations training program and we monitor ongoing compliance with training. Multi-unit franchisees are encouraged to appoint training store general managers or hire a full-time training coordinator certified to deliver Company-approved operational training programs.
International Franchise Operations Support. We employ or contract with international business directors who are responsible for supporting one or more franchisees. The international business directors usually report to regional vice presidents. Senior management and corporate staff also support the international field teams in many areas, including, but not limited to, food safety, quality assurance, marketing, technology, operations training and financial analysis.
Franchise Operations. All franchisees are required to operate their Papa John’s restaurants in compliance with our policies, standards and specifications, including matters such as menu items, ingredients, and restaurant design. Franchisees have full discretion in human resource practices, and generally have full discretion to determine the prices to be charged to customers, but we generally have the authority to set maximum price points for nationally advertised promotions.
Franchise Advisory Council. We have a franchise advisory council that consists of Company and franchisee representatives of domestic restaurants. We also have a franchise advisory council in the United Kingdom. The various councils and subcommittees hold regular meetings to discuss new product and marketing ideas, operations, growth and other business issues. Certain domestic franchisees have also formed an independent franchise association for the purpose of communicating and addressing issues, needs and opportunities among its members.
11
We currently communicate with, and receive input from, our franchisees in several forms, including through the various councils, annual operations conferences, system communications, national conference calls, various regional meetings conducted with franchisees throughout the year and ongoing communications from franchise business directors and international business directors in the field. Monthly webcasts are also conducted by the Company to discuss current operational, marketing and other issues affecting the domestic franchisees’ business. We are committed to communicating with our franchisees and receiving input from them.
Industry and Competition
The United States Quick Service Restaurant pizza (“QSR Pizza”) industry is mature and highly competitive with respect to price, service, location, food quality, customer loyalty programs and product innovation. There are well-established competitors with substantially greater financial and other resources than Papa John’s. The category is largely fragmented and competitors include international, national and regional chains, as well as a large number of local independent pizza operators, any of which can utilize a growing number of food delivery services. Some of our competitors have been in existence for substantially longer periods than Papa John’s and can have higher levels of restaurant penetration and stronger, more developed brand awareness in markets where we compete. According to industry sources, domestic QSR Pizza category sales, which includes dine-in, carry out and delivery, totaled approximately $37 billion in 2018, or an increase of 2.0% from the prior year. Competition from delivery aggregators and other food delivery concepts continues to increase both domestically and internationally.
With respect to the sale of franchises, we compete with many franchisors of restaurants and other business concepts. There is also active competition for management personnel, drivers and hourly team members, and attractive commercial real estate sites suitable for Papa John’s restaurants.
We, along with our franchisees, are subject to various federal, state, local and international laws affecting the operation of our respective businesses, including laws and regulations related to the preparation and sale of food, including food safety and menu labeling. Each Papa John’s restaurant is subject to licensing and regulation by a number of governmental authorities, which include zoning, health, safety, sanitation, building and fire agencies in the state or municipality in which the restaurant is located. Difficulties in obtaining, or the failure to obtain, required licenses or approvals could delay or prevent the opening of a new restaurant in a particular area. Our QC Centers are licensed and subject to regulation by state and local health and fire codes, and the operation of our trucks is subject to federal and state transportation regulations. We are also subject to federal and state environmental regulations. In addition, our domestic operations are subject to various federal and state laws governing such matters as minimum wage requirements, benefits, working conditions, citizenship requirements, and overtime.
We are subject to Federal Trade Commission (“FTC”) regulation and various state laws regulating the offer and sale of franchises. The laws of several states also regulate substantive aspects of the franchisor-franchisee relationship. The FTC requires us to furnish to prospective franchisees a franchise disclosure document containing prescribed information. State laws that regulate the franchisor-franchisee relationship presently exist in a significant number of states, and bills have been introduced in Congress from time to time that would provide for federal regulation of the U.S. franchisor-franchisee relationship in certain respects if such bills were enacted. State laws often limit, among other things, the duration and scope of non-competition provisions and the ability of a franchisor to terminate or refuse to renew a franchise. Some foreign countries also have disclosure requirements and other laws regulating franchising and the franchisor-franchisee relationship. National, state and local government regulations or initiatives, including health care legislation, “living wage,” or other current or proposed regulations, and increases in minimum wage rates affect Papa John’s as well as others within the restaurant industry. As we expand internationally, we are also subject to applicable laws in each jurisdiction.
We are subject to laws and regulations that require us to disclose calorie content and other specific content of our food, including fat, trans fat, and salt content. A provision of the Patient Protection and Affordable Care Act of 2010 (ACA) requires us and many restaurant companies to disclose calorie information on restaurant menus. The Food and Drug Administration issued final rules to implement this provision, which require restaurants to post the number of calories for most items on menus or menu boards and to make available certain other nutritional information. Government regulation
12
of nutrition disclosure could result in increased costs of compliance and could also impact consumer habits in a way that adversely impacts sales at our restaurants. For further information regarding governmental regulation, see Item 1A. Risk Factors.
Trademarks, Copyrights and Domain Names
Our intellectual property rights are a significant part of our business. We have registered and continue to maintain federal registrations through the United States Patent and Trademark Office (the “USPTO”) for the marks PAPA JOHN’S, PIZZA PAPA JOHN’S & Design (our logo), BETTER INGREDIENTS. BETTER PIZZA., PIZZA PAPA JOHN’S BETTER INGREDIENTS. BETTER PIZZA., PIZZA PAPA JOHN’S BETTER INGREDIENTS. BETTER PIZZA. & Design, and PAPA REWARDS. We also own federal registrations through the USPTO for several ancillary marks, principally advertising slogans. Moreover, we have registrations for and/or have applied for PIZZA PAPA JOHN’S & Design in more than 100 foreign countries and the European Community, in addition to international registrations for PAPA JOHN’S and PIZZA PAPA JOHN’S BETTER INGREDIENTS. BETTER PIZZA. & Design in various foreign countries. From time to time, we are made aware of the use by other persons in certain geographical areas of names and marks that are the same as or substantially similar to our marks. It is our policy to pursue registration of our marks whenever possible and to vigorously oppose any infringement of our marks.
We hold copyrights in authored works used in our business, including advertisements, packaging, training, website, and promotional materials. In addition, we have registered and maintain Internet domain names, including “papajohns.com,” and approximately 83 country code domains patterned as papajohns.cc, or a close variation thereof, with “.cc” representing a specific country code.
Employees
As of December 30, 2018, we employed approximately 18,000 persons, of whom approximately 15,400 were restaurant team members, approximately 700 were restaurant management personnel, approximately 700 were corporate personnel and approximately 1,200 were QC Center and Preferred personnel. Most restaurant team members work part-time and are paid on an hourly basis. None of our team members are covered by a collective bargaining agreement. We consider our team member relations to be good.
We are subject to risks that could have a negative effect on our business, financial condition and results of operations. These risks could cause actual operating results to differ from those expressed in certain “forward looking statements” contained in this Form 10-K as well as in other Company communications. Before you invest in our securities, you should carefully consider the following risk factors together with all other information included in this Form 10-K and our other publicly filed documents.
We have recently experienced negative publicity and consumer sentiment as a result of statements by the Company’s founder and former spokesperson, John H. Schnatter, which may continue to negatively impact our results of operations.
In July 2018, the Company was the subject of significant negative media reports as a result of certain statements by Mr. Schnatter, who resigned as Chairman of the Board on July 11, 2018. The negative media continued throughout the third quarter of 2018, and the resultant negative consumer sentiment continued throughout the remainder of the 2018 fiscal year.
As a result of the recent negative publicity and consumer sentiment, the Company has experienced a decline in sales and operating profits. This decline may continue if the negative consumer sentiment toward the Company continues or worsens. If Mr. Schnatter makes further statements that create controversy or harm the Company’s reputation, it may take longer for our sales and consumer perception of our brand to improve.
13
We will incur costs related to addressing and remediating the impact of recent negative publicity surrounding our brand as a result of John H. Schnatter, which will adversely impact our financial performance.
In connection with the controversy surrounding Mr. Schnatter, a Special Committee of the Board of Directors, consisting of all of the independent directors, was formed to evaluate and take action with respect to all of the Company’s relationships and arrangements with Mr. Schnatter. Following its formation, the Special Committee terminated Mr. Schnatter’s Founder Agreement, which defined his role in the Company, among other things, as advertising and brand spokesperson for the Company.
In connection with these and other actions, the Company has incurred and expects to continue to incur significant non-recurring costs in 2019, including costs related to branding initiatives, marketing and advertising expenses and increased professional fees. In addition, the Company materially increased its franchisee financial assistance in 2018 in an effort to mitigate store closings, and expects to continue some additional level of assistance in 2019. These costs and any additional costs we may incur to support these initiatives are expected to adversely affect our profitability and financial performance. There is no guarantee that our actions will be effective in attracting customers back to our restaurants and mitigating negative sales trends.
The recent negative publicity has had and may continue to have a negative impact on our business, and may have a long-term effect on our relationships with our customers, partners and franchisees.
Our business and reputation has been negatively affected by the recent negative publicity resulting from Mr. Schnatter’s statements. If we are unable to rebuild the trust of our customers, franchisees, business partners and suppliers, and if further negative publicity continues, we could experience a substantial negative impact on our business. We have experienced claims and litigation as a consequence of these matters, including a shareholder class action in connection with a decline in our stock price and litigation with Mr. Schnatter. Related legal expenses of defending these claims have negatively impacted our operating results. Continuing higher legal fees, potential new claims, liabilities from existing cases and continuing negative publicity could continue to have a negative impact on operating results.
We have experienced declining sales, and we cannot assure that we will be able to halt or reverse the decline.
Our system-wide North America and International comparable sales declined on a year-over-year basis in 2018. The Company’s revenues and profitability growth depend on the ability to increase comparable restaurant sales, and it is uncertain whether this will occur or could take longer than expected.
Our Board of Directors has adopted a limited duration stockholder rights agreement, which could delay or discourage a merger, tender offer, or assumption of control of the Company not approved by our Board of Directors.
On July 22, 2018, the Board of Directors approved the adoption of a limited duration stockholder rights plan (the “Rights Plan”) with an expiration date of July 22, 2019 and an ownership trigger threshold of 15% (with a threshold of 31% applied to John H. Schnatter, together with his affiliates and family members). In connection with the Rights Plan, the Board of Directors authorized and declared a dividend to stockholders of record at the close of business on August 2, 2018 of one preferred share purchase right (a “Right”) for each outstanding share of common stock of the Company. Upon certain triggering events, each Right entitles the holder to purchase from the Company one one-thousandth (subject to adjustment) of one share of Series A Junior Participating Preferred Stock, $0.01 par value per share (“Preferred Stock”) of the Company at an exercise price of $250.00 (the “Exercise Price”) per one one-thousandth of a share of Preferred Stock. In addition, if a person or group acquires beneficial ownership of 15% or more of the Company’s common stock (or in the case of Mr. Schnatter, 31% or more, and in the case of funds affiliated with Starboard Value LP, additional shares in excess of those issuable upon conversion of their Series B Convertible Preferred Stock) without prior board approval, each holder of a Right (other than the acquiring person or group whose Rights will become void) will have the right to purchase, upon payment of the Exercise Price and in accordance with the terms of the Rights Plan, a number of shares of the Company’s common stock having a market value of twice the Exercise Price. On March 5, 2019, the Board of Directors extended the term of the Rights Plan to March 6, 2022, increased the ownership trigger threshold at which a person becomes an acquiring person from 15% to 20%, except as set forth above, removed the “acting in concert” provision in response to stockholder feedback, and included a qualifying offer provision as set forth in the Rights Plan.
14
The Rights Plan is intended to enable all of our stockholders to realize the full potential value of their investment in the Company and to protect the interests of the Company and its stockholders by reducing the likelihood that any person or group gains control of the Company through open market accumulation or other tactics without paying an appropriate control premium. The Rights Plan could render more difficult, or discourage, a merger, tender offer, or assumption of control of the Company that is not approved by our Board of Directors. The Rights Plan, however, should not interfere with any merger, tender or exchange offer or other business combination approved by our Board of Directors. In addition, the Rights Plan does not prevent our Board of Directors from considering any offer that it considers to be in the best interest of the Company’s stockholders.
Our profitability may suffer as a result of intense competition in our industry.
The QSR Pizza industry is mature and highly competitive. Competition is based on price, service, location, food quality, brand recognition and loyalty, product innovation, effectiveness of marketing and promotional activity, use of technology, and the ability to identify and satisfy consumer preferences. We may need to reduce the prices for some of our products to respond to competitive and customer pressures, which may adversely affect our profitability. When commodity and other costs increase, we may be limited in our ability to increase prices. With the significant level of competition and the pace of innovation, we may be required to increase investment spending in several areas, particularly marketing and technology, which can decrease profitability.
In addition to competition with our larger and more established competitors, we face competition from new competitors such as fast casual pizza concepts. We also face competitive pressures from an array of food delivery concepts and aggregators delivering for quick service or dine in restaurants, using new delivery technologies, some of which may have more effective marketing. The emergence or growth of new competitors, in the pizza category or in the food service industry generally, may make it difficult for us to maintain or increase our market share and could negatively impact our sales and our system-wide restaurant operations. We also face increasing competition from other home delivery services and grocery stores that offer an increasing variety of prepped or prepared meals in response to consumer demand. As a result, our sales can be directly and negatively impacted by actions of our competitors, the emergence or growth of new competitors, consumer sentiment or other factors outside our control.
One of our competitive strengths is our “BETTER INGREDIENTS. BETTER PIZZA.” brand promise. This means we may use ingredients that cost more than the ingredients some of our competitors may use. Because of our investment in higher-quality ingredients and our focus on a “clean label”, we could have lower profit margins than some of our competitors if we are not able to establish a quality differentiator that resonates with consumers. Our sales may be particularly impacted as competitors increasingly emphasize lower-cost menu options.
Changes in consumer preferences or discretionary consumer spending could adversely impact our results.
Changes in consumer preferences and trends (for example, changes in consumer perceptions of certain ingredients that could cause consumers to avoid pizza or some of its ingredients in favor of foods that are or are perceived as healthier, lower-calorie, or lower in carbohydrate or otherwise based on their ingredients or nutritional content). Preferences for a dining experience such as fast casual pizza concepts, could also adversely affect our restaurant business and reduce the effectiveness of our marketing and technology initiatives. Also, our success depends to a significant extent on numerous factors affecting consumer confidence and discretionary consumer income and spending, such as general economic conditions, customer sentiment and the level of employment. Any factors that could cause consumers to spend less on food or shift to lower-priced products could reduce sales or inhibit our ability to maintain or increase pricing, which could adversely affect our operating results.
Food safety and quality concerns may negatively impact our business and profitability.
Incidents or reports of food- or water-borne illness or other food safety issues, investigations or other actions by food safety regulators, food contamination or tampering, employee hygiene and cleanliness failures, improper franchisee or employee conduct, or presence of communicable disease at our restaurants (Company-owned and franchised), QC Centers, or suppliers could lead to product liability or other claims. If we were to experience any such incidents or reports, our
15
brand and reputation could be negatively impacted. This could result in a significant decrease in customer traffic and could negatively impact our revenues and profits. Similar incidents or reports occurring at quick service restaurants unrelated to us could likewise create negative publicity, which could negatively impact consumer behavior towards us.
We rely on our domestic and international suppliers, as do our franchisees, to provide quality ingredients and to comply with applicable laws and industry standards. A failure of one of our domestic or international suppliers to meet our quality standards, or meet domestic or international food industry standards, could result in a disruption in our supply chain and negatively impact our brand and our results.
Failure to preserve the value and relevance of our brand could have a negative impact on our financial results.
Our results depend upon our ability to differentiate our brand and our reputation for quality. Damage to our brand or reputation could negatively impact our business and financial results. Our brand has been highly rated in U.S. surveys, and we strive to build the value of our brand as we develop international markets. As we experienced in 2018, the value of our brand and demand for our products could be damaged by any incidents that harm consumer perceptions of the Company, including negative publicity and consumer sentiment.
To be successful in the future, we must work to overcome the negative publicity we experienced in 2018, and preserve, enhance and leverage the value of our brand. Consumer perceptions of our brand are affected by a variety of factors, such as the nutritional content and preparation of our food, the quality of the ingredients we use, our corporate culture, our policies and systems related to diversity, equity and inclusion, our business practices and the manner in which we source the commodities we use. Consumer acceptance of our offerings is subject to change for a variety of reasons, and some changes can occur rapidly. Consumer perceptions may also be affected by third parties presenting or promoting adverse commentary or portrayals of our industry, our brand, our suppliers or our franchisees. If we are unsuccessful in managing incidents that erode consumer trust or confidence, particularly if such incidents receive considerable publicity or result in litigation, our brand value and financial results could be negatively impacted.
Our inability or failure to recognize, respond to and effectively manage the accelerated impact of social media could adversely impact our business.
In recent years, there has been a marked increase in the use of social media platforms, including blogs, chat platforms, social media websites, and other forms of internet-based communications that allow individuals access to a broad audience of consumers and other persons. The rising popularity of social media and other consumer-oriented technologies has increased the speed and accessibility of information dissemination. The dissemination of negative information via social media could harm our business, brand, reputation, marketing partners, financial condition, and results of operations, regardless of the information’s accuracy.
In addition, we frequently use social media to communicate with consumers and the public in general. Failure to use social media effectively could lead to a decline in brand value and revenue. Other risks associated with the use of social media include improper disclosure of proprietary information, negative comments about our brand, exposure of personally identifiable information, fraud, hoaxes or malicious dissemination of false information.
We may not be able to effectively market our products or maintain key marketing partnerships.
The success of our business depends on the effectiveness of our marketing and promotional plans, and in particular on the success of our efforts to relaunch our brand following the negative publicity we experienced in 2018. We may not be able to effectively execute our national or local marketing plans, particularly if lower sales continue to result in reduced levels of marketing funds. Additionally, our recent launch of an enhanced rewards program to help increase sales may not meet our expectations and could lower profitability. Our marketing strategy historically centered around the Company’s founder as brand spokesperson, and Mr. Schnatter’s removal as brand spokesperson in 2018 created the need for a new marketing strategy. We have also historically utilized relationships with well-known sporting events, professional teams and certain universities to market our products. The negative publicity we experienced in 2018 caused the loss of certain sports and university partnerships, and our business could continue to suffer if we are not able to create a compelling marketing
16
strategy, or maintain or grow key marketing relationships and sponsorships, or if we are unable to do so at a reasonable cost.
Our business will continue to require additional investments in alternative marketing strategies to address the challenges we faced in 2018. In 2018, we engaged a new advertising agency and introduced a new advertising campaign to focus the consumer’s attention on the core values of our brand. We expect to continue to invest in marketing to support the relaunch of our brand. If these efforts are not effective in increasing sales, we may be required to expend additional funds to effectively improve consumer sentiment and sales, and we may also be required to engage in additional activities to retain customers or attract new customers to the brand. Such marketing expenses and promotional activities, which could include discounting our products, could adversely impact our results.
Persons or marketing partners who endorse our products could take actions that harm their reputations, which could also cause harm to our brand. From time to time, in response to changes in the business environment and the audience share of marketing channels, we expect to reallocate marketing resources across social media and other channels. That reallocation may not be effective or as successful as the marketing and advertising allocations of our competitors, which could negatively impact the amount and timing of our revenues.
Our franchise business model presents a number of risks.
Our success increasingly relies on the financial success and cooperation of our franchisees, yet we have limited influence over their operations. Our franchisees manage their businesses independently, and therefore are responsible for the day-to-day operation of their restaurants. The revenues we realize from franchised restaurants are largely dependent on the ability of our franchisees to grow their sales. If our franchisees do not experience sales growth, our revenues and margins could be negatively affected as a result. Also, if sales trends worsen for franchisees, especially in emerging markets and/or high cost markets, their financial results may deteriorate, which could result in, among other things, higher levels of required financial support from us, higher numbers of restaurant closures, reduced numbers of restaurant openings, delayed or reduced payments to us, or increased franchisee assistance, which reduces our revenues.
Our success also increasingly depends on the willingness and ability of our franchisees to remain aligned with us on operating, promotional and marketing plans. Franchisees’ ability to continue to grow is also dependent in large part on the availability of franchisee funding at reasonable interest rates and may be negatively impacted by the financial markets in general or by the creditworthiness of our franchisees. Our operating performance could also be negatively affected if our franchisees experience food safety or other operational problems or project an image inconsistent with our brand and values, particularly if our contractual and other rights and remedies are limited, costly to exercise or subjected to litigation. If franchisees do not successfully operate restaurants in a manner consistent with our required standards, the brand’s image and reputation could be harmed, which in turn could hurt our business and operating results.
The issuance of shares of our Series B Preferred Stock to Starboard and its permitted transferees dilutes the ownership and relative voting power of holders of our common stock and may adversely affect the market price of our common stock.
Pursuant to a Securities Purchase Agreement (the “Securities Purchase Agreement”) among the Company and certain funds affiliated with or managed by Starboard Value LP (“Starboard”), the Company sold 200,000 shares of our newly designated Series B Convertible Preferred Stock, par value $0.01 per share (the “Series B Preferred Stock”) to Starboard on February 3, 2019 (the “Closing”), with Starboard having the option to purchase up to an additional 50,000 shares of Series B Preferred Stock on or prior to March 29, 2019.
The initial shares sold to Starboard at the Closing represent approximately 11% of our outstanding common stock on an as-converted basis, and would represent in the aggregate an estimated 14% of our outstanding common stock on an as-converted basis assuming Starboard exercised in full their option to purchase an additional 50,000 shares of Series B Preferred Stock. The Series B Preferred Stock is convertible at the option of the holders at any time into shares of common stock based on the conversion rate determined by dividing $1,000, the stated value of the Series B Preferred Stock, by $50.06.
17
Because holders of our Series B Preferred Stock are entitled to vote, on an as-converted basis, together with holders of our common stock on all matters submitted to a vote of the holders of our common stock, the issuance of the Series B Preferred Stock to Starboard effectively reduces the relative voting power of the holders of our common stock.
In addition, the conversion of the Series B Preferred Stock into common stock would dilute the ownership interest of existing holders of our common stock. Furthermore, following expiration of Starboard’s one-year lock-up period, any sales in the public market of the common stock issuable upon conversion of the Series B Preferred Stock could adversely affect prevailing market prices of our common stock. We granted Starboard customary registration rights in respect of their shares of Series B Preferred Stock and any shares of common stock issued upon conversion of the Series B Preferred Stock. These registration rights would facilitate the resale of such securities into the public market, and any such resale would increase the number of shares of our common stock available for public trading. Sales by Starboard of a substantial number of shares of our common stock in the public market, or the perception that such sales might occur, could have a material adverse effect on the price of our common stock.
Our Series B Preferred Stock has rights, preferences and privileges that are not held by, and are preferential to, the rights of our common stockholders, which could adversely affect our liquidity and financial condition, result in the interests of Starboard differing from those of our common stockholders and delay or prevent an attempt to take over the Company.
Starboard, as the holder of our Series B Preferred Stock, has a liquidation preference entitling it to be paid, before any payment may be made to holders of our common stock in connection with a liquidation event, an amount per share of Series B Preferred Stock equal to the greater of (i) the stated value thereof plus accrued and unpaid dividends and (ii) the amount that would have been received had such share of Series B Preferred Stock been converted into common stock immediately prior to such liquidation event.
Holders of Series B Preferred Stock are entitled to a preferential cumulative dividend at the rate of 3.6% per annum, payable quarterly in arrears. On the third anniversary of the date of issuance, each holder of Series B Preferred Stock will have the right to increase the dividend on the shares of Series B Preferred Stock held by such holder to 5.6%, and on the fifth anniversary of the date of issuance, each holder will have the right to increase the dividend on the shares of Series B Preferred Stock held by such holder to 7.6% (in each case subject to the Company’s right to redeem such shares of Series B Preferred Stock for cash).
The holders of our Series B Preferred Stock also have certain redemption rights or put rights, including the right on any date following November 6, 2026 to require us to repurchase all or any portion of the Series B Preferred Stock. Holders of the Series B Preferred Stock also have the right, subject to certain exceptions, to require us to repurchase all or any portion of the Series B Preferred Stock upon certain change of control events.
These dividend and share repurchase obligations could impact our liquidity and reduce the amount of cash flows available for working capital, capital expenditures, growth opportunities, acquisitions, and other general corporate purposes. Our obligations to Starboard, as the initial holder of our Series B Preferred Stock, could also limit our ability to obtain additional financing or increase our borrowing costs, which could have an adverse effect on our financial condition. The preferential rights could also result in divergent interests between Starboard and holders of our common stock. Furthermore, a sale of our Company, as a change of control event, may require us to repurchase Series B Preferred Stock, which could have the effect of making an acquisition of the Company more expensive and potentially deterring proposed transactions that may otherwise be beneficial to our stockholders.
18
Starboard may exercise influence over us, including through its ability to designate up to two members of our Board of Directors.
The transaction documents entered into in connection with the sale of the Series B Preferred Stock to Starboard grant to Starboard consent rights with respect to certain actions by us, including:
|
· |
amending our organizational documents in a manner that would have an adverse effect on the Series B Preferred Stock; |
|
· |
issuing securities that are senior to, or equal in priority with, the Series B Preferred Stock; and |
|
· |
increasing the maximum number of directors on our Board to more than eleven persons or twelve persons, subject to the terms of the Governance Agreement (the “Governance Agreement”) entered into in connection with the Securities Purchase Agreement. |
The Securities Purchase Agreement also imposes a number of affirmative and negative covenants on us. As a result, Starboard has the ability to influence the outcome of matters submitted for the vote of the holders of our common stock. Starboard and its affiliates are in the business of making or advising on investments in companies, including businesses that may directly or indirectly compete with certain portions of our business, and they may have interests that diverge from, or even conflict with, those of our other stockholders. They may also pursue acquisition opportunities that may be complementary to our business, and, as a result, those acquisition opportunities may not be available to us.
In addition, the terms of the Governance Agreement grant Starboard certain rights to designate directors to be nominated for election by holders of our common stock. For so long as certain criteria set forth in the Governance Agreement are satisfied, including that Starboard beneficially own, in the aggregate, at least (i) 89,264 shares of Series B Preferred Stock or (ii) the lesser of 5.0% of the Company’s then-outstanding common stock (on an as-converted basis, if applicable) and 1,783,141 shares of issued and outstanding common stock (subject to adjustment for stock splits, reclassifications, combinations and similar adjustments), Starboard has the right to designate two directors for election to our Board, consisting of one nominee who is affiliated with Starboard and one independent nominee.
The directors designated by Starboard also are entitled to serve on committees of our Board, subject to applicable law and stock exchange rules. Notwithstanding the fact that all directors will be subject to fiduciary duties to us and to applicable law, the interests of the directors designated by Starboard may differ from the interests of our security holders as a whole or of our other directors.
We may not be able to raise the funds necessary to finance a required repurchase of our Series B Preferred Stock.
After November 6, 2026, each holder of Series B Preferred Stock will have the right, upon 90 days’ notice, to require the Company to repurchase all or any portion of the Series B Preferred Stock for cash at a price equal to $1,000 per share of Series B Preferred Stock plus all accrued but unpaid dividends. In addition, upon certain change of control events, holders of Series B Preferred Stock can require us, subject to certain exceptions, to repurchase any or all of their Series B Preferred Stock.
It is possible that we would not have sufficient funds to make any required repurchase of Series B Preferred Stock. Moreover, we may not be able to arrange financing, to pay the repurchase price.
We plan to invest proceeds from the sale of Series B Preferred Stock to advance our strategic priorities, and failure to realize the anticipated benefits of these investments could adversely impact our business and financial results.
We plan to use approximately half of the proceeds of Starboard’s investment to reduce the outstanding principal amount under our revolving credit facility. The remaining proceeds, combined with the additional borrowing availability under the revolving credit facility as a result of the debt repayment, is expected to provide financial flexibility that enables us to make investments in our business, including investments in our brand, products, technology, human capital and unit
19
economics. However, we may not be able to implement and realize the anticipated benefits from these investments. Events and circumstances, such as financial or unforeseen difficulties, delays and unexpected costs may occur that could result in our not realizing desired outcomes. Any failure to implement the proceeds from the investment in accordance with our expectations could adversely affect our financial results.
Changes in privacy laws could adversely affect our ability to market our products effectively.
We rely on a variety of direct marketing techniques, including email, text messages and postal mailings. Any future restrictions in federal, state or foreign laws regarding marketing and solicitation or domestic or international data protection laws that govern these activities could adversely affect the continuing effectiveness of email, text messages and postal mailing techniques and could force changes in our marketing strategies. If this occurs, we may need to develop alternative marketing strategies, which may not be as effective and could impact the amount and timing of our revenues.
We may not be able to execute our strategy or achieve our planned growth targets, which could negatively impact our business and our financial results.
Our growth strategy depends on our and our franchisees’ ability to open new restaurants and to operate them on a profitable basis. We expect substantially all of our international unit growth and much of our domestic unit growth to be franchised units. Accordingly, our profitability increasingly depends upon royalty revenues from franchisees. If our franchisees are not able to operate their businesses successfully under our franchised business model, our results could suffer. Additionally, we may fail to attract new qualified franchisees or existing franchisees may close underperforming locations. Planned growth targets and the ability to operate new and existing restaurants profitably are affected by economic, regulatory and competitive conditions and consumer buying habits. A decrease in sales, such as what we experienced in 2018, or increased commodity or operating costs, including, but not limited to, employee compensation and benefits or insurance costs, could slow the rate of new store openings or increase the number of store closings. Our business is susceptible to adverse changes in local, national and global economic conditions, which could make it difficult for us to meet our growth targets. Additionally, we or our franchisees may face challenges securing financing, finding suitable store locations at acceptable terms or securing required domestic or foreign government permits and approvals. Declines in comparable sales, net store openings and related operating profits significantly impacted our stock price in 2018. If we do not improve future sales and operating results and meet our related growth targets or external expectations for net restaurant openings or our other strategic objectives in the future, our stock price could continue to decline.
Our franchisees remain dependent on the availability of financing to remodel or renovate existing locations, upgrade systems and enhance technology, or construct and open new restaurants. From time to time, the Company may provide financing to certain franchisees and prospective franchisees in order to mitigate store closings, allow new units to open, or complete required upgrades. If we are unable or unwilling to provide such financing, which is a function of, among other things, a franchisee’s creditworthiness, the number of new restaurant openings may be slower or the rate of closures may be higher than expected and our results of operations may be adversely impacted. To the extent we provide financing to franchisees, our results could be negatively impacted by negative performance of these franchisee loans.
We may be adversely impacted by increases in the cost of food ingredients and other costs.
We are exposed to fluctuations in commodities. An increase in the cost or sustained high levels of the cost of cheese or other commodities could adversely affect the profitability of our system-wide restaurant operations, particularly if we are unable to increase the selling price of our products to offset increased costs. Cheese, representing our largest food cost, and other commodities can be subject to significant cost fluctuations due to weather, availability, global demand and other factors that are beyond our control. Additionally, increases in labor, mileage, insurance, fuel, and other costs could adversely affect the profitability of our restaurant and QC Center businesses. Most of the factors affecting costs in our system-wide restaurant operations are beyond our control, and we may not be able to adequately mitigate these costs or pass along these costs to our customers or franchisees, given the significant competitive pricing pressures we face.
20
Our dependence on a sole supplier or a limited number of suppliers for some ingredients could result in disruptions to our business.
Domestic restaurants purchase substantially all food and related products from our QC Centers. We are dependent on Leprino Foods Dairy Products Company (“Leprino”) as our sole supplier for cheese, one of our key ingredients. Leprino, one of the major pizza category suppliers of cheese in the United States, currently supplies all of our cheese domestically and substantially all of our cheese internationally. We also depend on a sole source for our supply of certain desserts, which constitutes less than 10% of our domestic Company-owned restaurant sales. While we have no other sole sources of supply for key ingredients or menu items, we do source other key ingredients from a limited number of suppliers. Alternative sources of cheese, desserts, other key ingredients or menu items may not be available on a timely basis or may not be available on terms as favorable to us as under our current arrangements.
Our Company-owned and franchised restaurants could also be harmed by a prolonged disruption in the supply of products from or to our QC Centers due to weather, climate change, natural disasters, crop disease, food safety incidents, regulatory compliance, labor dispute or interruption of service by carriers. In particular, adverse weather or crop disease affecting the California tomato crop could disrupt the supply of pizza sauce to our and our franchisees’ restaurants. Insolvency of key suppliers could also cause similar business interruptions and negatively impact our business.
Natural disasters, hostilities, social unrest and other catastrophic events may disrupt our operations or supply chain.
The occurrence of a natural disaster, hostilities, epidemic, cyber-attack, social unrest, terrorist activity or other catastrophic events may result in the closure of our restaurants (Company-owned or franchised), our corporate office, any of our QC Centers or the facilities of our suppliers, and can adversely affect consumer spending, consumer confidence levels and supply availability and costs, any of which could materially adversely affect our results of operations.
Changes in purchasing practices by our domestic franchisees could harm our commissary business.
Although our domestic franchisees currently purchase substantially all food products from our QC Centers, the only required QC Center purchases by franchisees are pizza sauce, dough and other items we may designate as proprietary or integral to our system. Any changes in purchasing practices by domestic franchisees, such as seeking alternative approved suppliers of ingredients or other food products, could adversely affect the financial results of our QC Centers and the Company.
Our current insurance may not be adequate and we may experience claims in excess of our reserves.
Our insurance programs for workers’ compensation, owned and non-owned vehicles, general liability, property and team member health insurance coverage are funded by the Company up to certain retention levels, generally ranging from $100,000 to $1 million. These insurance programs may not be adequate to protect us, and it may be difficult or impossible to obtain additional coverage or maintain current coverage at a reasonable cost. We also have experienced increasing claims volatility and higher related costs for workers’ compensation, owned and non-owned vehicles and health claims. We estimate loss reserves based on historical trends, actuarial assumptions and other data available to us, but we may not be able to accurately estimate reserves. If we experience claims in excess of our projections, our business could be negatively impacted. Our franchisees could be similarly impacted by higher claims experience, hurting both their operating results and/or limiting their ability to maintain adequate insurance coverage at a reasonable cost.
Our international operations are subject to increased risks and other factors that may make it more difficult to achieve or maintain profitability or meet planned growth rates.
Our international operations could be negatively impacted by volatility and instability in international economic, political, security or health conditions in the countries in which the Company or our franchisees operate, especially in emerging markets. In addition, there are risks associated with differing business and social cultures and consumer preferences. We may face limited availability for restaurant locations, higher location costs and difficulties in franchisee selection and financing. We may be subject to difficulties in sourcing and importing high-quality ingredients (and ensuring food safety) in a cost-effective manner, hiring and retaining qualified team members, marketing effectively and adequately investing in information technology, especially in emerging markets.
21
Our international operations are also subject to additional risk factors, including import and export controls, compliance with anti-corruption and other foreign laws, difficulties enforcing intellectual property and contract rights in foreign jurisdictions, and the imposition of increased or new tariffs or trade barriers. We intend to continue to expand internationally, which would make the risks related to our international operations more significant over time.
Our international results, which are now completely franchised, depend heavily on the operating capabilities and financial strength of our franchisees. Any changes in the ability of our franchisees to run their stores profitably in accordance with our operating procedures, or to effectively sub franchise stores, could result in brand damage, a higher number of restaurant closures and a reduction in the number of new restaurant openings.
Sales made by our franchisees in international markets and certain loans we provide to such franchisees are denominated in their local currencies, and fluctuations in the U.S. dollar occur relative to the local currencies. Accordingly, changes in currency exchange rates will cause our revenues, investment income and operating results to fluctuate. We have not historically hedged our exposure to foreign currency fluctuations. Our international revenues and earnings may be adversely impacted as the U.S. dollar rises against foreign currencies because the local currency will translate into fewer U.S. dollars. Additionally, the value of certain assets or loans denominated in local currencies may deteriorate. Other items denominated in U.S. dollars including product imports or loans may also become more expensive, putting pressure on franchisees’ cash flows.
We are subject to risks associated with the withdrawal of the United Kingdom from the European Union (“Brexit”). In March 2017, the United Kingdom formally notified the European Union of its intention to withdraw, and withdrawal negotiations began in June 2017. European Union rules provide for a two-year negotiation period, ending on March 29, 2019, unless an extension is agreed to by the parties. There remains significant uncertainty about the future relationship between the United Kingdom and the European Union, including the possibility of the United Kingdom leaving the European Union without a negotiated and bilaterally approved withdrawal plan. We have significant operations in both the United Kingdom and the European Union. We depend on the free flow of labor and goods in those regions. The ongoing uncertainty and potential of border controls and customs duties on trade between the United Kingdom and European Union nations could negatively impact our business. The impact of Brexit will depend on the terms of any agreement the United Kingdom and the European Union reach to provide access to markets. As of December 30, 2018, 30.1% of our total international restaurants are in countries within the European Union.
We are subject to debt covenant restrictions.
Our credit agreement, as amended in October 2018, contains affirmative and negative covenants, including financial covenants. If a covenant violation occurs or is expected to occur, we would be required to seek a waiver or amendment from the lenders under the credit agreement. The failure to obtain a waiver or amendment on a timely basis would result in our inability to borrow additional funds or obtain letters of credit under our credit agreement and allow the lenders under our credit agreement to declare our loan obligations due and payable, require us to cash collateralize outstanding letters of credit or increase our interest rate. If any of the foregoing events occur, we would need to refinance our debt, or renegotiate or restructure, the terms of the credit agreement.
With our indebtedness, we may have reduced availability of cash flow for other purposes. Increases in interest rates would also increase our debt service costs and could materially impact our profitability as well as the profitability of our franchisees.
Current debt levels under our existing credit facility may reduce available cash flow to plan for or react to business changes, changes in the industry or any general adverse economic conditions. Under our credit facility, we are exposed to variable interest rates. We have entered into interest rate swaps that fix a significant portion of our variable interest rate risk. However, by using a derivative instrument to hedge exposures to changes in interest rates, we also expose ourselves to credit risk. Credit risk is due to the possible failure of the counterparty to perform under the terms of the derivative contract.
Higher inflation, and a related increase in costs, including rising interest rates, could also impact our franchisees and their ability to open new restaurants or operate existing restaurants profitably.
22
Increasingly complex laws and regulations could adversely affect our business.
We operate in an increasingly complex regulatory environment, and the cost of regulatory compliance is increasing. Our failure, or the failure of any of our franchisees, to comply with applicable U.S. and international labor, health care, food, health and safety, consumer protection, anti-bribery and corruption, competition, environmental and other laws may result in civil and criminal liability, damages, fines and penalties. Enforcement of existing laws and regulations, changes in legal requirements, and/or evolving interpretations of existing regulatory requirements may result in increased compliance costs and create other obligations, financial or otherwise, that could adversely affect our business, financial condition or operating results. Increased regulatory scrutiny of food matters and product marketing claims, and increased litigation and enforcement actions may increase compliance and legal costs and create other obligations that could adversely affect our business, financial condition or operating results. Governments may also impose requirements and restrictions that impact our business. For example, some local government agencies have implemented ordinances that restrict the sale of certain food or drink products.
Compliance with new or additional domestic and international government laws or regulations, including the European Union General Data Protection Regulation (“GDPR”), which became effective in May 2018 could increase costs for compliance. These laws and regulations are increasing in complexity and number, change frequently and increasingly conflict among the various countries in which we operate, which has resulted in greater compliance risk and costs. If we fail to comply with these laws or regulations, we could be subject to reputational damage and significant litigation, monetary damages, regulatory enforcement actions or fines in various jurisdictions. For example, a failure to comply with the GDPR could result in fines up to the greater of €20 million or 4% of annual global revenues.
Higher labor costs and increased competition for qualified team members increase the cost of doing business and ensuring adequate staffing in our restaurants. Additionally, changes in employment and labor laws, including health care legislation and minimum wage increases, could increase costs for our system-wide operations.
Our success depends in part on our and our franchisees’ ability to recruit, motivate and retain a qualified workforce to work in our restaurants in an intensely competitive environment. Increased costs associated with recruiting, motivating and retaining qualified employees to work in Company-owned and franchised restaurants have had a negative impact on our Company-owned restaurant margins and the margins of franchised restaurants. Competition for qualified drivers also continues to increase as more companies compete for drivers or enter the delivery space, including third party aggregators. Additionally, economic actions, such as boycotts, protests, work stoppages or campaigns by labor organizations, could adversely affect us (including our ability to recruit and retain talent) or our franchisees and suppliers whose performance may have a material impact on our results. Social media may be used to foster negative perceptions of employment with our Company in particular or in our industry generally, and to promote strikes or boycotts.
We are also subject to federal, state and foreign laws governing such matters as minimum wage requirements, overtime compensation, benefits, working conditions, citizenship requirements and discrimination and family and medical leave. Labor costs and labor-related benefits are primary components in the cost of operation of our restaurants and QC Centers. Labor shortages, increased employee turnover and health care mandates could increase our system-wide labor costs.
A significant number of hourly personnel are paid at rates close to the federal and state minimum wage requirements. Accordingly, the enactment of additional state or local minimum wage increases above federal wage rates or regulations related to exempt employees has increased and could continue to increase labor costs for our domestic system-wide operations.
The Affordable Care Act, enacted in 2010, requires employers such as us to provide health insurance for all qualifying employees in the United States or pay penalties for not providing coverage. We, like other industry competitors, are complying with the law and are providing more extensive health benefits to employees than we had previously provided, and are subsidizing a larger portion of their insurance premiums. These additional costs, or costs related to future healthcare regulation, could negatively impact our operational results. In addition, our franchisees subject to the ACA or future healthcare legislation could face additional cost pressures from compliance with the legislation, which could reduce their future expansion of units.
23
We depend on the continued service and availability of key management personnel, and failure to successfully execute succession planning and attract talented team members could harm our Company and brand.
Effective January 1, 2018, the Company appointed Steve Richie to serve as Chief Executive Officer, succeeding Mr. Schnatter in that role. In addition to the Chief Executive Officer succession at the beginning of 2018, we executed a significant management reorganization in the fall of 2018 to drive the future growth of the Company. If the new management team is not successful in executing our strategy, our operating results and prospects for future growth may be adversely impacted. Failure to effectively identify, develop and retain other key personnel, recruit high-quality candidates and ensure smooth management and personnel transitions could also disrupt our business and adversely affect our results.
The concentration of stock ownership with Mr. Schnatter may influence the outcome of certain matters requiring stockholder approval.
The concentration of stock ownership by Mr. Schnatter allows him to substantially influence the outcome of certain matters requiring stockholder approval. Mr. Schnatter’s beneficial ownership is approximately 31% of our outstanding common stock. As a result, he may be able to substantially influence the strategic direction of the Company and the outcome of matters requiring approval by our stockholders, and the interests of Mr. Schnatter may differ from the interests of our stockholders as a whole.
We rely on information technology to operate our businesses and maintain our competitiveness, and any failure to invest in or adapt to technological developments or industry trends could harm our business.
We rely heavily on information systems, including digital ordering solutions, through which over half of our domestic sales originate. We also rely heavily on point-of-sale processing in our Company-owned and franchised restaurants for data collection and payment systems for the collection of cash, credit and debit card transactions, and other processes and procedures. Our ability to efficiently and effectively manage our business depends on the reliability and capacity of these technology systems. In addition, we anticipate that consumers will continue to have more options to place orders digitally, both domestically and internationally. We plan to invest some of the proceeds from Starboard’s investment into enhancing and improving the functionality and features of our information technology systems. However, we cannot ensure that this initiative will be beneficial to the extent, or within the timeframes, expected or that the estimated improvements will be realized as anticipated or at all. Our failure to adequately invest in new technology, adapt to technological developments and industry trends, particularly our digital ordering capabilities, could result in a loss of customers and related market share. Notwithstanding adequate investment in new technology, our marketing and technology initiatives may not be successful in improving our comparable sales results. Additionally, we are in an environment where the technology life cycle is short and consumer technology demands are high, which requires continued reinvestment in technology which will increase the cost of doing business and will increase the risk that our technology may not be customer centric or could become obsolete, inefficient or otherwise incompatible with other systems.
We rely on our international franchisees to maintain their own point-of-sale and online ordering systems, which are often purchased from third-party vendors, potentially exposing international franchisees to more operational risk, including cyber and data privacy risks and governmental regulation compliance risks.
Disruptions of our critical business or information technology systems could harm our ability to compete and conduct our business.
Our critical business and information technology systems could be damaged or interrupted by power loss, various technological failures, user errors, cyber-attacks, sabotage or acts of God. In particular, the Company and our franchisees may experience occasional interruptions of our digital ordering solutions, which make online ordering unavailable or slow to respond, negatively impacting sales and the experience of our customers. If our digital ordering solutions do not perform with adequate speed and security, our customers may be less inclined to return to our digital ordering solutions.
24
Part of our technology infrastructure, such as our domestic FOCUS point-of-sale system, is specifically designed for us and our operational systems, which could cause unexpected costs, delays or inefficiencies when infrastructure upgrades are needed or prolonged and widespread technological difficulties occur. Significant portions of our technology infrastructure, particularly in our digital ordering solutions, are provided by third parties, and the performance of these systems is largely beyond our control. Failure of our third-party systems and backup systems to adequately perform, particularly as our online sales grow, could harm our business and the satisfaction of our customers. Such third-party systems could be disrupted either through system failure or if third party vendor patents and contractual agreements do not afford us protection against similar technology. In addition, we may not have or be able to obtain adequate protection or insurance to mitigate the risks of these events or compensate for losses related to these events, which could damage our business and reputation and be expensive and difficult to remedy or repair.
We rely on third parties for certain business processes and services, and failure or inability of such third-party vendors to perform subjects us to risks, including business disruption and increased costs.
We depend on suppliers and other third parties to operate our business. Some third-party business processes we utilize include information technology, gift card authorization and processing, other payment processing, benefits, and other accounting and business services. We conduct third-party due diligence and seek to obtain contractual assurance that our vendors will maintain adequate controls, such as adequate security against data breaches. However, the failure of our suppliers to maintain adequate controls or comply with our expectations and standards could have a material adverse effect on our business, financial condition, and operating results.
Failure to maintain the integrity of internal or customer data could result in damage to our reputation, loss of sales, and/or subject us to litigation, penalties or significant costs.
We are subject to a number of privacy and data protection laws and regulations. Our business requires the collection and retention of large volumes of internal and customer data, including credit card data and other personally identifiable information of our employees and customers housed in the various information systems we use. Constantly changing information security threats, particularly persistent cyber security threats, pose risks to the security of our systems and networks, and the confidentiality, availability and integrity of our data and the availability and integrity of our critical business functions. As techniques used in cyber-attacks evolve, we may not be able to timely detect threats or anticipate and implement adequate security measures. The integrity and protection of the customer, employee, franchisee and Company data are critical to us. Our information technology systems and databases, and those provided by our third-party vendors, including international vendors, have been and will continue to be subject to computer viruses, malware attacks, unauthorized user attempts, phishing and denial of service and other malicious cyber-attacks. The failure to prevent fraud or security breaches or to adequately invest in data security could harm our business and revenues due to the reputational damage to our brand. Such a breach could also result in litigation, regulatory actions, penalties, and other significant costs to us and have a material adverse effect on our financial results. These costs could be significant and well in excess of our cyber insurance coverage.
We have been and will continue to be subject to various types of investigations and litigation, including collective and class action litigation, which could subject us to significant damages or other remedies.
We are subject to the risk of investigations and litigation from various parties, including vendors, customers, franchisees, state and federal agencies, stockholders and employees. From time to time, we are involved in a number of lawsuits, claims, investigations, and proceedings consisting of securities, intellectual property, employment, consumer, personal injury, corporate governance, commercial and other matters arising in the ordinary course of business.
We have been subject to claims in cases containing collective and class action allegations. Plaintiffs in these types of lawsuits often seek recovery of very large or indeterminate amounts, and the magnitude of the potential loss and defense costs relating to such lawsuits may not be accurately estimated. Litigation trends involving the relationship between franchisors and franchisees, personal injury claims, employment law and intellectual property may increase our cost of doing business. We evaluate all of the claims and proceedings involving us to assess the expected outcome, and where possible, we estimate the amount of potential losses to us. In many cases, particularly collective and class action cases, we may not be able to estimate the amount of potential losses and/or our estimates may prove to be insufficient. These
25
assessments are made by management based on the information available at the time made and require the use of a significant amount of judgment, and actual outcomes or losses may materially differ. Regardless of whether any claims against us are valid, or whether we are ultimately held liable, such litigation may be expensive to defend and may divert resources away from our operations and negatively impact earnings. Further, we may not be able to obtain adequate insurance to protect us from these types of litigation matters or extraordinary business losses.
We may be subject to harassment or discrimination claims and legal proceedings. Although our Code of Ethics and Business Conduct policies prohibit harassment and discrimination in the workplace, in sexual or in any other form, we have ongoing programs for workplace training and compliance, and we investigate and take disciplinary action with respect to alleged violations, actions by our team members could violate those policies. Franchisees and suppliers are also required to comply with all applicable laws and govern themselves with integrity. Any violations (or perceptions thereof) by our franchisees or suppliers could have a negative impact on consumer perceptions of us and our business and create reputational or other harm to the Company.
We may not be able to adequately protect our intellectual property rights, which could negatively affect our results of operations.
We depend on the Papa John’s brand name and rely on a combination of trademarks, service marks, copyrights, and similar intellectual property rights to protect and promote our brand. We believe the success of our business depends on our continued ability to exclusively use our existing marks to increase brand awareness and further develop our brand, both domestically and abroad. We may not be able to adequately protect our intellectual property rights, and we may be required to pursue litigation to prevent consumer confusion and preserve our brand’s high-quality reputation. Litigation could result in high costs and diversion of resources, which could negatively affect our results of operations, regardless of the outcome.
We may be subject to impairment charges.
Impairment charges are possible due to the nature and timing of decisions we make about underperforming assets or markets, or if previously opened or acquired restaurants perform below our expectations. This could result in a decrease in our reported asset value and reduction in our net income.
We operate globally and changes in tax laws could adversely affect our results.
We operate globally and changes in tax laws could adversely affect our results. We have international operations and generate substantial revenues and profits in foreign jurisdictions. The domestic and international tax environments continue to evolve as a result of tax changes in various jurisdictions in which we operate and changes in the tax laws in certain countries, including the United States, could impact our future net income.
Item 1B. Unresolved Staff Comments
None.
As of December 30, 2018, there were 5,303 Papa John’s restaurants system-wide. The following tables provide the locations of our restaurants. We define “North America” as the United States and Canada and “domestic” as the contiguous United States.
26
North America Restaurants:
|
|
|
Company |
|
Franchised |
|
Total |
|
|
Alabama |
|
3 |
|
78 |
|
81 |
|
|
Alaska |
|
— |
|
11 |
|
11 |
|
|
Arizona |
|
— |
|
75 |
|
75 |
|
|
Arkansas |
|
— |
|
25 |
|
25 |
|
|
California |
|
— |
|
195 |
|
195 |
|
|
Colorado |
|
— |
|
50 |
|
50 |
|
|
Connecticut |
|
— |
|
8 |
|
8 |
|
|
Delaware |
|
— |
|
17 |
|
17 |
|
|
District of Columbia |
|
— |
|
10 |
|
10 |
|
|
Florida |
|
63 |
|
225 |
|
288 |
|
|
Georgia |
|
100 |
|
71 |
|
171 |
|
|
Hawaii |
|
— |
|
14 |
|
14 |
|
|
Idaho |
|
— |
|
13 |
|
13 |
|
|
Illinois |
|
8 |
|
85 |
|
93 |
|
|
Indiana |
|
43 |
|
92 |
|
135 |
|
|
Iowa |
|
— |
|
24 |
|
24 |
|
|
Kansas |
|
16 |
|
18 |
|
34 |
|
|
Kentucky |
|
46 |
|
66 |
|
112 |
|
|
Louisiana |
|
— |
|
59 |
|
59 |
|
|
Maine |
|
— |
|
3 |
|
3 |
|
|
Maryland |
|
59 |
|
41 |
|
100 |
|
|
Massachusetts |
|
— |
|
12 |
|
12 |
|
|
Michigan |
|
— |
|
43 |
|
43 |
|
|
Minnesota |
|
— |
|
40 |
|
40 |
|
|
Mississippi |
|
— |
|
28 |
|
28 |
|
|
Missouri |
|
42 |
|
31 |
|
73 |
|
|
Montana |
|
— |
|
9 |
|
9 |
|
|
Nebraska |
|
— |
|
14 |
|
14 |
|
|
Nevada |
|
— |
|
24 |
|
24 |
|
|
New Hampshire |
|
— |
|
3 |
|
3 |
|
|
New Jersey |
|
— |
|
52 |
|
52 |
|
|
New Mexico |
|
— |
|
16 |
|
16 |
|
|
New York |
|
— |
|
81 |
|
81 |
|
|
North Carolina |
|
102 |
|
78 |
|
180 |
|
|
North Dakota |
|
— |
|
9 |
|
9 |
|
|
Ohio |
|
— |
|
162 |
|
162 |
|
|
Oklahoma |
|
— |
|
40 |
|
40 |
|
|
Oregon |
|
— |
|
16 |
|
16 |
|
|
Pennsylvania |
|
— |
|
85 |
|
85 |
|
|
Rhode Island |
|
— |
|
4 |
|
4 |
|
|
South Carolina |
|
9 |
|
68 |
|
77 |
|
|
South Dakota |
|
— |
|
13 |
|
13 |
|
|
Tennessee |
|
33 |
|
79 |
|
112 |
|
|
Texas |
|
95 |
|
209 |
|
304 |
|
|
Utah |
|
— |
|
30 |
|
30 |
|
|
Vermont |
|
— |
|
1 |
|
1 |
|
|
Virginia |
|
26 |
|
119 |
|
145 |
|
|
Washington |
|
— |
|
48 |
|
48 |
|
|
West Virginia |
|
— |
|
22 |
|
22 |
|
|
Wisconsin |
|
— |
|
28 |
|
28 |
|
|
Wyoming |
|
— |
|
10 |
|
10 |
|
|
Total U.S. Papa John’s Restaurants |
|
645 |
|
2,554 |
|
3,199 |
|
|
Canada |
|
— |
|
138 |
|
138 |
|
|
Total North America Papa John’s Restaurants |
|
645 |
|
2,692 |
|
3,337 |
|
27
International Restaurants:
|
|
|
Franchised |
|
|
Azerbaijan |
|
6 |
|
|
Bahamas |
|
2 |
|
|
Bahrain |
|
20 |
|
|
Belarus |
|
15 |
|
|
Bolivia |
|
5 |
|
|
Cayman Islands |
|
2 |
|
|
Chile |
|
87 |
|
|
China |
|
209 |
|
|
Colombia |
|
46 |
|
|
Costa Rica |
|
24 |
|
|
Cyprus |
|
8 |
|
|
Dominican Republic |
|
18 |
|
|
Ecuador |
|
17 |
|
|
Egypt |
|
49 |
|
|
El Salvador |
|
25 |
|
|
France |
|
3 |
|
|
Guam |
|
3 |
|
|
Guatemala |
|
13 |
|
|
Iraq |
|
1 |
|
|
Ireland |
|
78 |
|
|
Israel |
|
4 |
|
|
Kazakhstan |
|
3 |
|
|
Korea |
|
149 |
|
|
Kuwait |
|
41 |
|
|
Kyrgyzstan |
|
3 |
|
|
Mexico |
|
101 |
|
|
Morocco |
|
6 |
|
|
Netherlands |
|
18 |
|
|
Nicaragua |
|
4 |
|
|
Oman |
|
9 |
|
|
Panama |
|
12 |
|
|
Peru |
|
41 |
|
|
Philippines |
|
18 |
|
|
Poland |
|
6 |
|
|
Puerto Rico |
|
27 |
|
|
Qatar |
|
21 |
|
|
Russia |
|
199 |
|
|
Saudi Arabia |
|
27 |
|
|
Spain |
|
72 |
|
|
Trinidad |
|
7 |
|
|
Tunisia |
|
6 |
|
|
Turkey |
|
62 |
|
|
United Arab Emirates |
|
45 |
|
|
United Kingdom |
|
415 |
|
|
Venezuela |
|
39 |
|
|
Total International Papa John’s Restaurants |
|
1,966 |
|
Note: Company-owned Papa John’s restaurants include restaurants owned by majority-owned subsidiaries. There were 183 such restaurants at December 30, 2018 (59 in Maryland, 95 in Texas, 26 in Virginia, and 3 in Georgia).
Most Papa John’s Company-owned restaurants are located in leased space. The initial term of most domestic restaurant leases is generally five years with most leases providing for one or more options to renew for at least one additional term.
28
Generally, the leases are triple net leases, which require us to pay all or a portion of the cost of insurance, taxes and utilities. As a result of assigning our interest in obligations under property leases as a condition of the refranchising of certain restaurants, we are also contingently liable for payment of approximately 124 domestic leases.
Nine of our 12 North America QC Centers are located in leased space. Our remaining three locations are in buildings we own. Additionally, our corporate headquarters and our printing operations located in Louisville, KY are in buildings owned by us.
At December 30, 2018, we leased and subleased 344 Papa John’s restaurant sites to franchisees in the United Kingdom. The initial lease terms on the franchised sites in the United Kingdom are generally 10 to 15 years. The initial lease terms of the franchisee subleases are generally five to ten years. We own a full-service QC Center in the United Kingdom.
The Company is involved in a number of lawsuits, claims, investigations and proceedings, consisting of intellectual property, employment, consumer, commercial and other matters arising in the ordinary course of business. In accordance with Financial Accounting Standards Board (“FASB”) Accounting Standards Codification (“ASC”) 450, “Contingencies,” the Company has made accruals with respect to these matters, where appropriate, which are reflected in the Company’s Consolidated Financial Statements. We review these provisions at least quarterly and adjust these provisions to reflect the impact of negotiations, settlements, rulings, advice of legal counsel and other information and events pertaining to a particular case. We also are involved in litigation with our founder, John H. Schnatter, and are a defendant in a securities class action lawsuit. See “Note 19” of “Notes to Consolidated Financial Statements” for additional information.
Item 4. Mine Safety Disclosures
None.
29
EXECUTIVE OFFICERS OF THE REGISTRANT
Set forth below are the current executive officers of Papa John’s:
|
Name |
|
Age (a) |
|
Position |
|
First Elected |
|
Years of |
|
|
|
|
|
|
|
|
|
|
|
Steve M. Ritchie |
44 |
President and Chief Executive Officer |
2012 |
23 |
||||
|
|
|
|
|
|
|
|
|
|
|
Michael R. Nettles |
52 |
Executive Vice President, Chief Operating and Growth Officer |
2018 |
2 |
||||
|
|
|
|
|
|
|
|
|
|
|
Joseph H. Smith |
|
55 |
|
Senior Vice President, Chief Financial Officer |
|
2018 |
|
18 |
|
|
|
|
|
|
|
|
|
|
|
Marvin Boakye |
|
45 |
|
Chief People Officer |
|
2019 |
|
- |
|
|
|
|
|
|
|
|
|
|
|
Caroline Miller Oyler |
|
53 |
|
Senior Vice President, Chief Legal and Risk Officer |
|
2018 |
|
19 |
|
|
|
|
|
|
|
|
|
|
|
Jack H. Swaysland |
|
54 |
|
Senior Vice President, Chief Operating Officer – International |
|
2018 |
|
12 |
|
(a) |
Ages are as of January 1, 2019. |
Steve M. Ritchie was appointed President and Chief Executive Officer effective January 1, 2018 and was appointed to serve on the Board of Directors effective February 4, 2019. He served as President and Chief Operating Officer from July 2015 to December 31, 2017, after serving as Senior Vice President and Chief Operating Officer since May 2014. Mr. Ritchie served as a Senior Vice President since December 2010 and in various capacities of increasing responsibility over Global Operations & Global Operations Support and Training since July 2010. Since 2006, he also has served as a franchise owner and operator of multiple units in the Company’s Midwest Division.
Michael R. Nettles was appointed Executive Vice President, Chief Operating and Growth Officer in October 2018 after serving as Senior Vice President, Chief Information and Digital officer since February 2017. Prior to February 2017, Mr. Nettles served for four years with Panera Bread serving as Vice President, Architecture and Information Technology Strategy. Prior to Panera, Mr. Nettles served as Vice President of Tag Solutions for Goji Food Solutions from April 2011 until July of 2012 and concurrently as Founder and President of Red Chair Ventures, a foodservice technology solutions provider from January 2009 until July of 2012.
Joseph H. Smith was appointed to Senior Vice President, Chief Financial Officer in April 2018 after serving as the Company’s Senior Vice President, Global Sales and Development from 2016 to April 2018 and as Vice President, Global Sales and Development from 2010 to 2016. Mr. Smith served as Vice President of Corporate Finance from 2005 to 2010 and as Senior Director of Corporate Budgeting and Finance from 2000 to 2005. Prior to joining Papa John's, Mr. Smith served as Corporate Controller for United Catalysts, Inc. from 1998 to 2000. Mr. Smith began his career in public accounting in 1985 at Ernst & Young. Mr. Smith is a licensed Certified Public Accountant.
Marvin Boakye was appointed Chief People Officer in January 2019. He joined Papa John’s after serving as the Vice President Human Resources for Andeavor (which was acquired by Marathon Petroleum) from March 2017. From June 2015 to March 2017, Mr. Boakye served as Chief Human Resources Officer for MTS Allstream Inc., a Canadian telecommunications company. From January 2010 to June 2015, he worked for The Goodyear Tire & Rubber Company as Director Human Resources Latin America.
Caroline Miller Oyler was appointed Senior Vice President, Chief Legal and Risk Officer in October 2018. Ms. Oyler previously served as Senior Vice President, Chief Legal Officer from May 2018 to October 2018 and Senior Vice President, General Counsel from May 2014 to May 2018. Additionally, Ms. Oyler served as Senior Vice President, Legal Affairs from November 2012 to May 2014 and as Vice President and Senior Counsel since joining the Company’s legal
30
department in 1999. She also served as interim head of Human Resources from December 2008 to September 2009. Prior to joining Papa John’s, Ms. Oyler practiced law with the firm Wyatt, Tarrant and Combs LLP.
Jack H. Swaysland was appointed to Chief Operating Officer – International in May 2018 after serving as Senior Vice President, International since April 2016. Mr. Swaysland previously served as Vice President, International from April 2015 to April 2016, Regional Vice President, International from May 2013 to April 2015, and Vice President, International Operations from April 2010 to May 2013. Mr. Swaysland has served in various capacities of increasing responsibility in International Operations since joining the Company 12 years ago.
There are no family relationships between any of the directors or executive officers of the Company.
Item 5. Market for Registrant’s Common Equity, Related Stockholder Matters and Issuer Purchases of Equity Securities
Our common stock trades on The NASDAQ Global Select Market tier of The NASDAQ Stock Market under the symbol PZZA. As of March 4, 2019, there were 1,054 record holders of common stock. However, there are significantly more beneficial owners of our common stock than there are record holders.
Our Board of Directors declared a quarterly dividend of $0.225 per share on January 30, 2019, that was payable on February 22, 2019, to shareholders of record at the close of business on February 11, 2019.
We anticipate continuing the payment of quarterly cash dividends. The actual amount of such dividends is subject to declaration by our Board of Directors and will depend upon future earnings, results of operations, capital requirements, our financial condition and other relevant factors. Additionally, in connection with the execution of our amended Credit Facility in October 2018, no increase in dividends per share may occur when the Leverage Ratio, as defined in the Credit Agreement, is higher than 3.75 to 1.0. There can be no assurance that the Company will continue to pay quarterly cash dividends at the current rate or at all.
A total of 115.2 million shares with an aggregate cost of $1.8 billion and an average price of $15.66 per share were repurchased under a share repurchase program that began on December 9, 1999 and expired February 27, 2019. There were no share repurchases in the fourth quarter of 2018. In connection with the execution of our amended Credit Agreement in October 2018, the Company cannot repurchase shares when our Leverage Ratio, as defined in the Credit Agreement, is higher than 3.75 to 1.0. As of December 30, 2018, the Leverage Ratio was 4.7 to 1.0. Please see “Management’s Discussion and Analysis of Financial Condition and Results of Operations” in Part II, Item 7 of this Form 10-K for additional information.
The information required by Item 5 with respect to securities authorized for issuance under equity compensation plans is incorporated herein by reference to Part III, Item 12 of this Form 10-K.
31
Stock Performance Graph
The following performance graph compares the cumulative shareholder return of the Company’s common stock for the five-year period between December 29, 2013 and December 30, 2018 to (i) the NASDAQ Stock Market (U.S.) Index and (ii) a group of the Company’s peers consisting of U.S. companies listed on NASDAQ with standard industry classification (SIC) codes 5800-5899 (eating and drinking places). Management believes the companies included in this peer group appropriately reflect the scope of the Company’s operations and match the competitive market in which the Company operates. The graph assumes the value of the investments in the Company’s common stock and in each index was $100 on December 29, 2013, and that all dividends were reinvested.
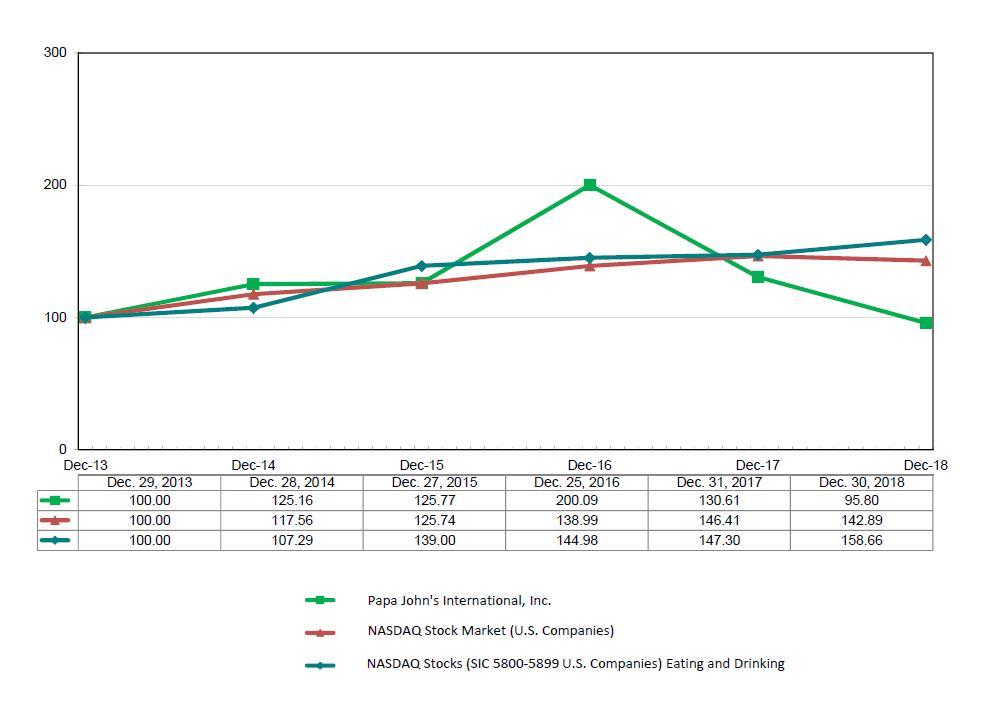
32
Item 6. Selected Financial Data
The selected financial data presented for each of the past five fiscal years were derived from our audited Consolidated Financial Statements. The selected financial data below should be read in conjunction with “Management’s Discussion and Analysis of Financial Condition and Results of Operations” and the “Consolidated Financial Statements” and Notes thereto included in Item 7 and Item 8, respectively, of this Form 10-K. The Company has reclassified certain prior year amounts within the Consolidated Statements of Operations for the years ended December 31, 2017 and December 25, 2016 in order to conform with current year presentation. See “Note 24” of “Notes to Consolidated Financial Statements” for additional information.
|
|
|
|
|||||||||||||
|
|
|
Year Ended(1) |
|||||||||||||
|
|
|
Dec. 30, |
|
Dec. 31, |
|
Dec. 25, |
|
Dec. 30, |
|
Dec. 25, |
|||||
|
(In thousands, except per share data) |
|
2018 |
|
2017 |
|
2016 |
|
2015 |
|
2014 |
|||||
|
|
|
|
52 weeks |
|
|
53 weeks |
|
|
52 weeks |
|
|
52 weeks |
|
|
52 weeks |
|
Income Statement Data |
|
|
|
|
|
|
|
|
|
|
|
|
|
|
|
|
Revenues: |
|
|
|
|
|
|
|
|
|
|
|
|
|
|
|
|
Domestic Company-owned restaurant sales |
|
$ |
692,380 |
|
$ |
816,718 |
|
$ |
815,931 |
|
$ |
756,307 |
|
$ |
701,854 |
|
North America franchise royalties and fees (2) |
|
|
79,293 |
|
|
106,729 |
|
|
102,980 |
|
|
96,056 |
|
|
90,169 |
|
North America commissary |
|
|
609,866 |
|
|
673,712 |
|
|
623,883 |
|
|
680,321 |
|
|
703,671 |
|
International (3) |
|
|
110,349 |
|
|
114,021 |
|
|
100,904 |
|
|
104,691 |
|
|
102,455 |
|
Other revenues |
|
|
81,428 |
|
|
72,179 |
|
|
69,922 |
|
|
— |
|
|
— |
|
Total revenues (4) |
|
|
1,573,316 |
|
|
1,783,359 |
|
|
1,713,620 |
|
|
1,637,375 |
|
|
1,598,149 |
|
|
|
|
|
|
|
|
|
|
|
|
|
|
|
|
|
|
Refranchising and impairment gains/(losses), net |
|
|
(289) |
|
|
(1,674) |
|
|
10,222 |
|
|
— |
|
|
(979) |
|
Operating income |
|
|
30,380 |
|
|
151,017 |
|
|
164,523 |
|
|
136,307 |
|
|
117,630 |
|
Legal settlement |
|
|
— |
|
|
— |
|
|
898 |
|
|
(12,278) |
|
|
— |
|
Investment income |
|
|
817 |
|
|
608 |
|
|
785 |
|
|
794 |
|
|
702 |
|
Interest expense |
|
|
(25,306) |
|
|
(11,283) |
|
|
(7,397) |
|
|
(5,676) |
|
|
(4,077) |
|
Income before income taxes |
|
|
5,891 |
|
|
140,342 |
|
|
158,809 |
|
|
119,147 |
|
|
114,255 |
|
Income tax expense |
|
|
2,646 |
|
|
33,817 |
|
|
49,717 |
|
|
37,183 |
|
|
36,558 |
|
Net income before attribution to noncontrolling interests |
|
|
3,245 |
|
|
106,525 |
|
|
109,092 |
|
|
81,964 |
|
|
77,697 |
|
Income attributable to noncontrolling interests (5) |
|
|
(1,599) |
|
|
(4,233) |
|
|
(6,272) |
|
|
(6,282) |
|
|
(4,382) |
|
Net income attributable to the Company |
|
$ |
1,646 |
|
$ |
102,292 |
|
$ |
102,820 |
|
$ |
75,682 |
|
$ |
73,315 |
|
|
|
|
|
|
|
|
|
|
|
|
|
|
|
|
|
|
Net income attributable to common shareholders |
|
$ |
1,646 |
|
$ |
103,288 |
|
$ |
102,967 |
|
$ |
75,422 |
|
$ |
72,869 |
|
Basic earnings per common share |
|
$ |
0.05 |
|
$ |
2.86 |
|
$ |
2.76 |
|
$ |
1.91 |
|
$ |
1.78 |
|
Diluted earnings per common share |
|
$ |
0.05 |
|
$ |
2.83 |
|
$ |
2.74 |
|
$ |
1.89 |
|
$ |
1.75 |
|
Basic weighted average common shares outstanding |
|
|
32,083 |
|
|
36,083 |
|
|
37,253 |
|
|
39,458 |
|
|
40,960 |
|
Diluted weighted average common shares outstanding |
|
|
32,299 |
|
|
36,522 |
|
|
37,608 |
|
|
40,000 |
|
|
41,718 |
|
Dividends declared per common share |
|
$ |
0.90 |
|
$ |
0.85 |
|
$ |
0.75 |
|
$ |
0.63 |
|
$ |
0.53 |
|
|
|
|
|
|
|
|
|
|
|
|
|
|
|
|
|
|
Balance Sheet Data |
|
|
|
|
|
|
|
|
|
|
|
|
|
|
|
|
Total assets |
|
$ |
570,947 |
|
$ |
555,553 |
|
$ |
512,565 |
|
$ |
494,058 |
|
$ |
504,555 |
|
Total debt |
|
|
625,000 |
|
|
470,000 |
|
|
300,575 |
|
|
256,000 |
|
|
230,451 |
|
Redeemable noncontrolling interests |
|
|
5,464 |
|
|
6,738 |
|
|
8,461 |
|
|
8,363 |
|
|
8,555 |
|
Total stockholders’ equity (deficit) |
|
|
(302,134) |
|
|
(105,954) |
|
|
9,801 |
|
|
42,206 |
|
|
98,715 |
33
|
(1) |
We operate on a 52-53 week fiscal year ending on the last Sunday of December of each year. The 2017 fiscal year consisted of 53 weeks and all other years above consisted of 52 weeks. The additional week resulted in additional revenues of approximately $30.9 million and additional income before income taxes of approximately $5.9 million, or $0.11 per diluted share for 2017. |
|
(2) |
North America franchise royalties were derived from franchised restaurant sales of $2.13 billion in 2018, $2.30 billion in 2017 ($2.25 billion on a 52-week basis), $2.20 billion in 2016, $2.13 billion in 2015 and $2.04 billion in 2014. |
|
(3) |
Includes international royalties and fees, restaurant sales for international Company-owned restaurants, and international commissary revenues. International royalties were derived from franchised restaurant sales of $832.3 million in 2018, $761.3 million in 2017 ($744.0 million on a 52-week basis), $648.9 million in 2016, $592.7 million in 2015 and $553.0 million in 2014. Restaurant sales for international Company-owned restaurants were $6.2 million in 2018, $13.7 million in 2017 ($13.4 million on a 52-week basis), $14.5 million in 2016, $19.3 million in 2015 and $23.7 million in 2014. |
|
(4) |
The Company adopted Accounting Standards Update (“ASU”) 2014-09, “Revenue from Contracts with Customers” in 2018. See “Notes 2, 3 and 4” of “Notes to Consolidated Financial Statements” for additional information. |
|
(5) |
Represents the noncontrolling interests’ allocation of income for our joint venture arrangements. |
34
Item 7. Management’s Discussion and Analysis of Financial Condition and Results of Operations
Introduction
Papa John’s International, Inc. (referred to as the “Company,” “Papa John’s” or in the first person notations of “we,” “us” and “our”) began operations in 1984. At December 30, 2018, there were 5,303 Papa John’s restaurants in operation, consisting of 645 Company-owned and 4,658 franchised restaurants. Our revenues are derived from retail sales of pizza and other food and beverage products to the general public by Company-owned restaurants, franchise royalties, and sales of franchise and development rights. Additionally, approximately 42% to 46% of our North America revenues in each of the last three fiscal years were derived from sales to franchisees of various items including food and paper products, printing and promotional items and information systems equipment, and software and related services. We also derive revenues from the operation of three international QC centers. We believe that in addition to supporting both Company and franchised profitability and growth, these activities contribute to product quality and consistency throughout the Papa John’s system.
We strive to obtain high-quality restaurant sites with good access and visibility and to enhance the appearance and quality of our restaurants. We believe these factors improve our image and brand awareness. Our expansion strategy is to cluster restaurants in targeted markets, thereby increasing consumer awareness and enabling us to take advantage of operational, distribution and advertising efficiencies.
Detailed below is a progression of new unit growth for our Domestic and International restaurants:
|
|
Domestic Company-owned |
Franchised North America |
Total North America |
International |
System-wide |
|
|
|
|
|
|
|
|
Beginning - December 31, 2017 |
708 |
2,733 |
3,441 |
1,758 |
5,199 |
|
Opened |
6 |
83 |
89 |
304 |
393 |
|
Closed |
(7) |
(186) |
(193) |
(96) |
(289) |
|
Acquired |
- |
62 |
62 |
34 |
96 |
|
Sold |
(62) |
- |
(62) |
(34) |
(96) |
|
Ending - December 30, 2018 |
645 |
2,692 |
3,337 |
1,966 |
5,303 |
|
Net unit growth - 2018 |
(63) |
(41) |
(104) |
208 |
104 |
The average cash investment for the six domestic traditional Company-owned restaurants opened during 2018 was approximately $345,000, exclusive of land and any tenant improvement allowances we received, compared to $354,000 average investment for the 7 domestic traditional units opened in 2017. In recent years, we have experienced an increase in the cost of our new restaurants primarily as a result of building larger units, an increase in the cost of certain equipment as a result of technology enhancements, and increased costs to comply with local regulations.
Average annual Company-owned sales for our most recent domestic comparable restaurant base were $1.07 million for 2018, compared to $1.19 million ($1.17 million on a 52-week basis) for 2017 and $1.16 million for 2016. The comparable sales for Company-owned restaurants decreased 9.0% in 2018 and increased 0.4% and 4.4% in 2017 and 2016, respectively. “Comparable sales” represents sales generated by traditional restaurants open for the entire twelve-month period reported. The comparable sales for North America franchised units decreased 6.7% in 2018 and 0.1% in 2017 and increased 3.1% in 2016. The comparable sales for system-wide International units decreased 1.6% in 2018, but increased 4.4% in 2017 and 6.0% in 2016.
35
Strategy
Early in 2018, we outlined five strategic priorities to improve upon the execution of the Company’s strategy, including:
|
· |
People: Focus on making people a priority with advanced career opportunities and more efficient restaurant procedures to support improved recruitment and retention. |
|
· |
Brand differentiation messaging: Develop improved marketing messaging that highlights our quality products and ingredients. |
|
· |
Value perception: Provide everyday accessible value to consumers. |
|
· |
Technological advancements: Promote technological advancements with enhanced data and analytics capabilities. |
|
· |
Restaurant unit economics: Invest further in our restaurants to operate more efficiently while improving the customer experience. |
We believe investments in these areas will provide the enhanced focus and support necessary to achieve our goal to build brand loyalty over the long-term by delivering on our “BETTER INGREDIENTS. BETTER PIZZA.” promise. Despite our recent brand challenges, we believe that we are recognized as a trusted brand and quality leader in the domestic pizza category, and we believe that focusing on these areas will enable us to build our brand on a global basis and increase sales and global units.
Background on Recent Negative Publicity
We have experienced negative publicity and consumer sentiment as a result of statements by the Company’s founder and former spokesperson John H. Schnatter in late 2017 and in July 2018, which contributed to our negative sales results in 2018. Mr. Schnatter resigned as Chairman of the Board on July 11, 2018, the same day that the media reported certain controversial statements made by Mr. Schnatter. A Special Committee of the Board of Directors consisting of all of the independent directors (the “Special Committee”) was formed on July 15, 2018 to evaluate and take action with respect to all of the Company’s relationships and arrangements with Mr. Schnatter. In addition, on July 27, 2018, the Company announced that the Board’s Lead Independent Director, Olivia F. Kirtley, had been unanimously appointed by the Board of Directors to serve as Chairman of the Company’s Board of Directors. Following its formation, the Special Committee terminated Mr. Schnatter’s Founder Agreement, which defined his role in the Company, among other things, as advertising and brand spokesperson for the Company. The Special Committee, among other things, oversaw the previously announced external audit and investigation of all the Company’s existing processes, policies and systems related to diversity and inclusion, supplier and vendor engagement and Papa John’s culture, which is substantially complete. The Special Committee has delivered recommendations resulting from the audit to Company management, who will implement the recommendations, including initiatives and training regarding Diversity, Equity, and Inclusion. The Company is also implementing various branding and marketing initiatives, including a new advertising and marketing campaign.
The negative consumer sentiment surrounding the Company’s brand has continued to impact the North America system-wide sales and the Company cannot predict how long the negative consumer sentiment will continue. The Company also incurred significant costs (defined as “Special charges”) as a result of the above-mentioned recent events in the second half of 2018. We incurred $50.7 million of Special charges as follows:
|
· |
franchise royalty reductions of approximately $15.4 million for all North America franchisees, |
|
· |
reimaging costs at nearly all domestic restaurants and replacement or write off of certain branded assets totaling $5.8 million, |
|
· |
contribution of $10.0 million to the Papa John’s National Marketing Fund (“PJMF”), and |
|
· |
legal and professional fees, which amounted to $19.5 million, for various matters relating to the review of a wide range of strategic opportunities for the Company that culminated in the recent strategic investment in the Company by affiliates of Starboard Value LP, as well as a previously announced external culture audit and other activities overseen by the Special Committee. |
36
The franchise royalty reductions reduce the amount of North America franchise royalties and fees revenues within our Consolidated Statements of Operations. All other costs associated with these events are included in General and administrative expenses within the Consolidated Statements of Operations.
The Company could continue to experience a decline in sales resulting from the aforementioned negative consumer sentiment and incur additional charges in 2019 as a result of the recent events. The Company estimates that these costs will amount to between $30 million and $50 million for 2019.
In September 2018, the Company began a process to evaluate a wide range of strategic options with the goal of improving sales, maximizing value for all shareholders and serving the best interest of the Company’s stakeholders. As part of this strategic review, the Special Committee also engaged legal and financial advisors. After extensive discussions with a wide group of strategic and financial investors, the Special Committee concluded that an investment agreement with funds affiliated with Starboard Value LP (together with its affiliates, “Starboard”) was in the best interest of shareholders. On February 3, 2019, the Company entered into a Securities Purchase Agreement (the “Securities Purchase Agreement”) with Starboard pursuant to which Starboard made a $200 million strategic investment in the Company’s newly designated Series B convertible preferred stock, par value $0.01 per share (the “Series B Preferred Stock”) with the option to make an additional $50 million investment in the Series B Preferred Stock through March 29, 2019. In addition, the Company has the right to offer up to 10,000 shares of Series B Preferred Stock to Papa John’s franchisees, on the same terms as to Starboard, provided such franchisees satisfy accredited investor and other requirements of the offering under securities laws.
The Company will use approximately half of the proceeds from the sale of the Series B Preferred Stock to reduce the outstanding principal amount under the Company’s unsecured revolving credit facility. The remaining proceeds are expected to be used to make investments in the business and for general corporate purposes.
In connection with Starboard’s investment, the Company expanded its Board of Directors to include two new independent directors, Jeffrey C. Smith, Chief Executive Officer of Starboard, who was appointed Chairman of the Board, and Anthony M. Sanfilippo, former Chairman and Chief Executive Officer of Pinnacle Entertainment, Inc. The Board of Directors believes Mr. Smith’s business expertise and new perspectives will help support the Company’s strategy to capitalize on its differentiated “BETTER INGREDIENTS. BETTER PIZZA.” market position and build a better pizza company for the benefit of its shareholders, team members, franchisees and customers. In addition, the Company’s President and Chief Executive Officer Steve Ritchie has been appointed to the Board. With the addition of the new directors, the Board currently is comprised of nine directors, seven of whom are independent.
Critical Accounting Policies and Estimates
The results of operations are based on our Consolidated Financial Statements, which were prepared in conformity with accounting principles generally accepted in the United States (“GAAP”). The preparation of Consolidated Financial Statements requires management to select accounting policies for critical accounting areas as well as estimates and assumptions that affect the amounts reported in the Consolidated Financial Statements. The Company’s significant accounting policies, including recently issued accounting pronouncements, are more fully described in “Note 2” of “Notes to Consolidated Financial Statements.” Significant changes in assumptions and/or conditions in our critical accounting policies could materially impact the operating results. We have identified the following accounting policies and related judgments as critical to understanding the results of our operations:
Revenue Recognition and Statement of Operations Presentation
In May 2014, the Financial Accounting Standards Board (“FASB”) issued Accounting Standards Update (“ASU”) 2014-09, “Revenue from Contracts with Customers” (“ASU 2014-09”), which supersedes nearly all existing revenue recognition guidance under GAAP, including industry-specific requirements, and provides companies with a single revenue recognition framework for recognizing revenue from contracts with customers. In March and April 2016, the FASB issued the following amendments to clarify the implementation guidance: ASU 2016-08, “Revenue from Contracts with Customers (Topic 606): Principal versus Agent Considerations (Reporting Revenue Gross versus Net)” and ASU 2016-
37
10, “Revenue from Contracts with Customers (Topic 606): Identifying Performance Obligations and Licensing”. This update and subsequently issued amendments (collectively “Topic 606”) requires companies to recognize revenue at amounts that reflect the consideration to which the company expects to be entitled in exchange for those goods or services at the time of transfer. Topic 606 requires that we assess contracts to determine each separate and distinct performance obligation. If a contract has multiple performance obligations, we allocate the transaction price using our best estimate of the standalone selling price to each distinct good or service in the contract.
We adopted Topic 606 using the modified retrospective transition method effective January 1, 2018. Results for reporting periods beginning after January 1, 2018 are presented under Topic 606, while prior period amounts are not adjusted and continue to be reported in accordance with our historical accounting under Topic 605, “Revenue Recognition.”
The cumulative effect adjustment of $21.5 million was recorded as a reduction to retained earnings as of January 1, 2018 to reflect the impact of adopting Topic 606. The impact of applying Topic 606 for 2018 included the following (dollars in thousands, except for per share amounts):
|
|
|
|
|
|
Year Ended |
|
|
|
December 30, 2018 |
|
|
|
|
|
|
Total revenue impact (a) |
$ |
4,010 |
|
Pre-tax income impact (b) |
|
(3,362) |
|
Diluted EPS |
|
(0.08) |
|
(a) |
The revenue increase of $4.0 million is primarily due to the requirement to present revenues and expenses related to marketing funds we control on a “gross” basis. This increase was partially offset by lower Company-owned restaurant revenues attributable to the revised method of accounting for the loyalty program and required reporting of franchise new store equipment incentives as a reduction of revenue. The marketing fund gross up is reported in the new financial statement line items, Other revenues and Other expenses, as discussed further below. |
|
(b) |
The $3.4 million decrease in pre-tax income in 2018 is primarily due to the revised method of accounting for the loyalty program and franchise fees. |
While not required as part of the adoption of Topic 606, our Statement of Operations includes newly created Other revenues and Other expenses line items. Other revenues and Other expenses include the Topic 606 “gross up” of respective revenues and expenses derived from certain domestic and international marketing fund co-ops we control, as previously discussed. Additionally, Other revenues and Other expenses include various reclassifications from North America commissary and Other, International and general and administrative expenses to better reflect and aggregate various domestic and international services provided by the Company for the benefit of franchisees. Related 2017 amounts have also been reclassified to conform to the new 2018 presentation. These reclassifications had no impact on total revenues or total costs and expenses reported. See “Note 24” of “Notes to Consolidated Financial Statements” for additional information.
Allowance for Doubtful Accounts and Notes Receivable
We establish reserves for uncollectible accounts and notes receivable based on overall receivable aging levels and a specific evaluation of accounts and notes for franchisees and other customers with known financial difficulties. Balances are charged off against the allowance after recovery efforts have ceased.
Noncontrolling Interests
At December 30, 2018, the Company has three joint ventures consisting of 183 restaurants, which have noncontrolling interests. During 2018, the Company refranchised 62 restaurants that were previously held in two additional joint ventures. Consolidated net income is required to be reported separately at amounts attributable to both the parent and the noncontrolling interests. Additionally, disclosures are required to clearly identify and distinguish between the interests of
38
the parent company and the interests of the noncontrolling owners, including a disclosure on the face of the Consolidated Statements of Operations of income attributable to the noncontrolling interest holder.
The following summarizes the redemption feature, location and related accounting within the Consolidated Balance Sheets for these three remaining joint venture arrangements:
|
Type of Joint Venture Arrangement |
|
Location within the Balance Sheets |
|
Recorded Value |
|
|
|
|
|
|
|
Joint venture with no redemption feature |
|
Permanent equity |
|
Carrying value |
|
|
|
|
|
|
|
Option to require the Company to purchase the noncontrolling interest - not currently redeemable |
|
Temporary equity |
|
Carrying value |
See “Note 8” and “Note 9” of “Notes to Consolidated Financial Statements” for additional information.
Intangible Assets — Goodwill
We evaluate goodwill annually in the fourth quarter or whenever we identify certain triggering events or circumstances that would more-likely-than-not reduce the fair value of a reporting unit below its carrying amount. Such tests are completed separately with respect to the goodwill of each of our reporting units, which includes our domestic Company-owned restaurants, United Kingdom (“PJUK”), China, and Preferred Marketing Solutions operations. We may perform a qualitative assessment or move directly to the quantitative assessment for any reporting unit in any period if we believe that it is more efficient or if impairment indicators exist.
We elected to perform a quantitative assessment for our domestic Company owned restaurants, United Kingdom (“PJUK”), China, and Preferred Marketing Solutions operations in the fourth quarter of 2018. We considered both an income approach and a market approach for our reporting units. The income approach used projected net cash flows adjusted for the appropriate time value of money factors. The selected discount rate considered the risk and nature of each reporting unit’s cash flow and the rates of return market participants would require to invest their capital in the reporting unit. In determining the fair value from a market approach, we considered earnings before interest, taxes, depreciation and amortization (“EBITDA”) and sales multiples that a potential buyer would pay based on third-party transactions in similar markets.
As a result of our quantitative analyses, we determined that it was more-likely-than-not that the fair values of our reporting units substantially exceeded their carrying amounts. Subsequent to completing our goodwill impairment tests, no indicators of impairment were identified. See “Note 10” of “Notes to Consolidated Financial Statements” for additional information.
Insurance Reserves
Our insurance programs for workers’ compensation, owned and non-owned automobiles, general liability, property, and health insurance coverage provided to our employees are funded by the Company up to certain retention levels under our retention programs. Retention limits generally range from $100,000 to $1.0 million.
Losses are accrued based upon undiscounted estimates of the liability for claims incurred using certain third-party actuarial projections and our claims loss experience. The estimated insurance claims losses could be significantly affected should the frequency or ultimate cost of claims differ significantly from historical trends used to estimate the insurance reserves recorded by the Company. The Company records estimated losses above retention within its reserve with a corresponding receivable for expected amounts due from insurance carriers.
Income Tax Accounts and Tax Reserves
Papa John’s is subject to income taxes in the United States and several foreign jurisdictions. Significant judgment is required in determining Papa John’s provision for income taxes and the related assets and liabilities. The provision for
39
income taxes includes income taxes paid, currently payable or receivable and those deferred. We use an estimated annual effective rate based on expected annual income to determine our quarterly provision for income taxes. Discrete items are recorded in the quarter in which they occur.
Deferred tax assets and liabilities are determined based on differences between financial reporting and tax basis of assets and liabilities and are measured using enacted tax rates and laws that are expected to be in effect when the differences reverse. Deferred tax assets are also recognized for the estimated future effects of tax attribute carryforwards (e.g., net operating losses, capital losses, and foreign tax credits). The effect on deferred taxes of changes in tax rates is recognized in the period in which the new tax rate is enacted. Valuation allowances are established when necessary on a jurisdictional basis to reduce deferred tax assets to the amounts we expect to realize.
On December 22, 2017, the Tax Cuts and Jobs Act (the “Tax Act”) was enacted, significantly decreasing the U.S. federal income tax rate for corporations effective January 1, 2018. On that same date, the Securities and Exchange Commission also issued Staff Accounting Bulletin (“SAB”) 118, which provides guidance on accounting for the tax effects of the Tax Act. SAB 118 provides a measurement period that should not extend beyond one year from the Tax Act enactment date for companies to complete the accounting under ASC 740, “Income Taxes.” As a result, we remeasured our deferred tax assets, liabilities and related valuation allowances in 2017. This remeasurement yielded a 2017 benefit of approximately $7.0 million due to the lower income tax rate. At December 30, 2018 the Company has completed its analysis of the Tax Act. See “Items Impacting Comparability” and “Note 17” for additional information. Our net deferred income tax liability was approximately $7.1 million at December 30, 2018.
Tax authorities periodically audit the Company. We record reserves and related interest and penalties for identified exposures as income tax expense. We evaluate these issues and adjust for events, such as statute of limitations expirations, court rulings or audit settlements, which may impact our ultimate payment for such exposures. We recognized decreases in income tax expense of $1.7 million and $729,000 in 2017 and 2016, respectively, associated with the finalization of certain income tax matters. There were no amounts recognized in 2018 as there were no related events. See “Note 17” of “Notes to Consolidated Financial Statements” for additional information.
Fiscal Year
Our fiscal year ends on the last Sunday in December of each year. All fiscal years presented in the accompanying Consolidated Financial Statements consist of 52 weeks except for the 2017 fiscal year, which consists of 53 weeks.
40
Items Impacting Comparability; Non-GAAP Measures
The below table reconciles our GAAP financial results to our adjusted (non-GAAP) financial results, excluding identified “Special items,” as detailed below. We present these non-GAAP measures because we believe the Special items impact the comparability of our results of operations. Additionally, the impact of the Company’s 53 week fiscal year in 2017 as compared to 52 weeks in 2018 and 2016 is highlighted below. For additional information about the special items, see “Note 2”, “Note 9”, “Note 17” and “Note 19” of “Notes to Consolidated Financial Statements,” respectively.
|
|
|
Year Ended |
|
|||||||
|
|
|
Dec. 30, |
|
Dec. 31, |
|
Dec. 25, |
|
|||
|
(In thousands, except per share amounts) |
|
2018 |
|
2017 |
|
2016 |
|
|||
|
GAAP Income before income taxes |
|
$ |
5,891 |
|
$ |
140,342 |
|
$ |
158,809 |
|
|
Special items: |
|
|
|
|
|
|
|
|
|
|
|
Special charges (1) |
|
|
50,732 |
|
|
— |
|
|
— |
|
|
Refranchising and impairment gains/(losses), net (2)(6) |
|
|
289 |
|
|
1,674 |
|
|
(10,222) |
|
|
Legal settlement (7) |
|
|
— |
|
|
— |
|
|
(898) |
|
|
Adjusted income before income taxes |
|
|
56,912 |
|
|
142,016 |
|
|
147,689 |
|
|
53rd week of operations |
|
|
— |
|
|
(5,900) |
|
|
— |
|
|
Adjusted income before income taxes - 52 weeks |
|
$ |
56,912 |
|
$ |
136,116 |
|
$ |
147,689 |
|
|
|
|
|
|
|
|
|
|
|
|
|
|
GAAP Net income |
|
$ |
1,646 |
|
$ |
102,292 |
|
$ |
102,820 |
|
|
Special items, net of income taxes: |
|
|
|
|
|
|
|
|
|
|
|
Special charges (1)(3) |
|
|
38,957 |
|
|
— |
|
|
— |
|
|
Refranchising and impairment gains/(losses), net (2)(3)(6) |
|
|
222 |
|
|
1,323 |
|
|
(6,455) |
|
|
Legal settlement (3)(7) |
|
|
— |
|
|
— |
|
|
(567) |
|
|
Tax impact of China refranchising (2) |
|
|
2,435 |
|
|
— |
|
|
— |
|
|
U.S. tax legislation effect on deferred taxes (4) |
|
|
— |
|
|
(7,020) |
|
|
— |
|
|
Equity compensation tax benefit (3)(5) |
|
|
— |
|
|
(1,879) |
|
|
— |
|
|
Net income, as adjusted |
|
|
43,260 |
|
|
94,716 |
|
|
95,798 |
|
|
53rd week of operations |
|
|
— |
|
|
(3,900) |
|
|
— |
|
|
Adjusted net income |
|
$ |
43,260 |
|
$ |
90,816 |
|
$ |
95,798 |
|
|
|
|
|
|
|
|
|
|
|
|
|
|
GAAP Diluted Earnings per share |
|
$ |
0.05 |
|
$ |
2.83 |
|
$ |
2.74 |
|
|
Special items: |
|
|
|
|
|
|
|
|
|
|
|
Special charges (1) |
|
|
1.21 |
|
|
— |
|
|
— |
|
|
Refranchising and impairment gains/(losses), net (2)(6) |
|
|
0.01 |
|
|
0.04 |
|
|
(0.17) |
|
|
Legal settlement (7) |
|
|
— |
|
|
— |
|
|
(0.02) |
|
|
Tax impact of China refranchising (2) |
|
|
0.07 |
|
|
— |
|
|
— |
|
|
U.S. tax legislation effect on deferred taxes (4) |
|
|
— |
|
|
(0.20) |
|
|
— |
|
|
Equity compensation tax benefit (5) |
|
|
— |
|
|
(0.05) |
|
|
— |
|
|
Adjusted diluted earnings per share |
|
|
1.34 |
|
|
2.62 |
|
|
2.55 |
|
|
53rd week of operations |
|
|
— |
|
|
(0.11) |
|
|
— |
|
|
Adjusted diluted earnings per share - 52 weeks |
|
$ |
1.34 |
|
$ |
2.51 |
|
$ |
2.55 |
|
|
|
|
|
|
|
|
|
|
|
|
|
|
(1) |
'Special charges' is defined as the costs and expenses in response to recent events including: (i) re-imaging costs at nearly all domestic restaurants and costs to replace or write-off certain branded assets of approximately $5.8 million, (ii) financial assistance to domestic franchisees, such as short-term royalty reductions, in an effort to mitigate closings of approximately $15.4 million, and (iii) contributions to the national marketing fund of $10.0 million to increase marketing and promotional activities, and (iv) costs totaling approximately $19.5 million associated with the activities of the Special Committee of the Board of Directors, including legal and advisory costs related to the review of a wide range of strategic opportunities that culminated in Starboard’s strategic investment in the Company by affiliates of Starboard Value LP, as well as a third-party audit of the culture of Papa John’s. |
41
|
(2) |
The refranchising and impairment (gains)/losses, net loss of $289,000 before tax and $222,000 net loss after tax in 2018 are primarily due to the loss associated with the China refranchise of the 34 Company-owned restaurants and the quality control center in China with impairment losses related to these stores in 2017 and 2016, substantially offset by refranchising gains related to the refranchising of 62 Company-owned restaurants in North America in 2018. We also had $2.4 million of additional tax expense associated with the China refranchise. This additional tax expense is primarily attributable to the required recapture of operating losses previously taken by Papa John’s International. |
|
(3) |
Tax effect was calculated using the Company's full year marginal rate of 23.2%, 21.0% and 36.9% for 2018, 2017 and 2016, respectively. |
|
(4) |
The U.S. income tax legislation effect on deferred taxes is related to the remeasurement of the net deferred tax liability due to the Tax Cuts and Jobs Act in 2017. |
|
(5) |
2017 also includes the favorable impact of adopting the new guidance for accounting for share-based compensation. This guidance requires excess tax benefits recognized on stock-based awards to be recorded as a reduction of income tax expense rather than stockholders’ equity. Beginning in 2018, and on a go-forward basis, the benefit or reduction in income from this change will not be shown as an adjustment in GAAP results. |
|
(6) |
2016 includes a refranchising gain from the sale of the Phoenix Company–owned market with 42 restaurants to a franchisee. |
|
(7) |
2016 legal settlement represents the favorable 2016 finalization related to the collective and class action litigation, Perrin v. Papa John’s International, Inc. and Papa John’s USA, Inc. |
The non-GAAP results previously shown and within this document, which exclude Special items, should not be construed as a substitute for or a better indicator of the Company’s performance than the Company’s GAAP results. Management believes presenting certain financial information without the Special items is important for purposes of comparison to prior year results. In addition, management uses these metrics to evaluate the Company’s underlying operating performance and to analyze trends. See “Results of Operations” for further analysis regarding the impact of the Special items.
In addition, we present free cash flow in this report, which is a non-GAAP measure. We define free cash flow as net cash provided by operating activities (from the Consolidated Statements of Cash Flows) less the purchases of property and equipment. We view free cash flow as an important measure because it is one factor that management uses in determining the amount of cash available for discretionary investment. Free cash flow is not a term defined by GAAP, and as a result, our measure of free cash flow might not be comparable to similarly titled measures used by other companies. Free cash flow should not be construed as a substitute for or a better indicator of our performance than the Company’s GAAP measures. See “Liquidity and Capital Resources” for a reconciliation of free cash flow to the most directly comparable GAAP measure.
We also present Operating margin (loss) in this report. Operating margin (loss) is not a measure defined by GAAP and should not be considered in isolation, or as an alternative to evaluation of the Company’s financial performance. In addition to an evaluation of GAAP consolidated income before income taxes, we believe the presentation of operating margin (loss) is beneficial as it represents an additional measure used by the Company to further evaluate operating efficiency and performance of the various business units. Additionally, operating margin (loss) discussion may be helpful for comparison within the industry. The operating margin (loss) results detailed herein can be calculated by business unit based on the specific revenue and operating expense line items on the face of the Consolidated Statements of Operations. Consolidated income before income taxes reported includes general and administrative expenses, depreciation and amortization, refranchising losses and net interest expense that have been excluded from this operating margin (loss) calculation. See “Results of Operations – costs and expenses” for a reconciliation of operating margin (loss) to the most directly comparable GAAP measure.
The presentation of the non-GAAP measures in this report is made alongside the most directly comparable GAAP measures.
42
Percentage Relationships and Restaurant Data and Unit Progression
The following tables set forth the percentage relationship to total revenues, unless otherwise indicated, of certain income statement data, and certain restaurant data for the years indicated. Certain prior year data has been reclassified, with no impact on total revenues or total expenses, to conform to current year presentation. See “Note 24” of “Notes to Consolidated Financial Statements” for additional information.
|
|
|
Year Ended(1) |
|
||||
|
|
|
Dec. 30, |
|
Dec. 31, |
|
Dec. 25, |
|
|
|
|
2018 |
|
2017 |
|
2016 |
|
|
|
|
(52 weeks) |
|
(53 weeks) |
|
(52 weeks) |
|
|
Income Statement Data: |
|
|
|
|
|
|
|
|
Revenues: |
|
|
|
|
|
|
|
|
Domestic Company-owned restaurant sales |
|
44.0 |
% |
45.8 |
% |
47.6 |
% |
|
North America franchise royalties and fees |
|
5.0 |
|
6.0 |
|
6.0 |
|
|
North America commissary |
|
38.8 |
|
37.8 |
|
36.4 |
|
|
International |
|
7.0 |
|
6.4 |
|
4.1 |
|
|
Other revenues |
|
5.2 |
|
4.0 |
|
5.9 |
|
|
Total revenues |
|
100.0 |
|
100.0 |
|
100.0 |
|
|
Costs and expenses: |
|
|
|
|
|
|
|
|
Operating costs (excluding depreciation and amortization shown separately below): |
|
|
|
|
|
|
|
|
Domestic Company-owned restaurant operating expense (2) |
|
83.3 |
|
81.4 |
|
79.9 |
|
|
North America commissary (3) |
|
94.3 |
|
93.7 |
|
92.9 |
|
|
International operating expense (4) |
|
61.4 |
|
61.9 |
|
94.8 |
|
|
Other expenses (5) |
|
103.2 |
|
96.1 |
|
62.0 |
|
|
General and administrative expenses |
|
12.2 |
|
8.5 |
|
9.2 |
|
|
Depreciation and amortization |
|
2.9 |
|
2.4 |
|
2.4 |
|
|
Total costs and expenses |
|
98.1 |
|
91.4 |
|
91.0 |
|
|
Refranchising and impairment gains/(losses), net |
|
— |
|
(0.1) |
|
0.6 |
|
|
Operating income |
|
1.9 |
|
8.5 |
|
9.6 |
|
|
Legal settlement |
|
— |
|
— |
|
0.1 |
|
|
Net interest expense |
|
(1.5) |
|
(0.6) |
|
(0.4) |
|
|
Income before income taxes |
|
0.4 |
|
7.9 |
|
9.3 |
|
|
Income tax expense |
|
0.2 |
|
1.9 |
|
2.9 |
|
|
Net income before attribution to noncontrolling interests |
|
0.2 |
|
6.0 |
|
6.4 |
|
|
Income attributable to noncontrolling interests |
|
(0.1) |
|
(0.3) |
|
(0.4) |
|
|
Net income attributable to the Company |
|
0.1 |
% |
5.7 |
% |
6.0 |
% |
43
|
|
|
Year Ended (1) |
|
|||||||
|
|
|
Dec. 30, |
|
Dec. 31, |
|
Dec. 25, |
|
|||
|
|
|
2018 |
|
2017 |
|
2016 |
|
|||
|
|
|
(52 weeks) |
|
(53 weeks) |
|
(52 weeks) |
|
|||
|
Restaurant Data: |
|
|
|
|
|
|
|
|
|
|
|
Percentage (decrease) increase in comparable domestic Company-owned restaurant sales (6) |
|
|
(9.0) |
% |
|
0.4 |
% |
|
4.4 |
% |
|
Number of domestic Company-owned restaurants included in the most recent full year’s comparable restaurant base |
|
|
637 |
|
|
676 |
|
|
694 |
|
|
Average sales for domestic Company-owned restaurants included in the most recent comparable restaurant base |
|
$ |
1,072,000 |
|
$ |
1,192,000 |
|
$ |
1,156,000 |
|
|
|
|
|
|
|
|
|
|
|
|
|
|
Papa John’s Restaurant Progression: |
|
|
|
|
|
|
|
|
|
|
|
North America Company-owned: |
|
|
|
|
|
|
|
|
|
|
|
Beginning of period |
|
|
708 |
|
|
702 |
|
|
707 |
|
|
Opened |
|
|
6 |
|
|
9 |
|
|
13 |
|
|
Closed |
|
|
(7) |
|
|
(3) |
|
|
(1) |
|
|
Acquired from franchisees |
|
|
— |
|
|
1 |
|
|
25 |
|
|
Sold to franchisees (7) |
|
|
(62) |
|
|
(1) |
|
|
(42) |
|
|
End of period |
|
|
645 |
|
|
708 |
|
|
702 |
|
|
International Company-owned: |
|
|
|
|
|
|
|
|
|
|
|
Beginning of period |
|
|
35 |
|
|
42 |
|
|
45 |
|
|
Closed |
|
|
(1) |
|
|
(7) |
|
|
(3) |
|
|
Sold to franchisees (7) |
|
|
(34) |
|
|
— |
|
|
— |
|
|
End of period |
|
|
— |
|
|
35 |
|
|
42 |
|
|
North America franchised: |
|
|
|
|
|
|
|
|
|
|
|
Beginning of period |
|
|
2,733 |
|
|
2,739 |
|
|
2,681 |
|
|
Opened |
|
|
83 |
|
|
110 |
|
|
104 |
|
|
Closed |
|
|
(186) |
|
|
(116) |
|
|
(63) |
|
|
Acquired from Company (7) |
|
|
62 |
|
|
1 |
|
|
42 |
|
|
Sold to Company |
|
|
— |
|
|
(1) |
|
|
(25) |
|
|
End of period |
|
|
2,692 |
|
|
2,733 |
|
|
2,739 |
|
|
International franchised: |
|
|
|
|
|
|
|
|
|
|
|
Beginning of period |
|
|
1,723 |
|
|
1,614 |
|
|
1,460 |
|
|
Opened |
|
|
304 |
|
|
257 |
|
|
226 |
|
|
Closed |
|
|
(95) |
|
|
(148) |
|
|
(72) |
|
|
Acquired from Company (7) |
|
|
34 |
|
|
— |
|
|
— |
|
|
End of period |
|
|
1,966 |
|
|
1,723 |
|
|
1,614 |
|
|
Total restaurants - end of period |
|
|
5,303 |
|
|
5,199 |
|
|
5,097 |
|
|
(1) |
We operate on a 52-53 week fiscal year ending on the last Sunday of December of each year. The 2018 and 2016 fiscal years consisted of 52 weeks and the 2017 fiscal year consisted of 53 weeks. The additional week in 2017 resulted in additional revenues of approximately $30.9 million and additional income before income taxes of approximately $5.9 million, or $0.11 per diluted share. Additionally, 2017 and 2016 amounts have also been reclassified to conform to the new 2018 presentation for Other revenues and Other expenses. These reclassifications had no impact on total revenues or total costs and expenses reported. See “Note 24” of “Notes to Consolidated Financial Statements” for additional information. |
|
(2) |
As a percentage of domestic Company-owned restaurant sales. |
|
(3) |
As a percentage of North America commissary sales. |
|
(4) |
As a percentage of international sales. |
|
(5) |
As a percentage of other revenues. |
|
(6) |
Represents the change in year-over-year sales for Company-owned restaurants open throughout the periods being compared. |
44
|
(7) |
In 2018, the Company refranchised 62 Company-owned North America restaurants located in Minnesota and Denver and 34 international restaurants located in China. See Items Impacting Comparability and “Note 9” of “Notes to Consolidated Financial Statements” for additional information. |
Results of Operations
Review of Consolidated Operating Results
2018 Compared to 2017
Discussion of Revenues. Consolidated revenues decreased $210.1 million, or 11.8%, to $1.57 billion in 2018, compared to $1.78 billion in 2017. Excluding the revenues for the 53rd week of operations in 2017 of $30.9 million, consolidated revenues decreased $179.2 million, or 10.1%. Revenues are summarized in the following table (dollars in thousands).
|
|
|
Year Ended |
|
|
|
|
|
|
||||
|
|
|
|
|
|
|
|
|
Increase |
|
Increase |
||
|
|
|
Dec. 30, |
|
Dec. 31, |
|
(Decrease) |
|
(Decrease) |
||||
|
|
|
2018 |
|
2017 |
|
$ |
|
% |
||||
|
|
|
|
|
|
|
|
|
|
|
|
|
|
|
Domestic Company-owned restaurant sales |
|
$ |
692,380 |
|
$ |
816,718 |
|
$ |
(124,338) |
|
(15.2) |
% |
|
North America franchise royalties and fees |
|
|
79,293 |
|
|
106,729 |
|
|
(27,436) |
|
(25.7) |
% |
|
North America commissary |
|
|
609,866 |
|
|
673,712 |
|
|
(63,846) |
|
(9.5) |
% |
|
International |
|
|
110,349 |
|
|
114,021 |
|
|
(3,672) |
|
(3.2) |
% |
|
Other revenues |
|
|
81,428 |
|
|
72,179 |
|
|
9,249 |
|
12.8 |
% |
|
Total Revenues |
|
$ |
1,573,316 |
|
$ |
1,783,359 |
|
$ |
(210,043) |
|
(11.8) |
% |
Domestic Company-owned restaurant sales decreased $124.3 million, or 15.2% in 2018. Excluding the benefit of the 53rd week of operations of $15.6 million in 2017, the Domestic Company-owned restaurant sales decreased $108.7 million, or 13.6% in 2018. These decreases were primarily due to the negative comparable sales of 9.0% and a reduction of revenues of $42.2 million from the refranchising of 62 Company-owned restaurants in 2018. “Comparable sales” represents the change in year-over-year sales for the same base of restaurants for the same fiscal periods.
North America franchise royalties and fees decreased $27.4 million, or 25.7% in 2018. Excluding the benefit of the 53rd week of operations of $1.9 million in 2017, the decrease was $25.5 million, or 24.4%, primarily due to short-term royalty reductions granted to the entire North America system as part of the franchise assistance program of approximately $15.4 million, which is included in the Special charges previously discussed. Royalties were further reduced by negative comparable sales of 6.7% in 2018. North America franchise restaurant systemwide sales decreased 7.4% or $169.6 million to $2.1 billion (5.4% or $120.9 million on a 52 week basis) primarily due to the negative comparable sales. North America franchise restaurant sales are not included in Company revenues; however, our North America franchise royalties are derived from these sales.
North America commissary sales decreased $63.8 million, or 9.5% in 2018. Excluding the benefit of the 53rd week of operations of $10.8 million in 2017, the decrease was $53.0 million, or 8.0% primarily due to lower sales volumes attributable to lower restaurant sales. In addition, North America commissary revenues were reduced approximately $2.6 million due to required reporting of franchise new store equipment incentives as a reduction of revenue under Topic 606. These incentives were previously recorded as General and administrative expenses.
International revenues decreased approximately $3.7 million, or 3.2% in 2018. Excluding the benefit of the 53rd week of operations of $2.2 million in 2017, the decrease was $1.5 million, or 1.3%. These decreases are net of the favorable impact of foreign currency rates of approximately $2.7 million. The decrease was primarily due to the refranchising of the Company-owned restaurants and quality control center in China of approximately $8.1 million in 2018, lower franchise fees, development fees and lower revenues due to required reporting of franchise new store equipment incentives as a reduction of revenue after adoption of Topic 606, partially offset by higher royalties due to an increase in equivalent units.
45
“Equivalent units” represents the number of restaurants open at the beginning of a given period, adjusted for restaurants opened, closed, acquired or sold during the period on a weighted average basis.
International franchise restaurant systemwide sales increased 14.6% to $832.3 million in 2018, excluding the impact of foreign currency, due to the increase in equivalent units. International franchise restaurant sales are not included in Company revenues; however, our international royalty revenue is derived from these sales.
Other revenues increased $9.2 million, or 12.8% in 2018 primarily due to the required 2018 reporting of franchise marketing fund revenues and expenses on a gross basis for the various funds we control in accordance with Topic 606. These amounts were previously reported on a net basis. As we did not restate the 2017 amounts in accordance with our adoption of Topic 606 using the modified retrospective approach, comparability between 2018 and 2017 amounts is reduced. See “Note 3” of “Notes to Consolidated Financial Statements” for more details. This increase was partially offset by lower revenues for Preferred Marketing Solutions, our print and promotions subsidiary.
Costs and expenses. The operating margin for domestic Company-owned restaurants was 16.7% in 2018 and 18.6% in 2017, and consisted of the following (dollars in thousands):
|
|
Year ended |
|||||||||
|
|
December 30, 2018 |
|
December 31, 2017 |
|||||||
|
|
|
|
|
|
|
|
|
|
|
|
|
Restaurant sales |
$ |
692,380 |
|
|
|
|
$ |
816,718 |
|
|
|
|
|
|
|
|
|
|
|
|
|
|
|
Cost of sales |
|
153,081 |
|
|
22.1% |
|
|
188,017 |
|
23.0% |
|
Other operating expenses |
|
423,718 |
|
|
61.2% |
|
|
476,623 |
|
58.4% |
|
Total expenses |
$ |
576,799 |
|
|
83.3% |
|
$ |
664,640 |
|
81.4% |
|
|
|
|
|
|
|
|
|
|
|
|
|
Margin |
$ |
115,581 |
|
|
16.7% |
|
$ |
152,078 |
|
18.6% |
Domestic Company-owned restaurants margin decreased $36.5 million, or 1.9%, as a percentage of restaurant sales or $34.1 million, excluding the 53rd week of operations in 2017. The decrease was primarily attributable to negative comparable sales of 9.0% as well as higher labor costs including higher minimum wages, and increased non-owned automobile costs of $5.4 million. Additionally, the adoption of Topic 606 reduced restaurant operating margin due to the revised method of accounting for the customer loyalty program.
North America commissary operating margin was 5.7% in 2018 compared to 6.3% in 2017, and consisted of the following (dollars in thousands):
|
|
Year Ended |
||||||||
|
|
December 30, 2018 |
|
|
December 31, 2017 |
|||||
|
North America commissary sales |
$ |
609,866 |
|
|
|
$ |
673,712 |
|
|
|
North America commissary expenses |
|
575,103 |
|
|
|
|
631,537 |
|
|
|
Margin |
$ |
34,763 |
|
5.7% |
|
$ |
42,175 |
|
6.3% |
|
|
|
|
|
|
|
|
|
|
|
North America commissary margin was $7.4 million lower in 2018, or 0.6%, as a percentage of related revenues, or $5.7 million excluding the 53rd week of operations in 2017, or 0.4% as a percentage of related revenues. This decrease was primarily due to a decline in North American restaurant sales and the Company’s commitment to reduce its overall profit margin as additional support to franchisees. In addition, the lower commissary margin is due to the required reporting of $2.6 million in new store franchise equipment incentives as a revenue reduction under Topic 606, as previously discussed. The reduction attributable to the equipment incentives is offset by a reduction in General and administrative costs.
46
The international operating margin was 38.6% in 2018 compared to 38.1% in 2017 and consisted of the following (dollars in thousands):
|
|
|
Year Ended |
|||||||||||||||||||||
|
|
|
December 30, 2018 |
|
December 31, 2017 |
|||||||||||||||||||
|
|
|
Revenues |
|
Expenses |
|
Margin |
|
Margin |
|
Revenues |
|
Expenses |
|
Margin |
|
Margin % |
|||||||
|
Franchise royalties and fees |
|
$ |
35,988 |
|
$ |
- |
|
$ |
35,988 |
|
|
|
$ |
35,125 |
|
$ |
- |
|
$ |
35,125 |
|
|
|
|
Restaurant, commissary and other |
|
|
74,361 |
|
|
67,775 |
|
|
6,586 |
|
8.9% |
|
|
78,896 |
|
|
70,622 |
|
|
8,274 |
|
10.5% | |
|
Total international |
|
$ |
110,349 |
|
$ |
67,775 |
|
$ |
42,574 |
|
38.6% |
|
$ |
114,021 |
|
$ |
70,622 |
|
$ |
43,399 |
|
38.1% | |
The international operating margin decreased $800,000, which was primarily due to the benefit of $700,000 from the 53rd week of operations in 2017. Additionally, higher royalties from increased equivalent units were offset by lower new store opening fees after the adoption of Topic 606 and a lower United Kingdom QCC margin of $700,000 due to the required reporting of franchise new store equipment incentives under Topic 606, as previously discussed. These incentives were previously recorded as General and administrative expenses. As a percentage of international revenues, the operating margin increased 0.5% primarily due to the divestiture of our China operations in the second quarter of 2018.
The Other revenues and expenses consisted of the following for the years ended December 30, 2018 and December 31, 2017 (dollars in thousands):
|
|
Year Ended |
||||||||
|
December 30, 2018 |
December 31, 2017 |
||||||||
|
Other revenues |
$ |
81,428 |
|
|
|
$ |
72,179 |
|
|
|
Other expenses |
|
84,016 |
|
|
|
|
69,335 |
|
|
|
Margin (loss) |
$ |
(2,588) |
|
(3.2%) |
|
$ |
2,844 |
|
3.9% |
|
|
|
|
|
|
|
|
|
|
|
As previously discussed, other revenues and other expenses are new financial statement line items in 2018. The margin from Other operations decreased $5.4 million in 2018 primarily due to higher costs related to various technology initiatives and increased advertising spend in the United Kingdom.
47
General and administrative (“G&A”) expenses were $192.6 million, or 12.2% of revenues for 2018 compared to $150.9 million, or 8.5% of revenues for 2017. G&A expenses consisted of the following (dollars in thousands):
|
|
Year Ended |
||||
|
|
December 30, |
|
December 31, |
||
|
|
2018 |
|
2017 |
||
|
Contribution to National Marketing Fund (a) |
$ |
10,000 |
|
$ |
- |
|
Re-imaging costs for restaurants and write-off of brand assets (b) |
|
5,841 |
|
|
- |
|
Provision (credit) for uncollectible accounts and notes receivable (c) |
|
3,338 |
|
|
(1,441) |
|
Loss on disposition of fixed assets |
|
2,233 |
|
|
2,493 |
|
Papa Rewards (d) |
|
- |
|
|
1,046 |
|
Franchise support initiative (e) |
|
34 |
|
|
2,986 |
|
Other |
|
(1,725) |
|
|
343 |
|
Other general expenses |
|
19,721 |
|
|
5,427 |
|
Special Committee costs (f) |
|
19,474 |
|
|
- |
|
Administrative expenses (g) |
|
153,356 |
|
|
145,439 |
|
General and administrative expenses (h) |
$ |
192,551 |
|
$ |
150,866 |
|
(a) |
Contributions to National Marketing Fund to increase marketing and promotional activities during 2018. |
|
(b) |
During 2018, the Company paid for certain re-imaging costs for both Company-owned and franchise units. |
|
(c) |
Bad debt recorded on accounts receivable and notes receivable. |
|
(d) |
Online customer loyalty program in 2017. In 2018, the Company adopted Topic 606 with updated accounting guidelines for loyalty programs. |
|
(e) |
Franchise incentives include incentives to franchisees for opening new restaurants. In 2018, the Company adopted Topic 606 with updated accounting guidelines for new store equipment incentives, which are now recorded as a reduction of commissary revenues. |
|
(f) |
Costs totaling approximately $19.5 million associated with the activities of the Special Committee of the Board of Directors, including legal and advisory costs related to the review of a wide range of strategic opportunities for the Company that culminated in the recent strategic investment in the Company by affiliates of Starboard Value LP, as well as a third-party audit of the culture of Papa John’s. |
|
(g) |
The increase in administrative expenses is mainly due to higher technology initiative costs and a $1.5 million contribution to our newly formed Papa John’s Foundation, a separate legal entity that is not consolidated in the Company’s results. In addition, administrative expenses increased due to higher legal and professional fees not associated with the Special charges. |
|
(h) |
The impact of the 53rd week in 2017 was $900,000 additional expense. |
See “Recent Developments and Trends” and “Note 19” of “Notes to Consolidated Financial Statements” for additional Special charges details.
Depreciation and amortization was $46.4 million, or 2.9% of revenues in 2018, as compared to $43.7 million, or 2.4% of revenues for 2017. This increase of $2.7 million from 2017 was primarily due to additional depreciation on technology related investments and the impact associated with our Georgia quality control center, which opened in July of 2017.
Refranchising and impairment gains/(losses), net. 2018 includes a $289,000 loss primarily due to the China refranchise of the 34 Company-owned restaurants and the quality control center in China that occurred in 2018, substantially offset by refranchising gains related to the refranchising of 62 Company-owned restaurants in North America in 2018. The full year 2017 amount includes an impairment charge of $1.7 million related to our Company-owned stores in China. See “Note 9” of “Notes to Consolidated Financial Statements” for additional information.
Interest expense. Interest expense increased approximately $14.0 million primarily due to higher average outstanding debt balances, which is primarily due to share repurchases, as well as higher interest rates. The 53rd week of operations in 2017 increased interest expense for the year by approximately $300,000.
48
Income tax expense. The effective income tax rates were 44.9% in 2018 and 24.1% in 2017. The increase in the effective income tax rate for 2018 was primarily attributable to the rate increase related to the China divestiture, as previously detailed in the Special items. Additionally, the rate for 2017 was decreased by the one-time benefit of approximately $7.0 million for the remeasurement of deferred tax assets and liabilities after the Tax Act was signed into law. See “Items Impacting Comparability” and “Notes 9 and 17” of “Notes to Consolidated Financial Statements for additional information.
|
|
Years Ended |
||||
|
|
December 30, 2018 |
|
December 31, 2017 |
||
|
|
|
|
|
|
|
|
Income before income taxes |
$ |
5,891 |
|
$ |
140,342 |
|
Income tax expense |
|
2,646 |
|
|
33,817 |
|
Effective tax expense |
|
44.9% |
|
|
24.1% |
Diluted earnings per share. Diluted earnings per share (“EPS”) were $0.05 for 2018 compared to $2.83 in 2017. Excluding Special items, adjusted EPS in 2018 was $1.34, a decrease of 46.6% versus 2017 adjusted EPS of $2.51.
2017 Compared to 2016
Discussion of Revenues. Consolidated revenues increased $69.7 million, or 4.1%, to $1.78 billion in 2017, compared to $1.71 billion in 2016. Revenues for the 53rd week of operations in 2017 approximated $30.9 million, or 1.8%. Revenues are summarized in the following table (dollars in thousands).
|
|
|
Year Ended |
|
Increase |
|
Increase |
|
|
|||||
|
|
|
Dec. 31, |
|
Dec. 25, |
|
(decrease) |
|
(decrease) |
|
|
|||
|
(In thousands) |
|
2017 |
|
2016 |
|
$ |
|
% |
|
|
|||
|
|
|
|
|
|
|
|
|
|
|
|
|
|
|
|
Domestic Company-owned restaurant sales |
|
$ |
816,718 |
|
$ |
815,931 |
|
$ |
787 |
|
0.1 |
% |
|
|
North America franchise royalties and fees |
|
|
106,729 |
|
|
102,980 |
|
|
3,749 |
|
3.6 |
% |
|
|
North America commissary |
|
|
673,712 |
|
|
623,883 |
|
|
49,829 |
|
8.0 |
% |
|
|
International |
|
|
114,021 |
|
|
100,904 |
|
|
13,117 |
|
13.0 |
% |
|
|
Other revenues |
|
|
72,179 |
|
|
69,922 |
|
|
2,257 |
|
3.2 |
% |
|
|
Total Revenues |
|
$ |
1,783,359 |
|
$ |
1,713,620 |
|
$ |
69,739 |
|
4.1 |
% |
|
Domestic Company-owned restaurant sales increased $787,000, or 0.1% in 2017. Excluding the benefit of the 53rd week of operations of $15.6 million, the Domestic Company-owned restaurant sales decreased $14.8 million, or 1.8% in 2017, primarily due to a 3.1% reduction in equivalent units in 2017 from the refranchising of 42 restaurants in the fourth quarter of 2016. This was somewhat offset by an increase of 0.4% in comparable sales.
North America franchise royalties and fees increased $3.7 million, or 3.6% in 2017, primarily due to an increase in equivalent units of 2.2% mainly due to the refranchising of 42 restaurants in 2016 and a benefit of $1.9 million, or 1.8% for the 53rd week of operations. North America franchise restaurant systemwide sales increased 4.7% to $2.3 billion ($2.25 billion on a 52 week basis) primarily due to the increase in equivalent units noted above. These increases were slightly offset by lower comparable sales of negative 0.1%. Franchise restaurant sales are not included in Company revenues; however, our North America royalty revenue is derived from these sales.
North America commissary revenues increased $49.8 million, or 8.0% in 2017, primarily due higher sales from higher commodity pricing as well as higher volumes. The benefit from the 53rd week of operations was approximately $10.8 million, or 1.6%.
49
International revenues increased approximately $13.1 million, or 13.0% in 2017. This increase is net of the unfavorable impact of foreign currency rates of approximately $4.1 million. The increase was primarily due to the following:
|
· |
Royalties and commissary revenues increased due to a higher number of franchised restaurants and comparable sales of 4.4%, calculated on a constant dollar basis. International franchise restaurant systemwide sales increased 17.3% to $761.3 million ($744.0 million on a 52 week basis) in 2017. International franchise restaurant systemwide sales are not included in Company revenues; however, our international royalty revenue is derived from these sales. |
|
· |
The benefit of the 53rd week of operations was $2.2 million, or 2.0%. |
|
· |
These increases were somewhat offset by lower China Company-owned restaurant revenues due to fewer restaurants in 2017. |
Other revenues increased $2.3 million, or 3.2% in 2017 primarily due to higher online sales, partially offset by lower sales for Preferred Marketing Solutions, our print and promotions subsidiary. The benefit from the 53rd week of operations was approximately $400,000, or 0.6%. 2017 and 2016 revenues were reclassified for comparability to 2018 presentation. See “Note 24” of “Notes to Consolidated Financial Statements” for additional information.
Costs and expenses. The operating margin for domestic Company-owned restaurants was 18.6% in 2017 and 20.2% in 2016, and consisted of the following (dollars in thousands):
|
|
Year Ended |
||||||||
|
|
December 31, 2017 |
|
December 25, 2016 |
||||||
|
|
|
|
|
|
|
|
|
|
|
|
Restaurant sales |
$ |
816,718 |
|
|
|
$ |
815,931 |
|
|
|
|
|
|
|
|
|
|
|
|
|
|
Cost of sales |
|
188,017 |
|
23.0% |
|
|
186,226 |
|
22.8% |
|
Other operating expenses |
|
476,623 |
|
58.4% |
|
|
465,310 |
|
57.0% |
|
Total expenses |
$ |
664,640 |
|
81.4% |
|
$ |
651,536 |
|
79.8% |
|
|
|
|
|
|
|
|
|
|
|
|
Margin |
$ |
152,078 |
|
18.6% |
|
$ |
164,395 |
|
20.2% |
Domestic Company-owned restaurants margin decreased $12.3 million, or 1.6%, as a percentage of restaurant sales. The decrease was primarily attributable to higher automobile and workers compensation insurance costs of approximately $6.2 million as well as higher cost of sales from higher commodities, mainly cheese and meats. The higher labor costs from higher minimum wages were offset by lower restaurant bonuses due to the lower operating results and sales results that were below target. These decreases in operating income were somewhat offset by the benefit from the 53rd week of operations in 2017 of approximately $2.4 million.
The North America commissary and other operating margin was 6.3% in 2017 compared to 7.1% in 2016, and consisted of the following (dollars in thousands):
|
|
Year Ended |
||||||||
|
|
December 31, 2017 |
|
|
December 25, 2016 |
|||||
|
North America commissary sales |
$ |
673,712 |
|
|
|
$ |
623,883 |
|
|
|
North America commissary expenses |
|
631,537 |
|
|
|
|
579,834 |
|
|
|
Margin |
$ |
42,175 |
|
6.3% |
|
$ |
44,049 |
|
7.1% |
|
|
|
|
|
|
|
|
|
|
|
The North America commissary margin was $1.9 million lower in 2017, or 0.8%, as a percentage of related revenues, primarily due to the start-up and higher operating costs related to our new commissary in Georgia that opened in the third quarter of 2017, partially offset by the increase in income from higher volumes. The decrease in operating margin was somewhat offset by the $2.0 million benefit of the 53rd week.
50
The international operating margin was 37.5% in 2017 compared to 36.8% in 2016 and consisted of the following (dollars in thousands):
|
|
|
Year Ended |
||||||||||||||||||||
|
|
|
December 31, 2017 |
|
December 25, 2016 |
||||||||||||||||||
|
|
|
Revenues |
|
Expenses |
|
Margin $ |
|
Margin % |
|
Revenues |
|
Expenses |
|
Margin $ |
|
Margin % |
||||||
|
Franchise royalties and fees |
|
$ |
35,125 |
|
$ |
- |
|
$ |
35,125 |
|
|
|
$ |
30,040 |
|
$ |
- |
|
$ |
30,040 |
|
|
|
Restaurant, commissary and other |
|
|
78,896 |
|
|
70,622 |
|
|
8,274 |
|
10.5% |
|
|
70,864 |
|
|
62,574 |
|
|
8,290 |
|
11.7% |
|
Total international |
|
$ |
114,021 |
|
$ |
70,622 |
|
$ |
43,399 |
|
38.1% |
|
$ |
100,904 |
|
$ |
62,574 |
|
$ |
38,330 |
|
38.0% |
The increase in international operating margins of $5.1 million was primarily due to higher franchise royalties due to an increase in the number of restaurants and comparable sales of 4.4%. This increase also includes approximately $700,000 for the 53rd week of operations in 2017. These increases were partially offset by a lower operating margin for our Company-owned stores in China.
As previously discussed, other revenues and other expenses are new financial statement line items in 2018. Related 2017 and 2016 amounts have been reclassified for comparability to 2018 presentation. See “Note 24” of “Notes to Consolidated Financial Statements” for additional information.
The Other revenues and expenses margin, as detailed below for 2017 and 2016, was slightly lower by approximately $825,000 primarily due to lower margin for Preferred Marketing Solutions, our print and promotions subsidiary.
The Other revenues and expenses consisted of the following for 2017 and 2016 (dollars in thousands):
|
|
Year Ended |
||||||||
|
|
December 31, 2017 |
|
|
December 25, 2016 |
|||||
|
Other revenues |
$ |
72,179 |
|
|
|
$ |
69,922 |
|
|
|
Other expenses |
|
69,335 |
|
|
|
|
66,253 |
|
|
|
Margin (loss) |
$ |
2,844 |
|
3.9% |
|
$ |
3,669 |
|
5.2% |
|
|
|
|
|
|
|
|
|
|
|
General and administrative (G&A) expenses were $150.9 million, or 8.5% of revenues for 2017, compared to $158.1 million, or 9.2% of revenues for 2016. The decrease of $7.2 million for 2017 was primarily due to lower management incentive costs and lower restaurant supervisor bonuses, which were somewhat offset by higher salaries and benefits. The 53rd week of operations in 2017 increased general and administrative expenses by approximately $900,000.
Depreciation and amortization was $43.7 million, or 2.4% of revenues in 2017, as compared to $41.0 million, or 2.4% of revenues for 2016. This increase of $2.7 million from 2016 was primarily due to higher depreciation on additional technology assets associated with digital initiatives.
Refranchising and impairment gains/(losses), net. The full year 2017 amount includes an impairment charge of $1.7 million related to our Company-owned stores in China that were held for sale. We incurred a related impairment charge in 2016 for $1.4 million. See “Items Impacting Comparability” and “Note 7” of “Notes to Consolidated Financial Statements” for additional information. The full year 2017 amount has no refranchising activity whereas 2016 includes a gain of $11.6 million from the refranchising of our Company-owned Phoenix market with 42 restaurants.
Legal settlement. The 2017 results have no significant legal settlement amounts whereas 2016 includes a favorable legal settlement finalization of $898,000 related to the collective and class action, Perrin v. Papa John’s International, Inc. and Papa John’s USA. The settlement amount was finalized and paid in 2016 and the expense was adjusted accordingly.
51
Interest expense. Interest expense increased approximately $4.1 million primarily due to higher average outstanding debt balances, which is primarily due to share repurchases, as well as higher interest rates. The 53rd week of operations in 2017 increased interest expense for the year by approximately $300,000.
Income tax expense. The effective income tax rates were 24.1% in 2017 and 31.3% in 2016. The decrease in the effective income tax rates for 2017 was primarily attributable to the impact of Tax Act which was signed into law at the end of 2017. The Tax Act contains substantial changes to the Internal Revenue Code including a reduction of the U.S. corporate tax rate from 35% to 21% effective January 1, 2018. Upon enactment, 2017 deferred tax assets and liabilities were remeasured. This remeasurement yielded a one-time benefit of approximately $7.0 million in the fourth quarter of 2017. Given the substantial changes associated with the Tax Act, the estimated financial impacts for 2017 are provisional and subject to further interpretation and clarification of the Tax Act during 2018. See “Items Impacting Comparability” and “Note 2” of “Notes to Consolidated Financial Statements” for additional information.
Diluted earnings per share. Diluted EPS were $2.83 for 2017 compared to $2.74 in 2016, an increase of 3.3%. Excluding Special items, adjusted EPS was $2.62, an increase of 2.7% versus 2016 adjusted EPS of $2.55. This increase includes the $0.11 favorable impact of the 53rd week, a favorable tax rate and lower share count. These favorable items were somewhat offset by other decreases in income.
Liquidity and Capital Resources
Debt
On August 30, 2017, the Company entered into a credit agreement (the “Credit Agreement”) which provided for a revolving credit facility in an aggregate principal amount of $600.0 million (the “Revolving Facility”) and a term loan facility in an aggregate principal amount of $400.0 million (the “Term Loan Facility”) and together with the Revolving Facility, the “Facilities”. The Facilities mature on August 30, 2022. The loans under the Facilities, after giving effect to the Amendment described below, accrue interest at a per annum rate equal to, at the Company’s election, either a LIBOR rate plus a margin ranging from 125 to 250 basis points or a base rate (generally determined by a prime rate, federal funds rate or a LIBOR rate plus 1.00%) plus a margin ranging from 25 to 150 basis points. In each case, the actual margin is determined according to a ratio of the Company’s total indebtedness to earnings before interest, taxes, depreciation and amortization (“EBITDA”) for the then most recently ended four-quarter period (the “Leverage Ratio”). Quarterly amortization payments are required to be made on the Term Loan Facility in the amount of $5.0 million which began in the fourth quarter of 2017. Loans outstanding under the Credit Agreement may be prepaid at any time without premium or penalty, subject to customary breakage costs in the case of borrowings for which a LIBOR rate election is in effect. Up to $35.0 million of the Revolving Facility may be advanced in certain agreed foreign currencies, including Euros, Pounds Sterling, Canadian Dollars, Japanese Yen, and Mexican Pesos. The Credit Agreement contains customary affirmative and negative covenants, including financial covenants requiring the maintenance of the Leverage Ratio and a specified fixed charge coverage ratio.
On October 9, 2018, we entered into an amendment to the Credit Agreement (the “Amendment”). The amendments and modifications to the Credit Agreement are effective through the remainder of the term of the Facilities and include, without limitation, the following:
|
· |
reduction of the maximum amount available under the Revolving Facility to $400.0 million; there was no change in available Term Loan Facility borrowings; |
|
· |
amendment to the definition of EBITDA to exclude certain costs recorded as Special charges (up to certain pre-defined limits) as detailed in “Note 19” of the “Notes to Consolidated Financial Statements”; |
|
· |
modification of the financial covenants in the Credit Agreement by increasing the permitted Leverage Ratio to 5.25 to 1.0 beginning in the third quarter of 2018, decreasing over time to 4.00 to 1.0 by 2022; and decreasing the permitted specified fixed charge coverage ratio to 2.00 to 1.0 beginning in the third quarter of 2018 and increasing over time to 2.50 to 1.0 in 2021 and thereafter. We were in compliance with these financial covenants at December 30, 2018; |
52
|
· |
certain modifications to the negative covenant restricting the ability to make dividends and distributions. If the Leverage Ratio is above 3.75 to 1.0, the Company cannot repurchase any of its shares of common stock and cannot increase the cash dividend above the lesser of $0.225 per share per quarter or $35 million per fiscal year; |
|
· |
increase in the interest rate payable on outstanding loans for the Facilities based on the Leverage Ratio as follows: |
|
Ø |
removal of interest rate pricing tiers if the Leverage Ratio of the Company is less than 1.50 to 1.00; |
|
Ø |
if the Leverage Ratio of the Company is greater than 3.50 to 1.00 but less than 4.50 to 1.00, the Company will pay an additional 0.25% per annum interest rate margin on the outstanding loans under the Facilities and an additional 0.05% per annum commitment fee on the unused portion of the Revolving Facility; |
|
Ø |
if the Leverage Ratio of the Company is greater than 4.50 to 1.00, the Company will pay an additional 0.50% per annum interest rate margin on the outstanding loans under the Facilities and an additional 0.10% per annum commitment fee on the unused portion of the Revolving Facility; and |
|
· |
requirement that the Company and certain direct and indirect domestic subsidiaries of the Company grant a security interest in substantially all of the capital stock and equity interests of their respective domestic and first tier material foreign subsidiaries to secure the obligations owing under the Facilities. |
Under the Credit Agreement, as amended, we have the option to increase the Revolving Facility or the Term Loan Facility in an aggregate amount of up to $300.0 million, subject to the Leverage Ratio of the Company not exceeding 4.00 to 1.0.
Our outstanding debt of $625.0 million at December 30, 2018 under the Facilities was composed of $375.0 million outstanding under the Term Loan Facility and $250.0 million outstanding under the Revolving Facility. Including outstanding letters of credit, the Company’s remaining availability under the Facilities at December 30, 2018 was approximately $110.0 million.
As of December 30, 2018, the Company had approximately $3.9 million in unamortized debt issuance costs, which are being amortized into interest expense over the term of the Facilities. Upon execution of the Amendment, we wrote off approximately $560,000 of these unamortized debt issuance costs in accordance with applicable accounting guidance. The Company also incurred additional amendment fees of approximately $1.9 million, which will be amortized into interest expense over the remaining term of the Facilities.
We use interest rate swaps to hedge against the effects of potential interest rate increases on borrowings under our Facilities. As of December 30, 2018, we have the following interest rate swap agreements:
|
Effective Dates |
|
Floating Rate Debt |
|
Fixed Rates |
|
|
|
April 30, 2018 through April 30, 2023 |
|
$ |
55 million |
|
2.33 |
% |
|
April 30, 2018 through April 30, 2023 |
|
$ |
35 million |
|
2.36 |
% |
|
April 30, 2018 through April 30, 2023 |
|
$ |
35 million |
|
2.34 |
% |
|
January 30, 2018 through August 30, 2022 |
|
$ |
100 million |
|
1.99 |
% |
|
January 30, 2018 through August 30, 2022 |
|
$ |
75 million |
|
1.99 |
% |
|
January 30, 2018 through August 30, 2022 |
|
$ |
75 million |
|
2.00 |
% |
|
January 30, 2018 through August 30, 2022 |
|
$ |
25 million |
|
1.99 |
% |
Our Credit Agreement contains affirmative and negative covenants, including the following financial covenants, as defined by the Credit Agreement:
|
|
|
|
|
Actual Ratio for the |
|
|
|
|
|
Year Ended |
|
|
|
Permitted Ratio |
|
December 30, 2018 |
|
Leverage Ratio |
|
Not to exceed 5.25 to 1.0 |
|
4.7 to 1.0 |
|
|
|
|
|
|
|
Interest Coverage Ratio |
|
Not less than 2.0 to 1.0 |
|
2.8 to 1.0 |
As stated above, our leverage ratio is defined as outstanding debt divided by consolidated EBITDA for the most recent four fiscal quarters. Our interest coverage ratio is defined as the sum of consolidated EBITDA and consolidated rental expense for the most recent four fiscal quarters divided by the sum of consolidated interest expense and consolidated rental expense for the most recent four fiscal quarters. We were in compliance with all financial covenants as of December 30, 2018.
53
Cash Flows
Cash flow provided by operating activities was $72.8 million for 2018 as compared to $135.0 million in 2017. The decrease of approximately $62.2 million was primarily due to lower net income, somewhat offset by favorable changes in working capital items. The decrease in cash flow provided by operating activities in 2017 compared to 2016 was primarily due to lower net income.
The Company’s free cash flow for the last three years was as follows (in thousands):
|
|
|
Year Ended |
|
|||||||
|
|
|
Dec. 30, |
|
Dec. 31, |
|
Dec. 25, |
|
|||
|
|
|
2018 |
|
2017 |
|
2016 |
|
|||
|
|
|
|
|
|
|
|
|
|
|
|
|
Net cash provided by operating activities |
|
$ |
72,795 |
|
$ |
134,975 |
|
$ |
150,257 |
|
|
Purchases of property and equipment |
|
|
(42,028) |
|
|
(52,593) |
|
|
(55,554) |
|
|
Free cash flow (a) |
|
$ |
30,767 |
|
$ |
82,382 |
|
$ |
94,703 |
|
|
(a) |
Free cash flow, a non-GAAP measure, is defined as net cash provided by operating activities (from the Consolidated Statements of Cash Flows) less the purchases of property and equipment. We view free cash flow as an important liquidity measure because it is one factor that management uses in determining the amount of cash available for investment. However, it does not represent residual cash flows available for discretionary expenditures. Free cash flow is not a term defined by GAAP, and as a result, our measure of free cash flow might not be comparable to similarly titled measures used by other companies. Free cash flow should not be construed as a substitute for or a better indicator of our liquidity or performance than the Company’s GAAP measures. |
Cash flow used in investing activities was $38.8 million in 2018 as compared to $56.5 million for the same period in 2017. The decrease in cash flow used in investing activities was primarily due to lower capital spend as 2017 included construction costs for our commissary in Georgia, which opened in July of 2017. We also received $7.7 million in proceeds from the refranchising of our joint ventures in Denver and Minnesota in 2018.
We also use capital for share repurchases and the payment of cash dividends, which are funded by cash flow from operations and borrowings from our Credit Agreement. In 2018, we had net proceeds of $155.0 million from the issuance of long-term debt and used $158.0 million for share repurchases. In 2017, we had net proceeds of approximately $169.4 million from issuance of additional debt under the Credit Agreement and used $209.6 million for share repurchases.
Funding for our share repurchase program that expired on February 27, 2019, was provided through our credit facilities, operating cash flow, stock option exercises and cash and cash equivalents. For the year ended December 30, 2018, the Company purchased $158.0 million of stock comprising approximately 2.7 million shares. In connection with the execution of the Amendment to our Credit Agreement in October 2018, the Company cannot repurchase shares when our Leverage Ratio, as defined in the Credit Agreement, is higher than 3.75 to 1.0. As of December 30, 2018, our Leverage Ratio was 4.7 to 1.0.
The following is a summary of our common share repurchases for the last three years (in thousands, except average price per share):
|
|
|
Number of |
|
Dollar |
|
Average |
|
||
|
Fiscal |
|
Shares |
|
Amount |
|
Price Per |
|
||
|
Year |
|
Repurchased |
|
Repurchased |
|
Share |
|
||
|
2016 |
|
2,145 |
|
$ |
122,381 |
|
$ |
57.03 |
|
|
2017 |
|
2,960 |
|
$ |
209,586 |
|
$ |
70.80 |
|
|
2018 |
|
2,698 |
|
$ |
158,049 |
|
$ |
58.57 |
|
We paid cash dividends of $29.0 million in 2018 ($0.90 per share), $30.7 million in 2017 ($0.85 per share) and $27.9 million in 2016 ($0.75 per share). Subsequent to year end, our Board of Directors declared a first quarter 2019 dividend
54
of $0.225 per common share, or approximately $8.0 million, including the Series B Preferred Stock dividend on an as-converted basis to common stock. The dividend was paid on February 22, 2019 to shareholders of record as of the close of business on February 11, 2019. In connection with the execution of our amended Credit Facility in October 2018, no increase in dividends per share may occur when the Leverage Ratio, as defined, is higher than 3.75 to 1.0.
On February 3, 2019, the Company entered into the Securities Purchase Agreement with Starboard, pursuant to which the Company sold to Starboard 200,000 shares of Series B Preferred Stock at a purchase price of $1,000 per share, for an aggregate purchase price of $200,000,000. Starboard also has the option exercisable at their discretion, to purchase up to an additional 50,000 shares of Series B Preferred Stock on or prior to March 29, 2019 for the same price per share. The Series B Preferred Stock is convertible at the option of the holders at any time into shares of common stock based on the conversion rate determined by dividing $1,000, the stated value of the Series B Preferred Stock, by $50.06. The initial dividend rate of the Series B Preferred Stock will be 3.6% per annum on the stated value of $1,000 per share, payable quarterly in arrears. The Series B Preferred Stock will also participate on an as-converted basis in any regular or special dividends paid to common stockholders. The Series B Preferred Stock will be reported as temporary equity on the Company’s Consolidated Balance Sheet. In addition, the Company has the right to offer up to 10,000 shares of Series B Preferred Stock to qualified Papa John’s franchisees, subject to certain conditions, on the same terms as Starboard.
Contractual Obligations
Contractual obligations and payments as of December 30, 2018 due by year are as follows (in thousands):
|
|
|
Payments Due by Period |
|
|||||||||||||
|
|
|
Less than |
|
|
|
|
|
|
|
After 5 |
|
|
|
|
||
|
|
|
1 Year |
|
1-3 Years |
|
3-5 Years |
|
Years |
|
Total |
|
|||||
|
Contractual Obligations: |
|
|
|
|
|
|
|
|
|
|
|
|
|
|
|
|
|
Term Loan Facility (1) |
|
$ |
20,000 |
|
$ |
40,000 |
|
$ |
315,000 |
|
$ |
— |
|
$ |
375,000 |
|
|
Revolving Facility (1) |
|
|
— |
|
|
— |
|
|
250,000 |
|
|
— |
|
|
250,000 |
|
|
Interest payments (2) |
|
|
29,710 |
|
|
59,420 |
|
|
21,333 |
|
|
— |
|
|
110,463 |
|
|
Total debt |
|
|
49,710 |
|
|
99,420 |
|
|
586,333 |
|
|
— |
|
|
735,463 |
|
|
Operating leases (3) |
|
|
40,834 |
|
|
67,790 |
|
|
43,882 |
|
|
57,304 |
|
|
209,810 |
|
|
Total contractual obligations |
|
$ |
90,544 |
|
$ |
167,210 |
|
$ |
630,215 |
|
$ |
57,304 |
|
$ |
945,273 |
|
|
(1) |
We utilize interest rate swaps to hedge our variable rate debt. At December 30, 2018, we had an interest rate swap asset of $4.9 million recorded in other current and other long-term assets in the Consolidated Balance Sheet. |
|
(2) |
Interest payments assume an outstanding debt balance of $625.0 million. Interest payments are calculated based on LIBOR plus the applicable margin in effect at December 30, 2018, and considers the interest rate swap agreements in effect. The actual interest rates on our variable rate debt and the amount of our indebtedness could vary from those used to compute the above interest payments. See “Note 11” of “Notes to Consolidated Financial Statements” for additional information concerning our debt and credit arrangements. |
|
(3) |
See “Note 19” of “Notes to Consolidated Financial Statements” for additional information. The above amounts exclude future expected sub-lease income in the United Kingdom. |
The above table does not include the following:
|
· |
Unrecognized tax benefits of $2.0 million since we are not able to make reasonable estimates of the period of cash settlement with respect to the taxing authority. |
|
· |
Redeemable noncontrolling interests of $5.5 million as we are not able to predict the timing of the redemptions. |
Off-Balance Sheet Arrangements
The off-balance sheet arrangements that are reasonably likely to have a current or future effect on the Company’s financial condition are operating leases of Company-owned restaurant sites, QC Centers, office space and transportation equipment. Refer to “Note 2” to the “Consolidated Financial Statements” for additional information related to the anticipated impacts of adoption of new accounting standards affecting accounting for leases. We also guarantee leases for certain Papa John’s North American franchisees who have purchased restaurants that were previously Company-owned. We are contingently
55
liable on these leases. These leases have varying terms, the latest of which expires in 2025. As of December 30, 2018, the estimated maximum amount of undiscounted payments the Company could be required to make in the event of nonpayment by the primary lessees was approximately $11.9 million.
We have certain other commercial commitments where payment is contingent upon the occurrence of certain events. Such commitments include the following by year (in thousands):
|
|
|
Amount of Commitment Expiration Per Period |
|
|||||||||||||
|
|
|
Less than |
|
1-3 |
|
3-5 |
|
After |
|
|
|
|
||||
|
|
|
1 Year |
|
Years |
|
Years |
|
5 Years |
|
Total |
|
|||||
|
|
|
|
|
|
|
|
|
|
|
|
|
|
|
|
|
|
|
Other Commercial Commitments: |
|
|
|
|
|
|
|
|
|
|
|
|
|
|
|
|
|
|
|
|
|
|
|
|
|
|
|
|
|
|
|
|
|
|
|
Standby letters of credit |
|
$ |
39,945 |
|
$ |
— |
|
$ |
— |
|
$ |
— |
|
$ |
39,945 |
|
We are party to standby letters of credit with off-balance sheet risk associated with our insurance programs. See “Note 11” and “Note 19” of “Notes to Consolidated Financial Statements” for additional information related to contractual and other commitments.
Certain matters discussed in this Annual Report on Form 10-K and other Company communications constitute forward-looking statements within the meaning of the federal securities laws. Generally, the use of words such as “expect,” “intend,” “estimate,” “believe,” “anticipate,” “will,” “forecast,” “plan,” “project,” or similar words identify forward-looking statements that we intend to be included within the safe harbor protections provided by the federal securities laws. Such forward-looking statements may relate to projections or guidance concerning business performance, revenue, earnings, cash flow, earnings per share, contingent liabilities, resolution of litigation, commodity costs, currency fluctuations, profit margins, unit growth, unit level performance, capital expenditures, restaurant and franchise development, the strategic investment by Starboard and use of the proceeds, the ability of the Company to mitigate negative consumer sentiment through advertising, marketing and promotional activity, corporate governance, new Board leadership, future costs related to the Company’s response to the negative consumer sentiment, management reorganizations, compliance with debt covenants, shareholder and other stakeholder engagement, strategic decisions and actions, the cultural audit and investigation, share repurchases, dividends, effective tax rates, regulatory changes and impacts, the impact of the Tax Cuts and Jobs Act and the adoption of new accounting standards, and other financial and operational measures. Such statements are not guarantees of future performance and involve certain risks, uncertainties and assumptions, which are difficult to predict and many of which are beyond our control. Therefore, actual outcomes and results may differ materially from those matters expressed or implied in such forward-looking statements. The risks, uncertainties and assumptions that are involved in our forward-looking statements include, but are not limited to:
|
· |
negative publicity and consumer sentiment as a result of statements by the Company’s founder and former spokesperson, which may continue to cause sales to decline and/or change consumers’ acceptance of and enthusiasm for our brand; |
|
· |
costs the Company expects to continue to incur as a result of the recent negative publicity and negative consumer sentiment, including costs related to the external cultural audit and investigation, costs associated with the operations of the Special Committee, any costs associated with related litigation, legal fees, and increased costs for branding initiatives and launching a new advertising and marketing campaign and promotions to mitigate negative consumer sentiment and negative sales trends; |
|
· |
costs the Company expects to continue to incur relating to franchisee financial assistance to mitigate store closings; |
|
· |
the ability of the Company to mitigate the negative consumer sentiment through advertising, marketing and promotional activities; |
|
· |
the Company’s ability to regain lost customers and/or mitigate or reverse negative sales trends; |
|
· |
aggressive changes in pricing or other marketing or promotional strategies by competitors, which may adversely affect sales and profitability; and new product and concept developments by food industry competitors; |
56
|
· |
changes in consumer preferences or consumer buying habits, including the growing popularity of delivery aggregators, as well as changes in general economic conditions or other factors that may affect consumer confidence and discretionary spending; |
|
· |
the adverse impact on the Company or our results caused by product recalls, food quality or safety issues, incidences of foodborne illness, food contamination and other general public health concerns about our Company-owned or franchised restaurants or others in the restaurant industry; |
|
· |
the effectiveness of our initiatives to improve our brand proposition and operating results, including marketing, advertising and public relations initiatives, technology investments and changes in unit-level operations; |
|
· |
the risk that any new advertising or marketing campaign may not be effective in increasing sales; |
|
· |
the ability of the Company and its franchisees to meet planned growth targets and operate new and existing restaurants profitably, including difficulties finding qualified franchisees, store level employees or suitable sites; |
|
· |
increases in food costs or sustained higher other operating costs. This could include increased employee compensation, benefits, insurance, tax rates, new regulatory requirements or increasing compliance costs; |
|
· |
increases in insurance claims and related costs for programs funded by the Company up to certain retention limits, including medical, owned and non-owned vehicles, workers’ compensation, general liability and property; |
|
· |
disruption of our supply chain or commissary operations which could be caused by our sole source of supply of cheese or limited source of suppliers for other key ingredients or more generally due to weather, natural disasters including drought, disease, or geopolitical or other disruptions beyond our control; |
|
· |
increased risks associated with our international operations, including economic and political conditions, instability or uncertainty in our international markets, especially emerging markets, fluctuations in currency exchange rates, difficulty in meeting planned sales targets and new store growth; |
|
· |
the impact of the sale of Series B Preferred Stock to Starboard, which dilutes the economic and relative voting power of holders of our common stock and may adversely affect the market price of our common stock, affect our liquidity and financial condition, or delay or prevent an attempt to take over the Company; |
|
· |
Starboard’s ability to exercise influence over us, including through its ability to designate up to two members of our Board of Directors; |
|
· |
failure to raise the funds necessary to finance a required repurchase of our Series B Preferred Stock; |
|
· |
failure to realize the anticipated benefits from our investment of the proceeds of the Series B Preferred Stock in our strategic priorities; |
|
· |
the impact of current or future claims and litigation and our ability to comply with current, proposed or future legislation that could impact our business including compliance with the European Union General Data Protection Regulation; |
|
· |
maintaining compliance with amended debt covenants under our credit agreement if restaurant sales and operating results continue to decline; |
|
· |
the Company's ability to continue to pay dividends to shareholders based upon profitability, cash flows and capital adequacy if restaurant sales and operating results continue to decline; |
|
· |
failure to effectively execute succession planning; |
|
· |
disruption of critical business or information technology systems, or those of our suppliers, and risks associated with systems failures and data privacy and security breaches, including theft of confidential company, employee and customer information, including payment cards; |
|
· |
changes in Federal or state income, general and other tax laws, rules and regulations, including changes from the Tax Cuts and Jobs Act and any related Treasury regulations, rules or interpretations if and when issued; and |
|
· |
changes in generally accepted accounting principles including the new standard for leasing. |
These and other risk factors are discussed in detail in “Part I. Item 1A. — Risk Factors” of this Annual Report on Form 10-K. We undertake no obligation to update publicly any forward-looking statements, whether as a result of future events, new information or otherwise, except as required by law.
57
Item 7A. Quantitative and Qualitative Disclosures About Market Risk
Interest Rate Risk
On August 30, 2017, the Company entered into a credit agreement (the “Credit Agreement”) which provided for an unsecured revolving credit facility in an aggregate principal amount of $600.0 million (the “Revolving Facility”) and an unsecured term loan facility in an aggregate principal amount of $400.0 million (the “Term Loan Facility”) and together with the Revolving Facility, the “Facilities”. The Facilities mature on August 30, 2022. The loans under the Facilities, after giving effect to the Amendment described below, accrue interest at a per annum rate equal to, at the Company’s election, either a LIBOR rate plus a margin ranging from 125 to 250 basis points or a base rate (generally determined by a prime rate, federal funds rate or a LIBOR rate plus 1.00%) plus a margin ranging from 25 to 150 basis points. In each case, the actual margin is determined according to a ratio of the Company’s total indebtedness to earnings before interest, taxes, depreciation and amortization (“EBITDA”) for the then most recently ended four-quarter period (the “Leverage Ratio”). Quarterly amortization payments are required to be made on the Term Loan Facility in the amount of $5.0 million which began in the fourth quarter of 2017. Loans outstanding under the Credit Agreement may be prepaid at any time without premium or penalty, subject to customary breakage costs in the case of borrowings for which a LIBOR rate election is in effect. Up to $35.0 million of the Revolving Facility may be advanced in certain agreed foreign currencies, including Euros, Pounds Sterling, Canadian Dollars, Japanese Yen, and Mexican Pesos. The Credit Agreement contains customary affirmative and negative covenants, including financial covenants requiring the maintenance of the Leverage Ratio and a specified fixed charge coverage ratio.
On October 9, 2018, we entered into an amendment to the Credit Agreement (the “Amendment”). The amendments and modifications to the Credit Agreement are effective through the remainder of the term of the Facilities and include, without limitation, the following:
|
· |
reduction of the maximum amount available under the Revolving Facility to $400.0 million; there was no change in available Term Loan Facility borrowings; |
|
· |
amendment to the definition of EBITDA to exclude certain costs recorded as Special charges (up to certain pre-defined limits) as detailed in Note 19 “Commitments and Contingencies”; |
|
· |
modification of the financial covenants in the Credit Agreement by increasing the permitted Leverage Ratio to 5.25 to 1.0 beginning in the third quarter of 2018, decreasing over time to 4.00 to 1.0 by 2022; and decreasing the permitted specified fixed charge coverage ratio to 2.00 to 1.0 beginning in the third quarter of 2018 and increasing over time to 2.50 to 1.0 in 2021 and thereafter. We were in compliance with these financial covenants at December 30, 2018; |
|
· |
certain modifications to the negative covenant restricting the ability to make dividends and distributions. If the Leverage Ratio is above 3.75 to 1.0, the Company cannot repurchase any of its shares of common stock and cannot increase the cash dividend above the lesser of $0.225 per share per quarter or $35 million per fiscal year; |
|
· |
increase in the interest rate payable on outstanding loans for the Facilities based on the Leverage Ratio as follows: |
|
Ø |
removal of interest rate pricing tiers if the Leverage Ratio of the Company is less than 1.50 to 1.00; |
|
Ø |
if the Leverage Ratio of the Company is greater than 3.50 to 1.00 but less than 4.50 to 1.00, the Company will pay an additional 0.25% per annum interest rate margin on the outstanding loans under the Facilities and an additional 0.05% per annum commitment fee on the unused portion of the Revolving Facility; |
|
Ø |
if the Leverage Ratio of the Company is greater than 4.50 to 1.00, the Company will pay an additional 0.50% per annum interest rate margin on the outstanding loans under the Facilities and an additional 0.10% per annum commitment fee on the unused portion of the Revolving Facility; and |
|
· |
requirement that the Company and certain direct and indirect domestic subsidiaries of the Company grant a security interest in substantially all of the capital stock and equity interests of their respective domestic and first tier material foreign subsidiaries to secure the obligations owing under the Facilities. |
Under the Credit Agreement, we have the option to increase the Revolving Facility or the Term Loan Facility in an aggregate amount of up to $300.0 million, subject to the Leverage Ratio of the Company not exceeding 4.00 to 1.00.
Our outstanding debt of $625.0 million at December 30, 2018 under the Facilities was composed of $375.0 million outstanding under the Term Loan Facility and $250.0 million outstanding under the Revolving Facility. Including
58
outstanding letters of credit, the Company’s remaining availability under the Facilities at December 30, 2018 was approximately $110.0 million.
As of December 30, 2018, the Company had approximately $3.9 million in unamortized debt issuance costs, which are being amortized into interest expense over the term of the Facilities. Upon execution of the Amendment, we wrote off approximately $560,000 of these unamortized debt issuance costs in accordance with applicable accounting guidance. The Company also incurred additional amendment fees of approximately $1.9 million, which will be amortized into interest expense over the remaining term of the Facilities.
We attempt to minimize interest risk exposure by fixing our rate through the utilization of interest rate swaps, which are derivative financial instruments. Our swaps are entered into with financial institutions that participate in the Facilities. By using a derivative instrument to hedge exposures to changes in interest rates, we expose ourselves to credit risk. Credit risk is due to the possible failure of the counterparty to perform under the terms of the derivative contract.
We use interest rate swaps to hedge against the effects of potential interest rate increases on borrowings under our Facilities. As of December 30, 2018, we have the following interest rate swap agreements:
|
Effective Dates |
|
Floating Rate Debt |
|
Fixed Rates |
|
|
|
April 30, 2018 through April 30, 2023 |
|
$ |
55 million |
|
2.33 |
% |
|
April 30, 2018 through April 30, 2023 |
|
$ |
35 million |
|
2.36 |
% |
|
April 30, 2018 through April 30, 2023 |
|
$ |
35 million |
|
2.34 |
% |
|
January 30, 2018 through August 30, 2022 |
|
$ |
100 million |
|
1.99 |
% |
|
January 30, 2018 through August 30, 2022 |
|
$ |
75 million |
|
1.99 |
% |
|
January 30, 2018 through August 30, 2022 |
|
$ |
75 million |
|
2.00 |
% |
|
January 30, 2018 through August 30, 2022 |
|
$ |
25 million |
|
1.99 |
% |
The weighted average interest rates on our debt, including the impact of the interest rate swap agreements, were 3.9% for the year ended December 30, 2018. An increase in the present interest rate of 100 basis points on the line of credit balance outstanding as of December 30, 2018 would increase annual interest expense by $2.3 million.
In July 2017, the Financial Conduct Authority (the authority that regulates LIBOR) announced it intends to stop compelling banks to submit rates for the calculation of LIBOR after 2021. The Alternative Reference Rates Committee ("ARRC") has proposed that the Secured Overnight Financing Rate ("SOFR") is the rate that represents best practice as the alternative to LIBOR for use in derivatives and other financial contracts that are currently indexed to LIBOR. ARRC has proposed a paced market transition plan to SOFR from LIBOR and organizations are currently working on industry wide and company specific transition plans as it relates to derivatives and cash markets exposed to LIBOR. The Company has material contracts that are indexed to LIBOR and is monitoring this activity and evaluating the related risks. Refer to “Recent Accounting Pronouncements” in “Note 2” of “Notes to Consolidated Financial Statements” for additional information.
Foreign Currency Exchange Rate Risk
We are exposed to foreign currency exchange rate fluctuations from our operations outside of the United States, which can adversely impact our revenues, net (loss) income and cash flows. Our international operations principally consist of distribution sales to franchised Papa John’s restaurants located in the United Kingdom and our franchise sales and support activities, which derive revenues from sales of franchise and development rights and the collection of royalties from our international franchisees. Approximately 8.3% of our 2018 revenues, 7.1% of our 2017 revenues and 6.6% of our revenues for 2016 were derived from these operations.
We have not historically hedged our exposure to foreign currency fluctuations. Foreign currency exchange rate fluctuations had a favorable impact of approximately $3.3 million in 2018 compared to an unfavorable impact of $4.1 million in 2017. Foreign currency exchange rates did not have a significant impact on our income before income taxes in 2018 and had a favorable impact of $1.0 million for 2017. An additional 10% adverse change in the foreign currency rates for our international markets would result in an additional negative impact on annual revenue and income before income taxes of $10.2 million and $2.1 million, respectively.
59
The outcome of the June 2016 referendum in the United Kingdom was a vote for the United Kingdom to cease to be a member of the European Union (known as “Brexit”). Among other things, this has resulted in a lower valuation, on a historical basis, of the British Pound in comparison to the US Dollar. The future impact of Brexit on our United Kingdom Quality Control Center (“QCC”) and franchise operations included in the European Union could also include but may not be limited to additional currency volatility, supply chain risks specifically with United Kingdom QCC exports to countries within the European Union, and future trade, tariff, and regulatory changes. As of December 30, 2018, 30.1% of our total international restaurants are in countries within the European Union.
Commodity Price Risk
In the ordinary course of business, the food and paper products we purchase, including cheese (our largest ingredient cost), are subject to seasonal fluctuations, weather, availability, demand and other factors that are beyond our control. We have pricing agreements with some of our vendors, including forward pricing agreements for a portion of our cheese purchases for our domestic Company-owned restaurants, which are accounted for as normal purchases; however, we still remain exposed to on-going commodity volatility.
The following table presents the actual average block price for cheese by quarter in 2018, 2017 and 2016. Also presented is the projected 2019 average block price by quarter (based on the March 4, 2019 Chicago Mercantile Exchange cheese futures prices for 2019:
|
|
|
2019 |
|
2018 |
|
2017 |
|
2016 |
|
||||
|
|
|
Projected |
|
Block |
|
Block |
|
Block |
|
||||
|
|
|
Market |
|
Price |
|
Price |
|
Price |
|
||||
|
|
|
|
|
|
|
|
|
|
|
|
|
|
|
|
Quarter 1 |
|
$ |
1.431 |
|
$ |
1.522 |
|
$ |
1.613 |
|
$ |
1.473 |
|
|
Quarter 2 |
|
|
1.598 |
|
|
1.607 |
|
|
1.566 |
|
|
1.405 |
|
|
Quarter 3 |
|
|
1.678 |
|
|
1.592 |
|
|
1.642 |
|
|
1.691 |
|
|
Quarter 4 |
|
|
1.669 |
|
|
1.487 |
|
|
1.639 |
|
|
1.718 |
|
|
Full Year |
|
$ |
1.594 |
|
$ |
1.552 |
|
$ |
1.615 |
|
$ |
1.572 |
|
60
Item 8. Financial Statements and Supplementary Data
Report of Independent Registered Public Accounting Firm
To the Stockholders and Board of Directors
Papa John’s International, Inc.:
Opinions on the Consolidated Financial Statements and Internal Control Over Financial Reporting
We have audited the accompanying consolidated balance sheet of Papa John’s International, Inc. and subsidiaries (the “Company”) as of December 30, 2018, the related consolidated statements of operations, comprehensive income, stockholders’ (deficit), and cash flows for the year ended December 30, 2018, and the related notes and financial statement Schedule II (collectively, the “consolidated financial statements”). We also have audited the Company’s internal control over financial reporting as of December 30, 2018, based on criteria established in Internal Control – Integrated Framework (2013) issued by the Committee of Sponsoring Organizations of the Treadway Commission.
In our opinion, the consolidated financial statements referred to above present fairly, in all material respects, the financial position of the Company as of December 30, 2018, and the results of its operations and its cash flows for the year ended December 30, 2018, in conformity with U.S. generally accepted accounting principles. Also in our opinion, the Company maintained, in all material respects, effective internal control over financial reporting as of December 30, 2018 based on criteria established in Internal Control – Integrated Framework (2013) issued by the Committee of Sponsoring Organizations of the Treadway Commission.
Change in Accounting Principle
As discussed in Note 2 to the consolidated financial statements, the Company has changed its method of accounting for revenue from contracts with customers in 2018 due to the adoption of the new revenue standard.
Basis for Opinions
The Company’s management is responsible for these consolidated financial statements, for maintaining effective internal control over financial reporting, and for its assessment of the effectiveness of internal control over financial reporting, included in the accompanying Item 9A, “Management’s Report on Internal Control over Financial Reporting.” Our responsibility is to express an opinion on the Company’s consolidated financial statements and an opinion on the Company’s internal control over financial reporting based on our audits. We are a public accounting firm registered with the Public Company Accounting Oversight Board (United States) (PCAOB) and are required to be independent with respect to the Company in accordance with the U.S. federal securities laws and the applicable rules and regulations of the Securities and Exchange Commission and the PCAOB.
We conducted our audits in accordance with the standards of the PCAOB. Those standards require that we plan and perform the audits to obtain reasonable assurance about whether the consolidated financial statements are free of material misstatement, whether due to error or fraud, and whether effective internal control over financial reporting was maintained in all material respects.
Our audit of the consolidated financial statements included performing procedures to assess the risks of material misstatement of the consolidated financial statements, whether due to error or fraud, and performing procedures that respond to those risks. Such procedures included examining, on a test basis, evidence regarding the amounts and disclosures in the consolidated financial statements. Our audit also included evaluating the accounting principles used and significant estimates made by management, as well as evaluating the overall presentation of the consolidated financial statements. Our audit of internal control over financial reporting included obtaining an understanding of internal control over financial reporting, assessing the risk that a material weakness exists, and testing and evaluating the design and operating effectiveness of internal control based on the assessed risk. Our audit also included performing such other procedures as we considered necessary in the circumstances. We believe that our audit provides a reasonable basis for our opinion.
61
Definition and Limitations of Internal Control Over Financial Reporting
A company’s internal control over financial reporting is a process designed to provide reasonable assurance regarding the reliability of financial reporting and the preparation of financial statements for external purposes in accordance with generally accepted accounting principles. A company’s internal control over financial reporting includes those policies and procedures that (1) pertain to the maintenance of records that, in reasonable detail, accurately and fairly reflect the transactions and dispositions of the assets of the company; (2) provide reasonable assurance that transactions are recorded as necessary to permit preparation of financial statements in accordance with generally accepted accounting principles, and that receipts and expenditures of the company are being made only in accordance with authorizations of management and directors of the company; and (3) provide reasonable assurance regarding prevention or timely detection of unauthorized acquisition, use, or disposition of the company’s assets that could have a material effect on the financial statements.
Because of its inherent limitations, internal control over financial reporting may not prevent or detect misstatements. Also, projections of any evaluation of effectiveness to future periods are subject to the risk that controls may become inadequate because of changes in conditions, or that the degree of compliance with the policies or procedures may deteriorate.
/s/ KPMG LLP
We have served as the Company’s auditor since 2018.
Louisville, Kentucky
March 8, 2019
62
Report of Independent Registered Public Accounting Firm
To the Stockholders and the Board of Directors of Papa John’s International, Inc. and Subsidiaries
Opinion on the Financial Statements
We have audited the accompanying consolidated balance sheets of Papa John’s International, Inc. and Subsidiaries (the Company) as of December 31, 2017 and December 25, 2016, the related consolidated statements of income, comprehensive income, stockholders' equity (deficit) and cash flows for each of the two years in the period ended December 31, 2017, and the related notes and financial statement schedule for each of the two years in the period ended December 31, 2017 listed in the Index at Item 15(a) (collectively referred to as the “consolidated financial statements”). In our opinion, the consolidated financial statements present fairly, in all material respects, the consolidated financial position of the Company at December 31, 2017 and December 25, 2016, and the consolidated results of its operations and its cash flows for each of the two years in the period ended December 31, 2017, in conformity with U.S. generally accepted accounting principles.
Basis for Opinion
These financial statements are the responsibility of the Company's management. Our responsibility is to express an opinion on the Company’s financial statements based on our audits. We are a public accounting firm registered with the PCAOB and are required to be independent with respect to the Company in accordance with the U.S. federal securities laws and the applicable rules and regulations of the Securities and Exchange Commission and the PCAOB. We conducted our audits in accordance with the standards of the PCAOB. Those standards require that we plan and perform the audit to obtain reasonable assurance about whether the financial statements are free of material misstatement, whether due to error or fraud. Our audits included performing procedures to assess the risks of material misstatement of the financial statements, whether due to error or fraud, and performing procedures that respond to those risks. Such procedures included examining, on a test basis, evidence regarding the amounts and disclosures in the financial statements. Our audits also included evaluating the accounting principles used and significant estimates made by management, as well as evaluating the overall presentation of the financial statements. We believe that our audits provide a reasonable basis for our opinion.
/s/ Ernst & Young LLP
We served as the Company’s auditors from 1990 to 2018.
Louisville, Kentucky
February 27, 2018, except for Notes 16 and 24,
as to which the date is March 8, 2019
63
Papa John’s International, Inc. and Subsidiaries
Consolidated Statements of Operations
|
|
|
Year ended |
|
|||||||
|
|
|
December 30, |
|
December 31, |
|
December 25, |
|
|||
|
(In thousands, except per share amounts) |
|
2018 |
|
2017 |
|
2016 |
|
|||
|
Revenues: |
|
|
|
|
|
|
|
|
|
|
|
Domestic Company-owned restaurant sales |
|
$ |
692,380 |
|
$ |
816,718 |
|
$ |
815,931 |
|
|
North America franchise royalties and fees |
|
|
79,293 |
|
|
106,729 |
|
|
102,980 |
|
|
North America commissary |
|
|
609,866 |
|
|
673,712 |
|
|
623,883 |
|
|
International |
|
|
110,349 |
|
|
114,021 |
|
|
100,904 |
|
|
Other revenues |
|
|
81,428 |
|
|
72,179 |
|
|
69,922 |
|
|
Total revenues |
|
|
1,573,316 |
|
|
1,783,359 |
|
|
1,713,620 |
|
|
Costs and expenses: |
|
|
|
|
|
|
|
|
|
|
|
Operating costs (excluding depreciation and amortization shown separately below): |
|
|
|
|
|
|
|
|
|
|
|
Domestic Company-owned restaurant expenses |
|
|
576,799 |
|
|
664,640 |
|
|
651,536 |
|
|
North America commissary |
|
|
575,103 |
|
|
631,537 |
|
|
579,834 |
|
|
International expenses |
|
|
67,775 |
|
|
70,622 |
|
|
62,574 |
|
|
Other expenses |
|
|
84,016 |
|
|
69,335 |
|
|
66,253 |
|
|
General and administrative expenses |
|
|
192,551 |
|
|
150,866 |
|
|
158,135 |
|
|
Depreciation and amortization |
|
|
46,403 |
|
|
43,668 |
|
|
40,987 |
|
|
Total costs and expenses |
|
|
1,542,647 |
|
|
1,630,668 |
|
|
1,559,319 |
|
|
Refranchising and impairment gains/(losses), net |
|
|
(289) |
|
|
(1,674) |
|
|
10,222 |
|
|
Operating income |
|
|
30,380 |
|
|
151,017 |
|
|
164,523 |
|
|
Legal settlement |
|
|
— |
|
|
— |
|
|
898 |
|
|
Investment income |
|
|
817 |
|
|
608 |
|
|
785 |
|
|
Interest expense |
|
|
(25,306) |
|
|
(11,283) |
|
|
(7,397) |
|
|
Income before income taxes |
|
|
5,891 |
|
|
140,342 |
|
|
158,809 |
|
|
Income tax expense |
|
|
2,646 |
|
|
33,817 |
|
|
49,717 |
|
|
Net income before attribution to noncontrolling interests |
|
|
3,245 |
|
|
106,525 |
|
|
109,092 |
|
|
Income attributable to noncontrolling interests |
|
|
(1,599) |
|
|
(4,233) |
|
|
(6,272) |
|
|
Net income attributable to the Company |
|
$ |
1,646 |
|
$ |
102,292 |
|
$ |
102,820 |
|
|
|
|
|
|
|
|
|
|
|
|
|
|
Calculation of income for earnings per share: |
|
|
|
|
|
|
|
|
|
|
|
Net income attributable to the Company |
|
$ |
1,646 |
|
$ |
102,292 |
|
$ |
102,820 |
|
|
Change in noncontrolling interest redemption value |
|
|
— |
|
|
1,419 |
|
|
567 |
|
|
Net income attributable to participating securities |
|
|
— |
|
|
(423) |
|
|
(420) |
|
|
Net income attributable to common shareholders |
|
$ |
1,646 |
|
$ |
103,288 |
|
$ |
102,967 |
|
|
|
|
|
|
|
|
|
|
|
|
|
|
Basic earnings per common share |
|
$ |
0.05 |
|
$ |
2.86 |
|
$ |
2.76 |
|
|
Diluted earnings per common share |
|
$ |
0.05 |
|
$ |
2.83 |
|
$ |
2.74 |
|
|
|
|
|
|
|
|
|
|
|
|
|
|
Basic weighted average common shares outstanding |
|
|
32,083 |
|
|
36,083 |
|
|
37,253 |
|
|
Diluted weighted average common shares outstanding |
|
|
32,299 |
|
|
36,522 |
|
|
37,608 |
|
|
|
|
|
|
|
|
|
|
|
|
|
|
Dividends declared per common share |
|
$ |
0.90 |
|
$ |
0.85 |
|
$ |
0.75 |
|
See accompanying notes.
64
Papa John’s International, Inc. and Subsidiaries
Consolidated Statements of Comprehensive Income
|
|
|
Year ended |
|
|||||||
|
|
|
December 30, |
|
December 31, |
|
December 25, |
|
|||
|
(In thousands) |
|
2018 |
|
2017 |
|
2016 |
|
|||
|
|
|
|
|
|
|
|
|
|
|
|
|
Net income before attribution to noncontrolling interests |
|
$ |
3,245 |
|
$ |
106,525 |
|
$ |
109,092 |
|
|
Other comprehensive (loss) income, before tax: |
|
|
|
|
|
|
|
|
|
|
|
Foreign currency translation adjustments (1) |
|
|
(4,903) |
|
|
4,570 |
|
|
(7,922) |
|
|
Interest rate swaps (2) |
|
|
4,254 |
|
|
1,421 |
|
|
1,492 |
|
|
Other comprehensive (loss) income, before tax |
|
|
(649) |
|
|
5,991 |
|
|
(6,430) |
|
|
Income tax effect: |
|
|
|
|
|
|
|
|
|
|
|
Foreign currency translation adjustments (1) |
|
|
1,110 |
|
|
(1,691) |
|
|
2,931 |
|
|
Interest rate swaps (3) |
|
|
(1,032) |
|
|
(530) |
|
|
(552) |
|
|
Income tax effect (4) |
|
|
78 |
|
|
(2,221) |
|
|
2,379 |
|
|
Other comprehensive (loss) income, net of tax |
|
|
(571) |
|
|
3,770 |
|
|
(4,051) |
|
|
Comprehensive income before attribution to noncontrolling interests |
|
|
2,674 |
|
|
110,295 |
|
|
105,041 |
|
|
Less: comprehensive loss (income), redeemable noncontrolling interests |
|
|
488 |
|
|
(2,195) |
|
|
(3,665) |
|
|
Less: comprehensive income, nonredeemable noncontrolling interests |
|
|
(2,087) |
|
|
(2,038) |
|
|
(2,607) |
|
|
Comprehensive income attributable to the Company |
|
$ |
1,075 |
|
$ |
106,062 |
|
$ |
98,769 |
|
|
(1) |
On June 15, 2018, the Company refranchised 34 Company-owned restaurants and a quality control center located in China. In conjunction with the transaction, approximately $1,300 of accumulated other comprehensive income and $300 associated deferred tax related to foreign currency translation were reversed. See “Note 9” of “Notes to Consolidated Financial Statements” for additional information. |
|
(2) |
Amounts reclassified out of accumulated other comprehensive income (loss) into net interest expense included $22, $421 and $1,161 for the years ended December 30, 2018, December 31, 2017 and December 25, 2016, respectively. |
|
(3) |
The income tax effects of amounts reclassified out of accumulated other comprehensive income (loss) were $5, $156 and $429 for the years ended December 30, 2018, December 31, 2017 and December 25, 2016, respectively. |
|
(4) |
As of January 1, 2018, we adopted ASU 2018-02, “Reclassification of Certain Tax Effects from Accumulated Other Comprehensive Income,” and reclassified stranded tax effects of approximately $455 to retained earnings in the first quarter of 2018. See “Note 2” of “Notes to Consolidated Financial Statements” for additional information. |
See accompanying notes.
65
Papa John’s International, Inc. and Subsidiaries
Consolidated Balance Sheets
|
|
|
December 30, |
|
December 31, |
||
|
(In thousands, except per share amounts) |
|
2018 |
|
2017 |
||
|
Assets |
|
|
|
|
|
|
|
Current assets: |
|
|
|
|
|
|
|
Cash and cash equivalents |
|
$ |
19,468 |
|
$ |
22,345 |
|
Accounts receivable (less allowance for doubtful accounts of $2,117 in 2018 and $2,271 in 2017) |
|
|
67,785 |
|
|
64,558 |
|
Accounts receivable - affiliates (no allowance for doubtful accounts in 2018 and 2017) |
|
|
69 |
|
|
86 |
|
Notes receivable (no allowance for doubtful accounts in 2018 and 2017) |
|
|
5,498 |
|
|
4,333 |
|
Income tax receivable |
|
|
16,073 |
|
|
3,903 |
|
Inventories |
|
|
27,203 |
|
|
30,620 |
|
Prepaid expenses |
|
|
29,935 |
|
|
28,522 |
|
Other current assets |
|
|
5,677 |
|
|
9,494 |
|
Assets held for sale |
|
|
— |
|
|
6,133 |
|
Total current assets |
|
|
171,708 |
|
|
169,994 |
|
Property and equipment, net |
|
|
226,894 |
|
|
234,331 |
|
Notes receivable, less current portion (less allowance for doubtful accounts of $3,369 in 2018 |
|
|
|
|
|
|
|
and $1,047 in 2017) |
|
|
23,259 |
|
|
15,568 |
|
Goodwill |
|
|
84,516 |
|
|
86,892 |
|
Deferred income taxes, net |
|
|
756 |
|
|
585 |
|
Other assets |
|
|
63,814 |
|
|
48,183 |
|
Total assets |
|
$ |
570,947 |
|
$ |
555,553 |
|
|
|
|
|
|
|
|
|
Liabilities and stockholders’ (deficit) |
|
|
|
|
|
|
|
Current liabilities: |
|
|
|
|
|
|
|
Accounts payable |
|
$ |
29,891 |
|
$ |
32,006 |
|
Income and other taxes payable |
|
|
6,590 |
|
|
10,561 |
|
Accrued expenses and other current liabilities |
|
|
105,712 |
|
|
70,293 |
|
Deferred revenue current |
|
|
2,443 |
|
|
— |
|
Current portion of long-term debt |
|
|
20,000 |
|
|
20,000 |
|
Total current liabilities |
|
|
164,636 |
|
|
132,860 |
|
Deferred revenue |
|
|
14,679 |
|
|
2,652 |
|
Long-term debt, less current portion, net |
|
|
601,126 |
|
|
446,565 |
|
Deferred income taxes, net |
|
|
7,852 |
|
|
12,546 |
|
Other long-term liabilities |
|
|
79,324 |
|
|
60,146 |
|
Total liabilities |
|
|
867,617 |
|
|
654,769 |
|
|
|
|
|
|
|
|
|
Redeemable noncontrolling interests |
|
|
5,464 |
|
|
6,738 |
|
|
|
|
|
|
|
|
|
Stockholders’ (deficit): |
|
|
|
|
|
|
|
Preferred stock ($0.01 par value per share; no shares issued) |
|
|
— |
|
|
— |
|
Common stock ($0.01 par value per share; issued 44,301 at December 30, 2018 and 44,221 |
|
|
|
|
|
|
|
at December 31, 2017) |
|
|
443 |
|
|
442 |
|
Additional paid-in capital |
|
|
192,984 |
|
|
184,785 |
|
Accumulated other comprehensive (loss) |
|
|
(3,143) |
|
|
(2,117) |
|
Retained earnings |
|
|
244,061 |
|
|
292,251 |
|
Treasury stock (12,929 shares at December 30, 2018 and 10,290 shares at |
|
|
|
|
|
|
|
December 31, 2017, at cost) |
|
|
(751,704) |
|
|
(597,072) |
|
Total stockholders’ (deficit) |
|
|
(317,359) |
|
|
(121,711) |
|
Noncontrolling interests in subsidiaries |
|
|
15,225 |
|
|
15,757 |
|
Total stockholders’ (deficit) |
|
|
(302,134) |
|
|
(105,954) |
|
Total liabilities, redeemable noncontrolling interests and stockholders’ (deficit) |
|
$ |
570,947 |
|
$ |
555,553 |
See accompanying notes.
66
Papa John’s International, Inc. and Subsidiaries
Consolidated Statements of Stockholders’ Equity (Deficit)
|
|
|
Papa John’s International, Inc. |
|
|
|
|
|
|
|
|||||||||||||||
|
|
|
Common |
|
|
|
|
|
|
|
Accumulated |
|
|
|
|
|
|
|
|
|
|
|
|
|
|
|
|
|
Stock |
|
|
|
|
Additional |
|
Other |
|
|
|
|
|
|
|
Noncontrolling |
|
Total |
|
||||
|
|
|
Shares |
|
Common |
|
Paid-In |
|
Comprehensive |
|
Retained |
|
Treasury |
|
Interests in |
|
Stockholders’ |
|
|||||||
|
(In thousands) |
|
Outstanding |
|
Stock |
|
Capital |
|
Income (Loss) |
|
Earnings |
|
Stock |
|
Subsidiaries |
|
Equity (Deficit) |
|
|||||||
|
Balance at December 27, 2015 |
|
38,423 |
|
$ |
437 |
|
$ |
158,348 |
|
$ |
(1,836) |
|
$ |
143,789 |
|
$ |
(271,557) |
|
$ |
13,025 |
|
$ |
42,206 |
|
|
Net income (1) |
|
— |
|
|
— |
|
|
— |
|
|
— |
|
|
102,820 |
|
|
— |
|
|
2,607 |
|
|
105,427 |
|
|
Other comprehensive loss |
|
— |
|
|
— |
|
|
— |
|
|
(4,051) |
|
|
— |
|
|
— |
|
|
— |
|
|
(4,051) |
|
|
Cash dividends paid |
|
— |
|
|
— |
|
|
119 |
|
|
— |
|
|
(27,898) |
|
|
— |
|
|
— |
|
|
(27,779) |
|
|
Exercise of stock options |
|
334 |
|
|
3 |
|
|
7,056 |
|
|
— |
|
|
— |
|
|
— |
|
|
— |
|
|
7,059 |
|
|
Tax effect of equity awards |
|
— |
|
|
— |
|
|
(7) |
|
|
— |
|
|
— |
|
|
— |
|
|
— |
|
|
(7) |
|
|
Acquisition of Company common stock |
|
(2,145) |
|
|
— |
|
|
— |
|
|
— |
|
|
— |
|
|
(122,381) |
|
|
— |
|
|
(122,381) |
|
|
Stock-based compensation expense |
|
— |
|
|
— |
|
|
10,123 |
|
|
— |
|
|
— |
|
|
— |
|
|
— |
|
|
10,123 |
|
|
Issuance of restricted stock |
|
58 |
|
|
1 |
|
|
(2,975) |
|
|
— |
|
|
— |
|
|
2,974 |
|
|
— |
|
|
— |
|
|
Change in redemption value of noncontrolling interests |
|
— |
|
|
— |
|
|
— |
|
|
— |
|
|
567 |
|
|
— |
|
|
— |
|
|
567 |
|
|
Contributions from noncontrolling interests |
|
— |
|
|
— |
|
|
— |
|
|
— |
|
|
— |
|
|
— |
|
|
690 |
|
|
690 |
|
|
Distributions to noncontrolling interests |
|
— |
|
|
— |
|
|
— |
|
|
— |
|
|
— |
|
|
— |
|
|
(2,610) |
|
|
(2,610) |
|
|
Other |
|
13 |
|
|
— |
|
|
(91) |
|
|
— |
|
|
— |
|
|
648 |
|
|
— |
|
|
557 |
|
|
Balance at December 25, 2016 |
|
36,683 |
|
|
441 |
|
|
172,573 |
|
|
(5,887) |
|
|
219,278 |
|
|
(390,316) |
|
|
13,712 |
|
|
9,801 |
|
|
Net income (1) |
|
— |
|
|
— |
|
|
— |
|
|
— |
|
|
102,292 |
|
|
— |
|
|
2,038 |
|
|
104,330 |
|
|
Other comprehensive income |
|
— |
|
|
— |
|
|
— |
|
|
3,770 |
|
|
— |
|
|
— |
|
|
— |
|
|
3,770 |
|
|
Cash dividends paid |
|
— |
|
|
— |
|
|
136 |
|
|
— |
|
|
(30,728) |
|
|
— |
|
|
— |
|
|
(30,592) |
|
|
Exercise of stock options |
|
147 |
|
|
1 |
|
|
6,259 |
|
|
— |
|
|
— |
|
|
— |
|
|
— |
|
|
6,260 |
|
|
Tax effect of equity awards |
|
— |
|
|
— |
|
|
(2,428) |
|
|
— |
|
|
— |
|
|
— |
|
|
— |
|
|
(2,428) |
|
|
Acquisition of Company common stock |
|
(2,960) |
|
|
— |
|
|
— |
|
|
— |
|
|
— |
|
|
(209,586) |
|
|
— |
|
|
(209,586) |
|
|
Stock-based compensation expense |
|
— |
|
|
— |
|
|
10,413 |
|
|
— |
|
|
— |
|
|
— |
|
|
— |
|
|
10,413 |
|
|
Issuance of restricted stock |
|
54 |
|
|
— |
|
|
(2,427) |
|
|
— |
|
|
— |
|
|
2,427 |
|
|
— |
|
|
— |
|
|
Change in redemption value of noncontrolling interests |
|
— |
|
|
— |
|
|
— |
|
|
— |
|
|
1,419 |
|
|
— |
|
|
— |
|
|
1,419 |
|
|
Contributions from noncontrolling interests |
|
— |
|
|
— |
|
|
— |
|
|
— |
|
|
— |
|
|
— |
|
|
2,956 |
|
|
2,956 |
|
|
Distributions to noncontrolling interests |
|
— |
|
|
— |
|
|
— |
|
|
— |
|
|
— |
|
|
— |
|
|
(2,949) |
|
|
(2,949) |
|
|
Other |
|
7 |
|
|
— |
|
|
259 |
|
|
— |
|
|
(10) |
|
|
403 |
|
|
— |
|
|
652 |
|
|
Balance at December 31, 2017 |
|
33,931 |
|
$ |
442 |
|
$ |
184,785 |
|
$ |
(2,117) |
|
$ |
292,251 |
|
$ |
(597,072) |
|
$ |
15,757 |
|
$ |
(105,954) |
|
67
Papa John’s International, Inc. and Subsidiaries
Consolidated Statements of Stockholders’ Equity (Deficit) (continued)
|
|
|
Papa John’s International, Inc. |
|
|
|
|
|
|
|
|||||||||||||||
|
|
|
Common |
|
|
|
|
|
|
|
Accumulated |
|
|
|
|
|
|
|
|
|
|
|
|
|
|
|
|
|
Stock |
|
|
|
|
Additional |
|
Other |
|
|
|
|
|
|
|
Noncontrolling |
|
Total |
|
||||
|
|
|
Shares |
|
Common |
|
Paid-In |
|
Comprehensive |
|
Retained |
|
Treasury |
|
Interests in |
|
Stockholders’ |
|
|||||||
|
(In thousands) |
|
Outstanding |
|
Stock |
|
Capital |
|
Loss |
|
Earnings |
|
Stock |
|
Subsidiaries |
|
Equity (Deficit) |
|
|||||||
|
Balance at December 31, 2017 |
|
33,931 |
|
$ |
442 |
|
$ |
184,785 |
|
$ |
(2,117) |
|
$ |
292,251 |
|
$ |
(597,072) |
|
$ |
15,757 |
|
$ |
(105,954) |
|
|
Cumulative effect of adoption of ASU 2014-09 (2) |
|
— |
|
|
— |
|
|
— |
|
|
— |
|
|
(21,528) |
|
|
— |
|
|
— |
|
|
(21,528) |
|
|
Adjusted balance at January 1, 2018 |
|
33,931 |
|
|
442 |
|
|
184,785 |
|
|
(2,117) |
|
|
270,723 |
|
|
(597,072) |
|
|
15,757 |
|
|
(127,482) |
|
|
Net income (1) |
|
— |
|
|
— |
|
|
— |
|
|
— |
|
|
1,646 |
|
|
— |
|
|
1,874 |
|
|
3,520 |
|
|
Other comprehensive loss |
|
— |
|
|
— |
|
|
— |
|
|
(571) |
|
|
— |
|
|
— |
|
|
— |
|
|
(571) |
|
|
Adoption of ASU 2018-02 (3) |
|
— |
|
|
— |
|
|
— |
|
|
(455) |
|
|
455 |
|
|
— |
|
|
— |
|
|
— |
|
|
Cash dividends paid |
|
— |
|
|
— |
|
|
145 |
|
|
— |
|
|
(28,944) |
|
|
— |
|
|
— |
|
|
(28,799) |
|
|
Exercise of stock options |
|
75 |
|
|
1 |
|
|
2,698 |
|
|
— |
|
|
— |
|
|
— |
|
|
— |
|
|
2,699 |
|
|
Tax effect of equity awards |
|
— |
|
|
— |
|
|
(1,521) |
|
|
— |
|
|
— |
|
|
— |
|
|
— |
|
|
(1,521) |
|
|
Acquisition of Company common stock |
|
(2,697) |
|
|
— |
|
|
— |
|
|
— |
|
|
— |
|
|
(158,049) |
|
|
— |
|
|
(158,049) |
|
|
Stock-based compensation expense |
|
— |
|
|
— |
|
|
9,936 |
|
|
— |
|
|
— |
|
|
— |
|
|
— |
|
|
9,936 |
|
|
Issuance of restricted stock |
|
56 |
|
|
— |
|
|
(3,005) |
|
|
— |
|
|
— |
|
|
3,005 |
|
|
— |
|
|
— |
|
|
Distributions to noncontrolling interests |
|
— |
|
|
— |
|
|
— |
|
|
— |
|
|
— |
|
|
— |
|
|
(2,406) |
|
|
(2,406) |
|
|
Other |
|
7 |
|
|
— |
|
|
(54) |
|
|
— |
|
|
181 |
|
|
412 |
|
|
— |
|
|
539 |
|
|
Balance at December 30, 2018 |
|
31,372 |
|
$ |
443 |
|
$ |
192,984 |
|
$ |
(3,143) |
|
$ |
244,061 |
|
$ |
(751,704) |
|
$ |
15,225 |
|
$ |
(302,134) |
|
|
(1) |
Net income to the Company at December 30, 2018, December 31, 2017 and December 25, 2016 excludes $1,599, $4,233 and $6,272, respectively, allocable to the noncontrolling interests for our joint venture arrangements. |
|
(2) |
As of January 1, 2018, the Company adopted ASU 2014-09, “Revenue from Contracts with Customers”. See Note 3 of “Notes to the Consolidated Financial Statements” for additional information. |
|
(3) |
As of January 1, 2018, the Company adopted ASU 2018-02, “Reclassification of Certain Tax Effects from Accumulated Other Comprehensive Income,” and reclassified stranded tax effects of approximately $455 to retained earnings in the first quarter of 2018. See “Note 2” of “Notes to Consolidated Financial Statements” for additional information. |
At December 25, 2016, the accumulated other comprehensive loss of $5,887 was comprised of net unrealized foreign currency translation loss of $5,402 and a net unrealized loss on the interest rate swap agreements of $485.
At December 31, 2017, the accumulated other comprehensive loss of $2,117 was comprised of net unrealized foreign currency translation loss of $2,523 and a net unrealized gain on the interest rate swap agreements of $406.
At December 30, 2018, the accumulated other comprehensive loss of $3,143 was comprised of net unrealized foreign currency translation loss of $6,859 and a net unrealized gain on the interest rate swap agreements of $3,716.
See accompanying notes.
68
Papa John’s International Inc. and Subsidiaries
Consolidated Statements of Cash Flows
|
|
|
Year ended |
|
|||||||
|
|
|
December 30, |
|
December 31, |
|
December 25, |
|
|||
|
(In thousands) |
|
2018 |
|
2017 |
|
2016 |
|
|||
|
Operating activities |
|
|
|
|
|
|
|
|
|
|
|
Net income before attribution to noncontrolling interests |
|
$ |
3,245 |
|
$ |
106,525 |
|
$ |
109,092 |
|
|
Adjustments to reconcile net income to net cash provided by operating activities: |
|
|
|
|
|
|
|
|
|
|
|
Provision for uncollectible accounts and notes receivable |
|
|
4,761 |
|
|
29 |
|
|
409 |
|
|
Depreciation and amortization |
|
|
46,403 |
|
|
43,668 |
|
|
40,987 |
|
|
Deferred income taxes |
|
|
1,705 |
|
|
498 |
|
|
11,624 |
|
|
Stock-based compensation expense |
|
|
9,936 |
|
|
10,413 |
|
|
10,123 |
|
|
Loss (gain) on refranchising |
|
|
289 |
|
|
— |
|
|
(11,572) |
|
|
Impairment loss |
|
|
— |
|
|
1,674 |
|
|
1,350 |
|
|
Other |
|
|
5,677 |
|
|
3,375 |
|
|
3,337 |
|
|
Changes in operating assets and liabilities, net of acquisitions: |
|
|
|
|
|
|
|
|
|
|
|
Accounts receivable |
|
|
1,386 |
|
|
(7,358) |
|
|
1,557 |
|
|
Income tax receivable |
|
|
(12,170) |
|
|
(1,531) |
|
|
4,100 |
|
|
Inventories |
|
|
3,093 |
|
|
(5,485) |
|
|
(3,639) |
|
|
Prepaid expenses |
|
|
(2,165) |
|
|
(4,414) |
|
|
(3,826) |
|
|
Other current assets |
|
|
4,834 |
|
|
(1,158) |
|
|
616 |
|
|
Other assets and liabilities |
|
|
1,464 |
|
|
(742) |
|
|
(6,269) |
|
|
Accounts payable |
|
|
(1,694) |
|
|
(8,743) |
|
|
(916) |
|
|
Income and other taxes payable |
|
|
(3,971) |
|
|
1,897 |
|
|
9 |
|
|
Accrued expenses and other current liabilities |
|
|
10,273 |
|
|
(3,012) |
|
|
(7,960) |
|
|
Deferred revenue |
|
|
(271) |
|
|
(661) |
|
|
1,235 |
|
|
Net cash provided by operating activities |
|
|
72,795 |
|
|
134,975 |
|
|
150,257 |
|
|
Investing activities |
|
|
|
|
|
|
|
|
|
|
|
Purchases of property and equipment |
|
|
(42,028) |
|
|
(52,593) |
|
|
(55,554) |
|
|
Loans issued |
|
|
(10,463) |
|
|
(8,103) |
|
|
(3,210) |
|
|
Repayments of loans issued |
|
|
5,805 |
|
|
4,185 |
|
|
8,569 |
|
|
Acquisitions, net of cash acquired |
|
|
— |
|
|
(21) |
|
|
(13,352) |
|
|
Proceeds from divestitures of restaurants |
|
|
7,707 |
|
|
— |
|
|
16,844 |
|
|
Other |
|
|
180 |
|
|
34 |
|
|
429 |
|
|
Net cash used in investing activities |
|
|
(38,799) |
|
|
(56,498) |
|
|
(46,274) |
|
|
Financing activities |
|
|
|
|
|
|
|
|
|
|
|
Proceeds from issuance of term loan |
|
|
— |
|
|
400,000 |
|
|
— |
|
|
Repayments of term loan |
|
|
(20,000) |
|
|
(5,000) |
|
|
— |
|
|
Net proceeds (repayments) of revolving credit facility |
|
|
175,000 |
|
|
(225,575) |
|
|
44,575 |
|
|
Debt issuance costs |
|
|
(1,913) |
|
|
(3,181) |
|
|
— |
|
|
Cash dividends paid |
|
|
(28,985) |
|
|
(30,720) |
|
|
(27,896) |
|
|
Tax payments for equity award issuances |
|
|
(1,521) |
|
|
(2,428) |
|
|
(6,024) |
|
|
Proceeds from exercise of stock options |
|
|
2,699 |
|
|
6,260 |
|
|
7,060 |
|
|
Acquisition of Company common stock |
|
|
(158,049) |
|
|
(209,586) |
|
|
(122,381) |
|
|
Contributions from noncontrolling interest holders |
|
|
— |
|
|
2,956 |
|
|
690 |
|
|
Distributions to noncontrolling interest holders |
|
|
(4,269) |
|
|
(5,449) |
|
|
(5,610) |
|
|
Other |
|
|
356 |
|
|
663 |
|
|
556 |
|
|
Net cash used in financing activities |
|
|
(36,682) |
|
|
(72,060) |
|
|
(109,030) |
|
|
Effect of exchange rate changes on cash and cash equivalents |
|
|
(191) |
|
|
365 |
|
|
(396) |
|
|
Change in cash and cash equivalents |
|
|
(2,877) |
|
|
6,782 |
|
|
(5,443) |
|
|
Cash and cash equivalents at beginning of period |
|
|
22,345 |
|
|
15,563 |
|
|
21,006 |
|
|
Cash and cash equivalents at end of period |
|
$ |
19,468 |
|
$ |
22,345 |
|
$ |
15,563 |
|
|
See accompanying notes. |
|
|
|
|
|
|
|
|
|
|
69
Papa John’s International, Inc. and Subsidiaries
Notes to Consolidated Financial Statements
1. Description of Business
Papa John’s International, Inc. (referred to as the “Company,” “Papa John’s” or in the first person notations of “we,” “us” and “our”), operates and franchises pizza delivery and carryout restaurants under the trademark “Papa John’s,” in all 50 states and in 46 international countries and territories as of December 30, 2018. Substantially all revenues are derived from retail sales of pizza and other food and beverage products by Company-owned restaurants, franchise royalties, sales of franchise and development rights, and sales to franchisees of food and paper products, printing and promotional items and information systems and related services used in their operations.
2. Significant Accounting Policies
Principles of Consolidation
The accompanying Consolidated Financial Statements include the accounts of Papa John’s and its subsidiaries. All intercompany balances and transactions have been eliminated.
Variable Interest Entity
Papa John’s domestic restaurants, both Company-owned and franchised, participate in Papa John’s Marketing Fund, Inc. (“PJMF”), a nonstock corporation designed to operate at break-even for the purpose of designing and administering advertising and promotional programs for all participating domestic restaurants. PJMF is a variable interest entity (“VIE”) as it does not have sufficient equity to fund its operations without ongoing financial support and contributions from its members. Based on the ownership and governance structure and operating procedures of PJMF, we have determined that we do not have the power to direct the most significant activities of PJMF and are therefore not the primary beneficiary. Accordingly, consolidation of PJMF is not appropriate.
Fiscal Year
Our fiscal year ends on the last Sunday in December of each year. All fiscal years presented consist of 52 weeks except for the 2017 fiscal year, which consisted of 53 weeks.
Use of Estimates
The preparation of Consolidated Financial Statements in conformity with accounting principles generally accepted in the United States requires management to make estimates and assumptions that affect the amounts reported in the Consolidated Financial Statements and accompanying notes. Significant items that are subject to such estimates and assumptions include allowance for doubtful accounts and notes receivable, intangible assets, contract assets and contract liabilities including the online customer loyalty program obligation, insurance reserves and tax reserves. Although management bases its estimates on historical experience and assumptions that are believed to be reasonable under the circumstances, actual results could significantly differ from these estimates.
Revenue Recognition
Revenue is measured based on consideration specified in contracts with customers and excludes waivers or incentives and amounts collected on behalf of third parties, primarily sales tax. The Company recognizes revenue when it satisfies a performance obligation by transferring control over a product or service to a customer. Taxes assessed by a governmental authority that are both imposed on and concurrent with a specific revenue-producing transaction, that are collected by the
70
Company from a customer, are excluded from revenue. Delivery costs, including freight associated with our domestic commissary and other sales, are accounted for as fulfillment costs and are included in operating costs.
As further described in Accounting Standards Adopted and Note 3, the Company adopted ASC Topic 606, “Revenue from Contracts with Customers” (“Topic 606”), in the first quarter of 2018. Prior year revenue recognition follows ASC Topic 605, “Revenue Recognition.”
The following describes principal activities, separated by major product or service, from which the Company generates its revenues:
Company-owned Restaurant Sales
The domestic and international Company-owned restaurants principally generate revenue from retail sales of high-quality pizza, side items including breadsticks, cheesesticks, chicken poppers and wings, dessert items and canned or bottled beverages. Revenues from Company-owned restaurants are recognized when the products are delivered to or carried out by customers.
Our North American customer loyalty program, Papa Rewards, is a spend-based program that rewards customers with points for each online purchase. Papa Rewards points are accumulated and redeemed. During the fourth quarter of 2018, the program transitioned from product based rewards to dollar off discounts (“Papa Dough”) which can be used on future purchases within a six month expiration window. The accrued liability in the Consolidated Balance Sheets, and corresponding reduction of Company-owned restaurant sales in the Consolidated Statements of Operations, is for the estimated reward redemptions at domestic Company-owned restaurants based upon estimated redemption patterns. Currently, the liability related to Papa Rewards is calculated using the estimated redemption value for which the points and accumulated rewards are expected to be redeemed. Revenue is recognized when the customer redeems the Papa Dough reward. Prior to the adoption of Topic 606, the liability related to Papa Rewards was estimated using the incremental cost accrual model which was based on the expected cost to satisfy the award and the corresponding expense was recorded in general and administrative expenses in the Consolidated Statements of Operations.
Franchise Royalties and Fees
Franchise royalties which are based on a percentage of franchise restaurant sales are recognized as sales occur. Any royalty reductions, including waivers or those offered as part of a new store development incentive or as incentive for other behaviors including acceleration of restaurant remodels or equipment upgrades, are recognized at the same time as the related royalty as they are not separately distinguishable from the full royalty rate. Franchise royalties are billed on a monthly basis.
The majority of initial franchise license fees and area development exclusivity fees are from international locations. Initial franchise license fees are billed at the store opening date. Area development exclusivity fees are billed upon execution of the development agreements which grant the right to develop franchised restaurants in future periods in specific geographic areas. Area development exclusivity fees are included in deferred revenue in the Consolidated Balance Sheets and allocated on a pro rata basis to all stores opened under that specific development agreement. The pre-opening services provided to franchisees do not contain separate and distinct performance obligations from the franchise right; thus, the fees collected will be amortized on a straight-line basis beginning at the store opening date through the term of the franchise agreement, which is typically 10 years. Franchise license renewal fees for both domestic and international locations, which generally occur every 10 years, are billed before the renewal date. Fees received for future license renewal periods are amortized over the life of the renewal period. For periods prior to adoption of Topic 606, revenue was recognized when we performed our obligations related to such fees, primarily the store opening date for initial franchise fees and area development fees, or the date the renewal option was effective for license renewal fees.
The Company offers various incentive programs for franchisees including royalty incentives, new restaurant opening incentives (i.e. development incentives) and other support initiatives. Royalties and franchise fees sales are reduced to reflect any royalty incentives earned or granted under these programs that are in the form of discounts.
71
Commissary Sales
Commissary sales are comprised of food and supplies sold to franchised restaurants and are recognized as revenue upon shipment or delivery of the related products to the franchisees. Payments are generally due within 30 days.
As noted above, there are various incentive programs available to franchisees related to new restaurant openings including discounts on initial commissary orders and new store equipment incentives, at substantially no cost to franchisees. Commissary sales are reduced to reflect incentives in the form of direct discounts on initial commissary orders. The new store equipment incentive is also recorded as a reduction of commissary sales over the term of the incentive agreement, which is generally three to five years.
Other Revenues
Fees for information services, including software maintenance fees, help desk fees and online ordering fees are recognized as revenue as such services are provided and are included in other revenue.
Revenues for printing, promotional items, and direct mail marketing services are recognized upon shipment of the related products to franchisees and other customers. Direct mail advertising discounts are also periodically offered by our Preferred Marketing Solutions subsidiary. Other revenues are reduced to reflect these advertising discounts.
Rental income, primarily derived from properties leased by the Company and subleased to franchisees in the United Kingdom, is recognized on a straight-line basis over the respective operating lease terms, in accordance with ASC Topic 840, “Leases.” The Company does not expect a significant impact on rental income upon adoption of the new lease accounting guidance, ASU 2016-02, “Leases,” effective December 31, 2018 (at the beginning of fiscal year 2019).
Franchise Marketing Fund revenues represent contributions collected by various international and domestic marketing funds (“Co-op” or “Co-operative”) where we have determined that we have control over the activities of the fund. Contributions are based on a percentage of monthly restaurant sales. The adoption of Topic 606 revised the principal versus agent determination of these arrangements. When we are determined to be the principal in these arrangements, advertising fund contributions and expenditures are reported on a gross basis in the Consolidated Statements of Operations. Our obligation related to these funds is to develop and conduct advertising activities in a specific country, region, or market, including the placement of electronic and print materials. Marketing fund contributions are billed monthly.
For periods prior to the adoption of Topic 606, the revenues and expenses of certain international advertising funds and the Co-op Funds in which we possess majority voting rights, were included in our Consolidated Statements of Operations on a net basis as we previously concluded we were the agent in regard to the funds based upon principal/agent determinations in industry-specific guidance that was in effect during those time periods.
Advertising and Related Costs
Advertising and related costs of $60.8 million, $72.3 million and $70.9 million in 2018, 2017 and 2016, respectively, include the costs of domestic Company-owned local restaurant activities such as mail coupons, door hangers and promotional items and contributions to PJMF and various local market cooperative advertising funds (“Co-op Funds”). Contributions by domestic Company-owned and franchised restaurants to PJMF and the Co-op Funds are based on an established percentage of monthly restaurant revenues. PJMF is responsible for developing and conducting marketing and advertising for the domestic Papa John’s system. The Co-op Funds are responsible for developing and conducting advertising activities in a specific market, including the placement of electronic and print materials developed by PJMF. We recognize domestic Company-owned restaurant contributions to PJMF and the Co-op Funds in the period in which the contribution accrues. During 2018, the Company also contributed $10.0 million to PJMF to increase marketing and promotional activities which is included in general and administrative expenses and is a part of the Special charges for the year. See Notes 16 and 19 for additional information.
72
Leases
Lease expense is recognized on a straight-line basis over the expected life of the lease term. A lease term often includes option periods, available at the inception of the lease.
See Recent Accounting Pronouncements for information on the impact of the adoption effective December 31, 2018, of the new lease accounting guidance, ASU 2016-02, “Leases.”
Stock-Based Compensation
Compensation expense for equity grants is estimated on the grant date, net of projected forfeitures, and is recognized over the vesting period (generally in equal installments over three years). Restricted stock is valued based on the market price of the Company’s shares on the date of grant. Stock options are valued using a Black-Scholes option pricing model. Our specific assumptions for estimating the fair value of options are included in Note 20.
Cash Equivalents
Cash equivalents consist of highly liquid investments with maturity of three months or less at date of purchase. These investments are carried at cost, which approximates fair value.
Accounts Receivable
Substantially all accounts receivable is due from franchisees for purchases of food, paper products, point of sale equipment, printing and promotional items, information systems and related services, and royalties. Credit is extended based on an evaluation of the franchisee’s financial condition and collateral is generally not required. A reserve for uncollectible accounts is established as deemed necessary based upon overall accounts receivable aging levels and a specific review of accounts for franchisees with known financial difficulties. Account balances are charged off against the allowance after recovery efforts have ceased.
Notes Receivable
The Company provides financing to select franchisees principally for use in the construction and development of their restaurants and for the purchase of restaurants from the Company or other franchisees. Most notes receivable bear interest at fixed or floating rates and are generally secured by the assets of each restaurant and the ownership interests in the franchise. In 2018, the Company also provided certain franchisees with royalty payment plans. We establish an allowance based on a review of each borrower’s economic performance and underlying collateral value. Note balances are charged off against the allowance after recovery efforts have ceased.
Inventories
Inventories, which consist of food products, paper goods and supplies, smallwares, and printing and promotional items, are stated at the lower of cost, determined under the first-in, first-out (FIFO) method, or net realizable value.
Property and Equipment
Property and equipment are stated at cost. Depreciation is recorded using the straight-line method over the estimated useful lives of the assets (generally five to ten years for restaurant, commissary and other equipment, 20 to 40 years for buildings and improvements, and five years for technology and communication assets). Leasehold improvements are amortized over the terms of the respective leases, including the first renewal period (generally five to ten years).
Depreciation expense was $45.6 million in 2018, $42.6 million in 2017 and $39.7 million in 2016.
73
Deferred Costs
We capitalize certain information systems development and related costs that meet established criteria. Amounts capitalized, which are included in property and equipment, are amortized principally over periods not exceeding five years upon completion of the related information systems project. Total costs deferred were approximately $4.3 million in 2018, $4.1 million in 2017 and $2.9 million in 2016. The unamortized information systems development costs approximated $12.3 million and $11.1 million as of December 30, 2018 and December 31, 2017, respectively.
Intangible Assets — Goodwill
We evaluate goodwill annually in the fourth quarter or whenever we identify certain triggering events or circumstances that would more-likely-than-not reduce the fair value of a reporting unit below its carrying amount. Such tests are completed separately with respect to the goodwill of each of our reporting units, which includes our domestic Company-owned restaurants, United Kingdom (“PJUK”), China, and Preferred Marketing Solutions operations. We may perform a qualitative assessment or move directly to the quantitative assessment for any reporting unit in any period if we believe that it is more efficient or if impairment indicators exist.
We elected to perform a quantitative assessment for our domestic Company-owned restaurants, United Kingdom (“PJUK”), China, and Preferred Marketing Solutions operations in the fourth quarter of 2018. Our domestic Company-owned restaurants, PJUK and Preferred Marketing Solutions fair value calculations considered both an income approach and a market approach and our China fair value calculation considered an income approach. The income approach used projected net cash flows, with various growth assumptions, over a ten-year discrete period and a terminal value, which were discounted using appropriate rates. The selected discount rate considered the risk and nature of each reporting unit’s cash flow and the rates of return market participants would require to invest their capital in the reporting unit. In determining the fair value from a market approach, we considered earnings before interest, taxes, depreciation and amortization multiples that a potential buyer would pay based on third-party transactions in similar markets.
As a result of our quantitative analyses, we determined that it was more-likely-than-not that the fair values of our reporting units were greater than their carrying amounts. Subsequent to completing our goodwill impairment tests, no indicators of impairment were identified. See Note 10 for additional information.
Deferred Income Tax Accounts and Tax Reserves
We are subject to income taxes in the United States and several foreign jurisdictions. Significant judgment is required in determining Papa John’s provision for income taxes and the related assets and liabilities. The provision for income taxes includes income taxes paid, currently payable or receivable and those deferred. We use an estimated annual effective rate based on expected annual income to determine our quarterly provision for income taxes. Discrete items are recorded in the quarter in which they occur.
Deferred tax assets and liabilities are determined based on differences between financial reporting and tax basis of assets and liabilities and are measured using enacted tax rates and laws that are expected to be in effect when the differences reverse. Deferred tax assets are also recognized for the estimated future effects of tax attribute carryforwards (e.g., net operating losses, capital losses, and foreign tax credits). The effect on deferred taxes of changes in tax rates is recognized in the period in which the new tax rate is enacted. Valuation allowances are established when necessary on a jurisdictional basis to reduce deferred tax assets to the amounts we expect to realize.
On December 22, 2017, the Tax Cuts and Jobs Act (the “Tax Act”) was enacted, significantly decreasing the U.S. federal income tax rate for corporations effective January 1, 2018. On that same date, the Securities and Exchange Commission staff also issued Staff Accounting Bulletin (“SAB”) 118, which provides guidance on accounting for the tax effects of the Tax Act. SAB 118 provides a measurement period that should not extend beyond one year from the Tax Act enactment date for companies to complete the accounting under ASC 740, “Income Taxes.” As a result, we remeasured our deferred tax assets, liabilities and related valuation allowances in 2017. This remeasurement yielded a 2017 benefit of approximately $7.0 million due to the lower income tax rate. At December 30, 2018 the Company has completed its
74
analysis of the Tax Act. See Note 17 for additional information. Our net deferred income tax liability was approximately $7.1 million at December 30, 2018.
Tax authorities periodically audit the Company. We record reserves and related interest and penalties for identified exposures as income tax expense. We evaluate these issues and adjust for events, such as statute of limitations expirations, court rulings or audit settlements, which may impact our ultimate payment for such exposures. We recognized decreases in income tax expense of $1.7 million and $729,000 in 2017 and 2016, respectively, associated with the finalization of certain income tax matters. There were no amounts recognized in 2018 as there were no related events. See Note 17 for additional information.
Insurance Reserves
Our insurance programs for workers’ compensation, owned and non-owned automobiles, general liability, property, and health insurance coverage provided to our employees are funded by the Company up to certain retention levels under our retention programs. Retention limits generally range from $100,000 to $1.0 million.
Losses are accrued based upon undiscounted estimates of the liability for claims incurred using certain third-party actuarial projections and our claims loss experience. The estimated insurance claims losses could be significantly affected should the frequency or ultimate cost of claims differ significantly from historical trends used to estimate the insurance reserves recorded by the Company. The Company records estimated losses above retention within its reserve with a corresponding receivable for expected amounts due from insurance carriers.
Derivative Financial Instruments
We recognize all derivatives on the balance sheet at fair value. At inception and on an ongoing basis, we assess whether each derivative that qualifies for hedge accounting continues to be highly effective in offsetting changes in the cash flows of the hedged item. If the derivative meets the hedge criteria as defined by certain accounting standards, depending on the nature of the hedge, changes in the fair value of the derivative are either offset against the change in fair value of assets, liabilities or firm commitments through earnings or recognized in accumulated other comprehensive income/(loss) until the hedged item is recognized in earnings.
We recognized income of $4.3 million ($3.2 million after tax) in 2018, $1.4 million ($0.9 million after tax) in 2017 and income of $1.5 million ($0.9 million after tax) in 2016 in other comprehensive income/(loss) for the net change in the fair value of our interest rate swaps. See Note 11 for additional information on our debt and credit arrangements.
Noncontrolling Interests
At December 30, 2018, after the 2018 divestiture of two joint ventures that owned 62 restaurants, the Company has three joint ventures consisting of 183 restaurants, which have noncontrolling interests. Consolidated net income is required to be reported separately at amounts attributable to both the Company and the noncontrolling interest. Additionally, disclosures are required to clearly identify and distinguish between the interests of the Company and the interests of the noncontrolling owners, including a disclosure on the face of the Consolidated Statements of Operations of income attributable to the noncontrolling interest holder.
75
The following summarizes the redemption feature, location and related accounting within the Consolidated Balance Sheets for these three remaining joint venture arrangements:
|
|
|
|
|
|
|
Type of Joint Venture Arrangement |
|
Location within the Balance Sheets |
|
Recorded Value |
|
|
|
|
|
|
|
Joint venture with no redemption feature |
|
Permanent equity |
|
Carrying value |
|
Option to require the Company to purchase the noncontrolling interest - not currently redeemable |
|
Temporary equity |
|
Carrying value |
See Notes 8 and 9 for additional information regarding noncontrolling interests and divestitures.
Foreign Currency Translation
The local currency is the functional currency for each of our foreign subsidiaries. Revenues and expenses are translated into U.S. dollars using monthly average exchange rates, while assets and liabilities are translated using year-end exchange rates. The resulting translation adjustments are included as a component of accumulated other comprehensive income/(loss) net of income taxes. In 2018, the Company refranchised 34 Company-owned restaurants and a quality control center located in China. In conjunction with the transaction, approximately $1.3 million of accumulated other comprehensive income and $300,000 associated deferred tax related to foreign currency translation were reversed. See Note 9 for additional information.
Recent Accounting Pronouncements
Revenue from Contracts with Customers
In May 2014, the Financial Accounting Standards Board (“FASB”) issued Accounting Standards Update (“ASU”) 2014-09, “Revenue from Contracts with Customers” (“ASU 2014-09”), which supersedes nearly all existing revenue recognition guidance under GAAP, including industry-specific requirements, and provides companies with a single revenue recognition framework for recognizing revenue from contracts with customers. In March and April 2016, the FASB issued additional amendments to Topic 606. This update and subsequently issued amendments require companies to recognize revenue at amounts that reflect the consideration to which the companies expect to be entitled in exchange for those goods or services at the time of transfer. Topic 606 requires that we assess contracts to determine each separate and distinct performance obligation. If a contract has multiple performance obligations, we allocate the transaction price using our best estimate of the standalone selling price to each distinct good or service in the contract.
The Company adopted Topic 606 as of January 1, 2018. See Note 3 for additional information.
Certain Tax effects from Accumulated Other Comprehensive Income (Loss)
In February 2018, the FASB issued ASU 2018-02, “Income Statement—Reporting Comprehensive Income (Topic 220): Reclassification of Certain Tax Effects from Accumulated Other Comprehensive Income (“AOCI”)” (“ASU 2018-02”), which allows for an entity to reclassify disproportionate income tax in AOCI caused by the Tax Act to retained earnings. The guidance is effective for fiscal years beginning after December 15, 2018 with early adoption permitted, including interim periods within those years. The Company adopted ASU 2018-02 in the first quarter of 2018 by electing to reclassify the income tax effects from AOCI to retained earnings. The impact of the adoption was not material to our Consolidated Financial Statements.
76
Goodwill
In January 2017, the FASB issued ASU 2017-04, “Intangibles – Goodwill and Other,” (“ASU 2017-04”), which simplifies the accounting for goodwill. ASU 2017-04 eliminates the second step of the goodwill impairment test, which requires a hypothetical purchase price allocation. The goodwill impairment is the difference between the carrying value and fair value, not to exceed the carrying amount. ASU 2017-04 is effective for annual and interim periods in fiscal years beginning after December 15, 2019 with early adoption permitted. The Company adopted ASU 2017-04 in the fourth quarter of 2018. The impact of the adoption was not material to our Consolidated Financial Statements.
Employee Share-Based Payments
In March 2016, the FASB issued ASU 2016-09, “Compensation – Stock Compensation: Improvements to Employee Share-Based Payment Accounting” (“ASU 2016-09”). The guidance simplified the accounting and financial reporting of the income tax impact of stock-based compensation arrangements. This guidance requires excess tax benefits to be recorded as a discrete item within income tax expense rather than additional paid-in capital. In addition, excess tax benefits are required to be classified as cash from operating activities rather than cash from financing activities.
The Company adopted this guidance as of the beginning of fiscal 2017. The Company elected to apply the cash flow guidance of ASU 2016-09 retrospectively to all prior periods. The impact of retrospectively applying this guidance to the Consolidated Statement of Cash Flows was a $6.2 million increase in net cash provided by operating activities and a corresponding increase in net cash used in financing activities for the year ended December 25, 2016. The Company elected to continue to estimate forfeitures, as permitted by ASU 2016-09, rather than electing to account for forfeitures as they occur.
Hedging
In August 2017, the FASB issued ASU 2017-12, “Derivatives and Hedging (Topic 815) Targeted Improvements to Accounting for Hedging Activities” (“ASU 2017-12”) which intends to better align an entity's risk management activities and financial reporting for hedging relationships through changes to both the designation and measurement guidance for qualifying hedging relationships and the presentation of hedge results. The amendment attempts to simplify the application of hedge accounting guidance. The pronouncement is effective for fiscal years, and interim periods within those fiscal years, beginning after December 15, 2018, with early adoption permitted. The Company adopted ASU 2017-12 in the fourth quarter of 2017. The impact of the adoption was not material to our Consolidated Financial Statements.
In addition, in October 2018, the FASB issued ASU 2018-16, “Derivatives and Hedging (Topic 815): Inclusion of the Secured Overnight Financing Rate (SOFR) Overnight Index Swap (OIS) Rate as a Benchmark Interest Rate for Hedge Accounting Purposes” (“ASU 2018-16”), which amends Topic 815 to add the overnight index swap rate based on the secured overnight financing rate as a fifth U.S. benchmark interest rate. This is in response to the Financial Conduct Authority’s announcement in July 2017 that it intends to stop compelling banks to submit rates for the calculation of LIBOR after 2021. The pronouncement is effective for fiscal years, and interim periods within those fiscal years, beginning after December 15, 2018, with early adoption permitted. The Company has material contracts that are indexed to LIBOR and is continuing to evaluate the accounting, transition and disclosure requirements of ASU 2018-16.
77
Leases
In February 2016, the FASB issued ASU 2016-02, Topic 842, which requires companies to recognize a right-of-use asset and a lease liability on the balance sheet for contracts that meet the definition of a lease. This guidance also requires additional disclosures about the amount, timing, and uncertainty of cash flows arising from leases. ASU 2016-02 is effective for interim and annual periods beginning after December 15, 2018. In July 2018, the FASB issued ASU 2018-11, “Leases (Topic 842): Targeted Improvements.” ASU 2018-11 allows companies to elect an optional transition method to apply the new lease standard through a cumulative-effect adjustment in the period of adoption.
We have elected to adopt ASU 2016-02 using the optional transition method and we are revising our controls and processes to address the lease standard. We plan to take advantage of the transition package of practical expedients permitted under the transition guidance, which among other things, allows us to carryforward our prior lease classifications under ASC 840 and our assessment on whether a contract is or contains a lease. We will also elect to combine lease and non-lease components for all asset classes and to keep leases with an initial term of 12 months or less off the balance sheet for select asset classes. We do not expect to elect the use of hindsight practical expedient.
We do not expect ASU 2016-02 to have a material impact on our annual operating results or cash flows. The most significant impact of adoption will be the recognition of right of use assets and lease liabilities on our balance sheet. We expect the right of use asset recorded, net of amounts reclassified from other assets and liabilities, as specified by the new lease guidance, will not be materially different than the lease liability, which will be based on the present value of the remaining minimum rental payments of approximately $210 million using discount rates as of the effective date. See Note 19 for additional information.
The Company’s subsidiary located in the United Kingdom leases certain restaurant space to our franchisees under sublease agreements. As a lessor, we currently do not expect the new guidance to have a material effect on our Consolidated Financial Statements, as we believe substantially all of our existing leases will continue to be classified as operating leases. This revenue will continue to be reported as rental income in Other Revenues in the Consolidated Statements of Operations.
Financial Instruments – Credit Losses
In June 2016, the FASB issued ASU 2016-13, “Financial Instruments – Credit Losses (Topic 326): Measurement of Credit Losses on Financial Instruments,” which requires measurement and recognition of expected versus incurred losses for financial assets held. ASU 2016-13 is effective for annual periods beginning after December 15, 2019, with early adoption permitted for annual periods beginning after December 15, 2018. The Company is currently assessing the impact of adopting this standard on our Consolidated Balance Sheet, Results of Operations and Cash Flows.
Cloud Computing
In August 2018, the FASB issued ASU No. 2018-15 “Intangibles—Goodwill and Other—Internal-Use Software (Subtopic 350-40): Customer’s Accounting for Implementation Costs Incurred in a Cloud Computing Arrangement That Is a Service Contract,” which aligns the requirements for capitalizing implementation costs in cloud computing arrangements with the requirements for capitalizing implementation costs incurred to develop or obtain internal-use software. ASU 2018-15 is effective for annual and interim periods beginning after December 15, 2019, with early adoption permitted. Companies can choose to adopt the new guidance prospectively or retrospectively. The Company is currently in the process of evaluating the effects of this pronouncement on its Consolidated Financial Statements.
Reclassification
Certain prior year amounts in the Consolidated Statements of Operations have been reclassified to conform to the current year presentation. See Note 24 for additional information.
78
Subsequent Events
On February 3, 2019, the Company entered into a Securities Purchase Agreement with funds affiliated with Starboard Value LP (together with its affiliates, “Starboard”), pursuant to which the Company sold to Starboard 200,000 shares of the Company’s newly designated Series B convertible preferred stock, par value $0.01 per share (the “Series B Preferred Stock”), at a purchase price of $1,000 per share, for an aggregate purchase price of $200,000,000. Starboard has the option exercisable at their discretion, to purchase up to an additional 50,000 shares of Series B Preferred Stock for the same purchase price per share on or prior to March 29, 2019. The Series B Preferred Stock is convertible at the option of the holders at any time into shares of common stock based on the conversion rate determined by dividing $1,000, the stated value of the Series B Preferred Stock, by $50.06. The initial dividend rate of the Series B Preferred Stock will be 3.6% per annum on the stated value of $1,000 per share, payable quarterly in arrears. The Series B Preferred Stock will also participate on an as-converted basis in any regular or special dividends paid to common stockholders. The Series B Preferred Stock will be reported as temporary equity on the Company’s Consolidated Balance Sheet. In addition, the Company has the right to offer up to 10,000 shares of Series B Preferred Stock to qualified Papa John’s franchisees, subject to certain conditions of the Securities Purchase Agreement, on the same terms as Starboard.
3. Adoption of ASU 2014-09, “Revenue from Contracts with Customers”
The Company adopted Topic 606 using the modified retrospective transition method effective January 1, 2018. Results for reporting periods beginning after January 1, 2018 are presented in accordance with Topic 606, while prior period amounts are not adjusted and continue to be reported in accordance with our historical accounting under Topic 605, “Revenue Recognition.”
The cumulative effect adjustment of $21.5 million was recorded as a reduction to retained earnings as of January 1, 2018 to reflect the impact of adopting Topic 606. The impact of applying Topic 606 for the year ended December 30, 2018 was an increase in revenues of $4.0 million and a decrease in pre-tax income of $3.4 million.
The adoption of Topic 606 did not impact the recognition and reporting of two of our largest sources of revenue: sales from Company-owned restaurants and continuing royalties or other revenues from franchisees that are based on a percentage of the franchise sales. The items impacted by the adoption include the presentation of new store equipment incentives as an offset against commissary revenues, the presentation and amount of our loyalty program costs, the timing of franchise and development fees revenue recognition, and the presentation of various domestic and international advertising funds as further described below.
Cumulative Adjustment From Adoption
As previously noted, an after-tax reduction of $21.5 million was recorded to retained earnings in the first quarter of 2018 to reflect the cumulative impact of adopting Topic 606. This consists of $10.8 million related to franchise fees, $8.0 million related to the customer loyalty program and $2.7 million related to marketing funds.
79
The following chart presents the specific line items impacted by the cumulative adjustment.
|
|
|
|
|
|
|
|
|
Adjusted |
|
|
|
|
As Reported |
|
|
|
|
|
Balance Sheet |
|
|
|
|
December 31, |
|
|
Total |
|
|
at January 1, |
|
|
(In thousands, except per share amounts) |
|
2017 |
|
|
Adjustments |
|
|
2018 |
|
|
Assets |
|
|
|
|
|
|
|
|
|
|
Current assets: |
|
|
|
|
|
|
|
|
|
|
Cash and cash equivalents |
|
$ |
22,345 |
|
$ |
4,279 |
|
$ |
26,624 |
|
Accounts receivable (less allowance for doubtful accounts of $2,271 in 2017) |
|
|
64,558 |
|
|
493 |
|
|
65,051 |
|
Accounts receivable - affiliates (no allowance for doubtful accounts in 2017) |
|
|
86 |
|
|
— |
|
|
86 |
|
Notes receivable (no allowance for doubtful accounts in 2017) |
|
|
4,333 |
|
|
— |
|
|
4,333 |
|
Income tax receivable |
|
|
3,903 |
|
|
— |
|
|
3,903 |
|
Inventories |
|
|
30,620 |
|
|
— |
|
|
30,620 |
|
Prepaid expenses |
|
|
28,522 |
|
|
(4,959) |
|
|
23,563 |
|
Other current assets |
|
|
9,494 |
|
|
— |
|
|
9,494 |
|
Assets held for sale |
|
|
6,133 |
|
|
— |
|
|
6,133 |
|
Total current assets |
|
|
169,994 |
|
|
(187) |
|
|
169,807 |
|
Property and equipment, net |
|
|
234,331 |
|
|
— |
|
|
234,331 |
|
Notes receivable, less current portion (less allowance for doubtful accounts of $1,047 in 2017) |
|
|
15,568 |
|
|
— |
|
|
15,568 |
|
Goodwill |
|
|
86,892 |
|
|
— |
|
|
86,892 |
|
Deferred income taxes, net |
|
|
585 |
|
|
— |
|
|
585 |
|
Other assets |
|
|
48,183 |
|
|
(907) |
|
|
47,276 |
|
Total assets |
|
$ |
555,553 |
|
$ |
(1,094) |
|
$ |
554,459 |
|
|
|
|
|
|
|
|
|
|
|
|
Liabilities and stockholders’ equity (deficit) |
|
|
|
|
|
|
|
|
|
|
Current liabilities: |
|
|
|
|
|
|
|
|
|
|
Accounts payable |
|
$ |
32,006 |
|
$ |
(2,161) |
|
$ |
29,845 |
|
Income and other taxes payable |
|
|
10,561 |
|
|
— |
|
|
10,561 |
|
Accrued expenses and other current liabilities |
|
|
70,293 |
|
|
15,860 |
|
|
86,153 |
|
Deferred revenue current |
|
|
— |
|
|
2,400 |
|
|
2,400 |
|
Current portion of long-term debt |
|
|
20,000 |
|
|
— |
|
|
20,000 |
|
Total current liabilities |
|
|
132,860 |
|
|
16,099 |
|
|
148,959 |
|
Deferred revenue |
|
|
2,652 |
|
|
10,798 |
|
|
13,450 |
|
Long-term debt, less current portion, net |
|
|
446,565 |
|
|
— |
|
|
446,565 |
|
Deferred income taxes, net |
|
|
12,546 |
|
|
(6,464) |
|
|
6,082 |
|
Other long-term liabilities |
|
|
60,146 |
|
|
— |
|
|
60,146 |
|
Total liabilities |
|
|
654,769 |
|
|
20,433 |
|
|
675,202 |
|
|
|
|
|
|
|
|
|
|
|
|
Redeemable noncontrolling interests |
|
|
6,738 |
|
|
— |
|
|
6,738 |
|
|
|
|
|
|
|
|
|
|
|
|
Stockholders’ equity (deficit): |
|
|
|
|
|
|
|
|
|
|
Preferred stock ($0.01 par value per share; no shares issued) |
|
|
— |
|
|
— |
|
|
— |
|
Common stock ($0.01 par value per share; issued 44,221 at December 31, 2017) |
|
|
442 |
|
|
— |
|
|
442 |
|
Additional paid-in capital |
|
|
184,785 |
|
|
— |
|
|
184,785 |
|
Accumulated other comprehensive loss |
|
|
(2,117) |
|
|
— |
|
|
(2,117) |
|
Retained earnings |
|
|
292,251 |
|
|
(21,527) |
|
|
270,724 |
|
Treasury stock (10,290 shares at December 31, 2017, at cost) |
|
|
(597,072) |
|
|
— |
|
|
(597,072) |
|
Total stockholders’ (deficit) |
|
|
(121,711) |
|
|
(21,527) |
|
|
(143,238) |
|
Noncontrolling interests in subsidiaries |
|
|
15,757 |
|
|
— |
|
|
15,757 |
|
Total stockholders’ (deficit) |
|
|
(105,954) |
|
|
(21,527) |
|
|
(127,481) |
|
Total liabilities, redeemable noncontrolling interests and stockholders’ (deficit) |
|
$ |
555,553 |
|
$ |
(1,094) |
|
$ |
554,459 |
80
The impact of adoption at December 30, 2018 is as follows:
|
|
|
As Reported |
|
|
|
|
|
Balance Sheet |
|
|
|
|
December 30, |
|
|
Total |
|
|
Without Adoption |
|
|
(In thousands, except per share amounts) |
|
2018 |
|
|
Adjustments |
|
|
of Topic 606 |
|
|
Assets |
|
|
|
|
|
|
|
|
|
|
Current assets: |
|
|
|
|
|
|
|
|
|
|
Cash and cash equivalents |
|
$ |
19,468 |
|
$ |
(4,326) |
|
$ |
15,142 |
|
Accounts receivable (less allowance for doubtful accounts of $2,117 in 2018) |
|
|
67,785 |
|
|
(401) |
|
|
67,384 |
|
Accounts receivable - affiliates (no allowance for doubtful accounts in 2018) |
|
|
69 |
|
|
— |
|
|
69 |
|
Notes receivable (no allowance for doubtful accounts in 2018) |
|
|
5,498 |
|
|
— |
|
|
5,498 |
|
Income tax receivable |
|
|
16,073 |
|
|
— |
|
|
16,073 |
|
Inventories |
|
|
27,203 |
|
|
— |
|
|
27,203 |
|
Prepaid expenses |
|
|
29,935 |
|
|
4,771 |
|
|
34,706 |
|
Other current assets |
|
|
5,677 |
|
|
— |
|
|
5,677 |
|
Assets held for sale |
|
|
— |
|
|
— |
|
|
— |
|
Total current assets |
|
|
171,708 |
|
|
44 |
|
|
171,752 |
|
Property and equipment, net |
|
|
226,894 |
|
|
— |
|
|
226,894 |
|
Notes receivable, less current portion (less allowance for doubtful accounts of $3,369 in 2018) |
|
|
23,259 |
|
|
— |
|
|
23,259 |
|
Goodwill |
|
|
84,516 |
|
|
— |
|
|
84,516 |
|
Deferred income taxes, net |
|
|
756 |
|
|
— |
|
|
756 |
|
Other assets |
|
|
63,814 |
|
|
907 |
|
|
64,721 |
|
Total assets |
|
$ |
570,947 |
|
$ |
951 |
|
$ |
571,898 |
|
|
|
|
|
|
|
|
|
|
|
|
Liabilities and stockholders’ equity (deficit) |
|
|
|
|
|
|
|
|
|
|
Current liabilities: |
|
|
|
|
|
|
|
|
|
|
Accounts payable |
|
$ |
29,891 |
|
$ |
1,585 |
|
$ |
31,476 |
|
Income and other taxes payable |
|
|
6,590 |
|
|
— |
|
|
6,590 |
|
Accrued expenses and other current liabilities |
|
|
105,712 |
|
|
(18,210) |
|
|
87,502 |
|
Deferred revenue current |
|
|
2,443 |
|
|
(2,443) |
|
|
— |
|
Current portion of long-term debt |
|
|
20,000 |
|
|
— |
|
|
20,000 |
|
Total current liabilities |
|
|
164,636 |
|
|
(19,068) |
|
|
145,568 |
|
Deferred revenue |
|
|
14,679 |
|
|
(11,231) |
|
|
3,448 |
|
Long-term debt, less current portion, net |
|
|
601,126 |
|
|
— |
|
|
601,126 |
|
Deferred income taxes, net |
|
|
7,852 |
|
|
7,255 |
|
|
15,107 |
|
Other long-term liabilities |
|
|
79,324 |
|
|
— |
|
|
79,324 |
|
Total liabilities |
|
|
867,617 |
|
|
(23,044) |
|
|
844,573 |
|
|
|
|
|
|
|
|
|
|
|
|
Redeemable noncontrolling interests |
|
|
5,464 |
|
|
— |
|
|
5,464 |
|
|
|
|
|
|
|
|
|
|
|
|
Stockholders’ (deficit): |
|
|
|
|
|
|
|
|
|
|
Preferred stock ($0.01 par value per share; no shares issued) |
|
|
— |
|
|
— |
|
|
— |
|
Common stock ($0.01 par value per share; issued 44,301 at December 30, 2018) |
|
|
443 |
|
|
— |
|
|
443 |
|
Additional paid-in capital |
|
|
192,984 |
|
|
— |
|
|
192,984 |
|
Accumulated other comprehensive income (loss) |
|
|
(3,143) |
|
|
— |
|
|
(3,143) |
|
Retained earnings |
|
|
244,061 |
|
|
23,989 |
|
|
268,050 |
|
Treasury stock (12,929 shares at December 30, 2018, at cost) |
|
|
(751,704) |
|
|
— |
|
|
(751,704) |
|
Total stockholders’ (deficit) |
|
|
(317,359) |
|
|
23,989 |
|
|
(293,370) |
|
Noncontrolling interests in subsidiaries |
|
|
15,225 |
|
|
6 |
|
|
15,231 |
|
Total stockholders’ (deficit) |
|
|
(302,134) |
|
|
23,995 |
|
|
(278,139) |
|
Total liabilities, redeemable noncontrolling interests and stockholders’ (deficit) |
|
$ |
570,947 |
|
$ |
951 |
|
$ |
571,898 |
|
|
|
|
|
|
|
|
|
|
|
81
The impact for the year ended December 30, 2018 is as follows:
|
|
|
As Reported |
|
|
|
|
|
||
|
|
|
Year Ended |
|
|
|
|
Statement of Operations |
||
|
|
|
December 30, |
|
Total |
|
Without Adoption of |
|||
|
(In thousands, except per share amounts) |
|
2018 |
|
Adjustments |
|
Topic 606 |
|||
|
Revenues: |
|
|
|
|
|
|
|
|
|
|
Domestic Company-owned restaurant sales |
|
$ |
692,380 |
|
$ |
3,295 |
|
$ |
695,675 |
|
North America franchise royalties and fees |
|
|
79,293 |
|
|
375 |
|
|
79,668 |
|
North America commissary |
|
|
609,866 |
|
|
3,353 |
|
|
613,219 |
|
International |
|
|
110,349 |
|
|
205 |
|
|
110,554 |
|
Other revenues |
|
|
81,428 |
|
|
(11,238) |
|
|
70,190 |
|
Total revenues |
|
|
1,573,316 |
|
|
(4,010) |
|
|
1,569,306 |
|
Costs and expenses: |
|
|
|
|
|
|
|
|
|
|
Operating costs (excluding depreciation and amortization shown separately below): |
|
|
|
|
|
|
|
|
|
|
Domestic Company-owned restaurant expenses |
|
|
576,799 |
|
|
47 |
|
|
576,846 |
|
North America commissary |
|
|
575,103 |
|
|
— |
|
|
575,103 |
|
International expenses |
|
|
67,775 |
|
|
— |
|
|
67,775 |
|
Other expenses |
|
|
84,016 |
|
|
(10,847) |
|
|
73,169 |
|
General and administrative expenses |
|
|
192,551 |
|
|
3,428 |
|
|
195,979 |
|
Depreciation and amortization |
|
|
46,403 |
|
|
— |
|
|
46,403 |
|
Total costs and expenses |
|
|
1,542,647 |
|
|
(7,372) |
|
|
1,535,275 |
|
Refranchising and impairment gains/(losses), net |
|
|
(289) |
|
|
— |
|
|
(289) |
|
Operating income |
|
|
30,380 |
|
|
3,362 |
|
|
33,742 |
|
Investment income |
|
|
817 |
|
|
— |
|
|
817 |
|
Interest expense |
|
|
(25,306) |
|
|
— |
|
|
(25,306) |
|
Income before income taxes |
|
|
5,891 |
|
|
3,362 |
|
|
9,253 |
|
Income tax expense |
|
|
2,646 |
|
|
781 |
|
|
3,427 |
|
Net income before attribution to noncontrolling interests |
|
|
3,245 |
|
|
2,581 |
|
|
5,826 |
|
Income attributable to noncontrolling interests |
|
|
(1,599) |
|
|
— |
|
|
(1,599) |
|
Net income attributable to the Company |
|
$ |
1,646 |
|
$ |
2,581 |
|
$ |
4,227 |
|
|
|
|
|
|
|
|
|
|
|
|
Calculation of income for earnings per share: |
|
|
|
|
|
|
|
|
|
|
Net income attributable to the Company |
|
$ |
1,646 |
|
$ |
2,581 |
|
$ |
4,227 |
|
Net income attributable to common shareholders |
|
$ |
1,646 |
|
$ |
2,581 |
|
$ |
4,227 |
|
|
|
|
|
|
|
|
|
|
|
|
Basic earnings per common share |
|
$ |
0.05 |
|
$ |
0.08 |
|
$ |
0.13 |
|
Diluted earnings per common share |
|
$ |
0.05 |
|
$ |
0.08 |
|
$ |
0.13 |
|
|
|
|
|
|
|
|
|
|
|
|
Basic weighted average common shares outstanding |
|
|
32,083 |
|
|
32,083 |
|
|
32,083 |
|
Diluted weighted average common shares outstanding |
|
|
32,299 |
|
|
32,299 |
|
|
32,299 |
Transaction Price Allocated to the Remaining Performance Obligations
The following table (in thousands) includes estimated revenue expected to be recognized in the future related to performance obligations that are unsatisfied at the end of the reporting period.
|
|
|
|
Performance Obligations by Period |
||||||||||||||||||
|
|
|
Less than 1 Year |
|
1-2 Years |
|
2-3 Years |
|
3-4 Years |
|
4-5 Years |
|
Thereafter |
|
Total |
|||||||
|
Franchise Fees |
|
$ |
2,443 |
|
$ |
2,186 |
|
$ |
1,960 |
|
$ |
1,768 |
|
$ |
1,488 |
|
$ |
3,829 |
|
$ |
13,674 |
An additional $3.5 million of area development fees related to unopened stores and unearned royalties are included in deferred revenue. Timing of revenue recognition is dependent upon the timing of store openings and franchisees’ revenues.
82
As of December 30, 2018, the amount allocated to the Papa Rewards loyalty program is $18.0 million and is reflected in the Consolidated Balance Sheet as part of the contract liability included in accrued expenses and other current liabilities. This will be recognized as revenue as the points are redeemed, which is expected to occur within the next year.
The Company applies the practical expedient in ASC paragraph 606-10-50-14 and does not disclose information about remaining performance obligations that have original expected durations of one year or less.
4. Revenue Recognition
Disaggregation of Revenue
In the following table (in thousands), revenue is disaggregated by major product line. The table also includes a reconciliation of the disaggregated revenue with the reportable segments.
|
|
|
Reportable Segments |
||||||||||||||||
|
|
|
Year Ended December 30, 2018 |
||||||||||||||||
|
Major Products/Services Lines |
|
|
Domestic Company-owned restaurants |
|
|
North America commissaries |
|
|
North America franchising |
|
|
International |
|
|
All others |
|
|
Total |
|
Company-owned restaurant sales |
|
$ |
692,380 |
|
$ |
- |
|
$ |
- |
|
$ |
6,237 |
|
$ |
- |
|
$ |
698,617 |
|
Commissary sales |
|
|
- |
|
|
811,191 |
|
|
- |
|
|
68,124 |
|
|
- |
|
|
879,315 |
|
Franchise royalties and fees |
|
|
- |
|
|
- |
|
|
82,258 |
|
|
35,988 |
|
|
- |
|
|
118,246 |
|
Other revenues |
|
|
- |
|
|
- |
|
|
- |
|
|
21,202 |
|
|
91,205 |
|
|
112,407 |
|
Eliminations |
|
|
- |
|
|
(201,325) |
|
|
(2,965) |
|
|
(283) |
|
|
(30,696) |
|
|
(235,269) |
|
Total |
|
$ |
692,380 |
|
$ |
609,866 |
|
$ |
79,293 |
|
$ |
131,268 |
|
$ |
60,509 |
|
$ |
1,573,316 |
The revenue summarized above is described in Note 2 under the heading “Significant Accounting Policies – Revenue Recognition.”
Contract Balances
The contract liabilities primarily relate to franchise fees which we classify as “Deferred revenue” and customer loyalty program obligations which are classified with “Accrued expenses and other current liabilities.” During the year ended December 30, 2018, the Company recognized $15.7 million in revenue, related to deferred revenue and customer loyalty program.
|
|
|
Contract Liabilities (in thousands) |
|||||||
|
|
|
|
December 30, 2018 |
|
|
January 1, 2018 |
|
|
Change |
|
Deferred revenue |
|
$ |
17,122 |
|
$ |
15,850 |
|
$ |
1,272 |
|
Customer loyalty program |
|
|
18,019 |
|
|
14,724 |
|
|
3,295 |
|
Total contract liabilities |
|
$ |
35,141 |
|
$ |
30,574 |
|
$ |
4,567 |
The contract assets consist primarily of equipment incentives provided to franchisees. Equipment incentives are related to the future value of commissary revenue the Company will receive over the term of the agreement.
As of December 30, 2018 and January 1, 2018, the contract assets were approximately $6.6 million and $7.1 million, respectively. For the year ended December 30, 2018, revenue was reduced approximately $4.0 million for the amortization of contract assets over the applicable contract terms. Contract assets are included in Other Current Assets and Other Assets.
83
5.Stockholders’ Equity (Deficit)
Shares Authorized and Outstanding
The Company has authorized 5.0 million shares of preferred stock and 100.0 million shares of common stock. The Company’s outstanding shares of common stock, net of repurchased common stock, were 31.4 million shares at December 30, 2018 and 33.9 million shares at December 31, 2017. There were no shares of preferred stock issued or outstanding at December 30, 2018 and December 31, 2017. Subsequent to December 30, 2018, on February 3, 2019, the Company entered into a Securities Purchase Agreement in which the Company issued and sold 200,000 shares of the Company’s newly designated Series B Preferred Stock. See ‘Subsequent Events’ in Note 2 for additional information.
Share Repurchase Program
We repurchased 2.7 million shares of our common stock for $158 million in 2018, including $100 million (1.7 million shares) under an accelerated share repurchase agreement (“ASR Agreement”) with Bank of America, N.A. Share repurchases for 2017 and 2016 were 3.0 million and 2.1 million for $209.6 million and $122.4 million, respectively. These repurchases were under a share repurchase program that expired on February 27, 2019. Funding for the share repurchase program was provided through a credit facility, operating cash flow, stock option exercises and cash and cash equivalents. In connection with the execution of our amended Credit Agreement in October 2018, the Company cannot repurchase any additional shares if our Leverage Ratio, as defined in the Credit Agreement is higher than 3.75 to 1.0. See Note 11 for additional information on our Credit Agreement.
Cash Dividend
The Company paid dividends of $29.0 million in 2018, $30.7 million in 2017 and $27.9 million in 2016. Subsequent to fiscal 2018, our Board of Directors declared a first quarter 2019 cash dividend of $0.225 per common share, or approximately $8.0 million, including the Series B Preferred Stock dividend on an as-converted basis to common stock. The dividend was paid on February 22, 2019 to shareholders of record as of the close of business on February 11, 2019. In connection with the execution of our amended Credit Agreement in October 2018, no increase in dividends per share may occur if our Leverage Ratio as defined in the Credit Agreement is higher than 3.75 to 1.0.
Stockholder Rights Plan
On July 22, 2018, the Board of Directors of the Company approved the adoption of a limited duration stockholder rights plan (the “Rights Plan”) with an expiration date of July 22, 2019 and an ownership trigger threshold of 15% (with a threshold of 31% applied to John H. Schnatter, together with his affiliates and family members). In connection with the Rights Plan, the Board of Directors authorized and declared a dividend to stockholders of record at the close of business on August 2, 2018 of one preferred share purchase right (a “Right”) for each outstanding share of Papa John’s common stock. Upon certain triggering events, each Right would entitle the holder to purchase from the Company one one-thousandth (subject to adjustment) of one share of Series A Junior Participating Preferred Stock, $0.01 par value per share of the Company (“Preferred Stock”) at an exercise price of $250.00 (the “Exercise Price”) per one one-thousandth of a share of Preferred Stock. In addition, if a person or group acquires beneficial ownership of 15% or more of the Company’s common stock (or in the case of Mr. Schnatter, 31% or more) without prior board approval, each holder of a Right (other than the acquiring person or group whose Rights will become void) will have the right to purchase, upon payment of the Exercise Price and in accordance with the terms of the Rights Plan, a number of shares of the Company’s common stock having a market value of twice the Exercise Price. The complete terms of the Rights are set forth in a Rights Agreement (the “Rights Agreement”), dated as of July 22, 2018, between the Company and Computershare Trust Company, N.A., as rights agent. Subsequent to the year ended December 30, 2018, on February 3, 2019, the Company entered into an amendment to the Rights Agreement to exempt funds affiliated with Starboard Value LP from the 15% ownership trigger threshold, to facilitate the Company’s sale to the funds of the Company’s Series B Preferred Stock. On March 5, 2019, the Board of Directors extended the term of the Rights Plan to March 6, 2022, increased the ownership trigger threshold at which a person becomes an acquiring person from 15% to 20%, except as set forth above, removed the “acting in concert” provision in response to stockholder feedback, and included a qualifying offer provision as set forth in the Rights Plan.
84
6. Earnings per Share
We compute earnings per share using the two-class method. The two-class method requires an earnings allocation formula that determines earnings per share for common shareholders and participating security holders according to dividends declared and participating rights in undistributed earnings. We consider time-based restricted stock awards to be participating securities because holders of such shares have non-forfeitable dividend rights. Under the two-class method, undistributed earnings allocated to participating securities are subtracted from net income attributable to the Company in determining net income attributable to common shareholders.
Additionally, in accordance with ASC 480, “Distinguishing Liabilities from Equity”, the increase in the redemption value for the noncontrolling interest of one of our joint ventures reduces income attributable to common shareholders (and a decrease in redemption value increases income attributable to common shareholders). This joint venture was divested during 2018 and no change in redemption value occurred in 2018. The change in noncontrolling interest redemption value was $1.4 million and $570,000 for the years ended December 31, 2017 and December 25, 2016, respectively. See Notes 8 and 9 for additional information.
Basic earnings per common share are computed by dividing net income attributable to common shareholders by the weighted-average common shares outstanding. Diluted earnings per common share are computed by dividing the net income attributable to common shareholders by the diluted weighted average common shares outstanding. Diluted weighted average common shares outstanding consist of basic weighted average common shares outstanding plus weighted average awards outstanding under our equity compensation plans, which are dilutive securities.
The calculations of basic earnings per common share and diluted earnings per common share for the years ended December 30, 2018, December 31, 2017 and December 25, 2016 are as follows (in thousands, except per share data):
|
|
|
|
|
|
|
|
|
|
|
|
|
|
|
|
|
|
|
|
|
|
2018 |
|
2017 |
|
2016 |
|||
|
|
|
|
|
|
|
|
|
|
|
Basic earnings per common share: |
|
|
|
|
|
|
|
|
|
Net income attributable to the Company |
$ |
1,646 |
|
$ |
102,292 |
|
$ |
102,820 |
|
Change in noncontrolling interest redemption value |
|
— |
|
|
1,419 |
|
|
567 |
|
Net income attributable to participating securities |
|
— |
|
|
(423) |
|
|
(420) |
|
Net income attributable to common shareholders |
$ |
1,646 |
|
$ |
103,288 |
|
$ |
102,967 |
|
|
|
|
|
|
|
|
|
|
|
Weighted average common shares outstanding |
|
32,083 |
|
|
36,083 |
|
|
37,253 |
|
Basic earnings per common share |
$ |
0.05 |
|
$ |
2.86 |
|
$ |
2.76 |
|
|
|
|
|
|
|
|
|
|
|
Diluted earnings per common share: |
|
|
|
|
|
|
|
|
|
Net income attributable to common shareholders |
$ |
1,646 |
|
$ |
103,288 |
|
$ |
102,967 |
|
|
|
|
|
|
|
|
|
|
|
Weighted average common shares outstanding |
|
32,083 |
|
|
36,083 |
|
|
37,253 |
|
Dilutive effect of outstanding equity awards (a) |
|
216 |
|
|
439 |
|
|
355 |
|
Diluted weighted average common shares outstanding |
|
32,299 |
|
|
36,522 |
|
|
37,608 |
|
Diluted earnings per common share |
$ |
0.05 |
|
$ |
2.83 |
|
$ |
2.74 |
(a) Shares subject to options to purchase common stock with an exercise price greater than the average market price for the year were not included in the computation of diluted earnings per common share because the effect would have been antidilutive. The weighted average number of shares subject to antidilutive options was 1.2 million in 2018, 278,000 in 2017 and 331,000 in 2016.
See Note 8 for additional information regarding our noncontrolling interests and Note 20 for equity awards, including restricted stock.
85
7. Fair Value Measurements and Disclosures
The Company is required to determine the fair value of financial assets and liabilities based on the price that would be received to sell the asset or paid to transfer the liability to a market participant. Fair value is a market-based measurement, not an entity specific measurement. The fair value of certain assets and liabilities approximates carrying value because of the short-term nature of the accounts, including cash and cash equivalents, accounts receivable and accounts payable. The carrying value of our notes receivable, net of allowances, also approximates fair value. The fair value of the amount outstanding under our term debt and revolving credit facility approximates their carrying values due to their variable market-based interest rates (Level 2).
Certain assets and liabilities are measured at fair value on a recurring and non-recurring basis and are required to be classified and disclosed in one of the following categories:
|
· |
Level 1: Quoted market prices in active markets for identical assets or liabilities. |
|
· |
Level 2: Observable market-based inputs or unobservable inputs that are corroborated by market data. |
|
· |
Level 3: Unobservable inputs that are not corroborated by market data. |
Our financial assets and liabilities that were measured at fair value on a recurring basis as of December 30, 2018 and December 31, 2017 are as follows (in thousands):
|
|
|
Carrying |
|
Fair Value Measurements |
|
||||||||
|
|
|
Value |
|
Level 1 |
|
Level 2 |
|
Level 3 |
|
||||
|
December 30, 2018 |
|
|
|
|
|
|
|
|
|
|
|
|
|
|
Financial assets: |
|
|
|
|
|
|
|
|
|
|
|
|
|
|
Cash surrender value of life insurance policies (a) |
|
$ |
27,751 |
|
$ |
27,751 |
|
$ |
— |
|
$ |
— |
|
|
Interest rate swaps (b) |
|
|
4,905 |
|
|
— |
|
|
4,905 |
|
|
— |
|
|
|
|
|
|
|
|
|
|
|
|
|
|
|
|
|
December 31, 2017 |
|
|
|
|
|
|
|
|
|
|
|
|
|
|
Financial assets: |
|
|
|
|
|
|
|
|
|
|
|
|
|
|
Cash surrender value of life insurance policies (a) |
|
$ |
28,645 |
|
$ |
28,645 |
|
$ |
— |
|
$ |
— |
|
|
Interest rate swaps (b) |
|
|
651 |
|
|
— |
|
|
651 |
|
|
— |
|
|
(a) |
Represents life insurance policies held in our non-qualified deferred compensation plan. |
|
(b) |
The fair values of our interest rate swaps are based on the sum of all future net present value cash flows. The future cash flows are derived based on the terms of our interest rate swaps, as well as considering published discount factors, and projected London Interbank Offered Rates (“LIBOR”). |
Our assets and liabilities that were measured at fair value on a non-recurring basis as of December 31, 2017 include assets held for sale. The fair value was determined using a market-based approach with unobservable inputs (Level 3) less any estimated selling costs. We recorded an impairment loss of $1.7 million in 2017 which represents the excess of the carrying value over the fair value; the impairment is recorded in refranchising and impairment gains/(losses), net in the Consolidated Statements of Operations.
There were no transfers among levels within the fair value hierarchy during fiscal 2018 or 2017.
86
8. Noncontrolling Interests
At December 31, 2017, Papa John’s had five joint venture arrangements in which there were noncontrolling interests held by third parties. In the first quarter of 2018, one joint venture was divested and a second joint venture was divested in the third quarter of 2018.
As of December 30, 2018, there were 183 restaurants that comprise three joint ventures as compared to 246 restaurants in five joint venture arrangements at December 31, 2017. See Note 9 for more information on these related divestitures.
We are required to report the consolidated net (loss) income amounts attributable to the Company and the noncontrolling interests. Additionally, disclosures are required to clearly identify and distinguish between the interests of the Company and the interests of the noncontrolling owners, including a disclosure on the face of the Consolidated Statements of Operations of income attributable to the noncontrolling interest holders.
The income before income taxes attributable to these joint ventures for the years ended December 30, 2018, December 31, 2017 and December 25, 2016 were as follows (in thousands):
|
|
|
|
|
|
|
|
|
|
|
|
|
|
|
|
|
|
|
|
|
|
|
|
|
|
|
|
|
|
|
|
|
|
|
|
|
|
2018 |
|
2017 |
|
2016 |
|
|
|||
|
|
|
|
|
|
|
|
|
|
|
|
|
Papa John’s International, Inc. |
$ |
5,794 |
|
$ |
7,181 |
|
$ |
9,913 |
|
|
|
Noncontrolling interests |
|
1,599 |
|
|
4,233 |
|
|
6,272 |
|
|
|
Total income before income taxes |
$ |
7,393 |
|
$ |
11,414 |
|
$ |
16,185 |
|
|
As of December 30, 2018, the noncontrolling interest holder of one joint venture has the option to require the Company to purchase their interest, though not currently redeemable. Since redemption of the noncontrolling interests is outside of the Company’s control, the noncontrolling interests are presented in the caption “Redeemable noncontrolling interests” in the Consolidated Balance sheets.
The following summarizes changes in our redeemable noncontrolling interests in 2018 and 2017 (in thousands):
|
Balance at December 25, 2016 |
|
$ |
8,461 |
|
|
Net income |
|
|
2,195 |
|
|
Distributions |
|
|
(2,499) |
|
|
Change in redemption value |
|
|
(1,419) |
|
|
Balance at December 31, 2017 |
|
$ |
6,738 |
|
|
Net loss |
|
|
(274) |
|
|
Distributions |
|
|
(1,000) |
|
|
Balance at December 30, 2018 |
|
$ |
5,464 |
|
9. Divestitures
Divestitures
In the first quarter of 2018, the Company refranchised 31 restaurants owned through a joint venture in the Denver, Colorado market. The Company held a 60% ownership share in the restaurants being refranchised. The noncontrolling interest portion of the joint venture arrangement was previously recorded at redemption value within the Consolidated Balance Sheet. Total consideration for the asset sale of the restaurants was $4.8 million, consisting of cash proceeds of $3.7 million, including cash paid for various working capital items, and notes financed by Papa John’s for $1.1 million.
In connection with the divestiture, we wrote off $700,000 of goodwill. This goodwill was allocated based on the relative fair value of the sales proceeds versus the total fair value of the Company-owned restaurants’ reporting unit. We recorded a pre-tax refranchising gain of approximately $690,000.
87
As a result of assigning our interest in obligations under property leases as a condition of the refranchising of the Denver market, we are contingently liable for payment of the 31 leases. These leases have varying terms, the latest of which expires in 2024. As of December 30, 2018, the estimated maximum amount of undiscounted payments the Company could be required to make in the event of nonpayment by the primary lessee was $2.9 million. The fair value of the guarantee is not material.
In the second quarter of 2018, the Company refranchised 34 Company-owned restaurants and a quality control center located in Beijing and Tianjin, China. The Company recorded an impairment of $1.7 million and $1.4 million in 2017 and 2016, respectively, associated with the China operations and the assets and liabilities were classified as held for sale in the Consolidated Balance Sheet as of December 31, 2017. We recorded a pre-tax loss of approximately $1.9 million associated with the sale of the restaurants and reversed $1.3 million of accumulated other comprehensive income related to foreign currency translation as part of the disposal. The $1.9 million pre-tax loss in 2018 and impairments recorded in 2017 and 2016 are recorded in refranchising and impairment gains (losses), net on the Consolidated Statements of Operations. In addition, we also had $2.4 million of additional tax expense associated with the China refranchise in the second quarter of 2018. This additional tax expense is primarily attributable to the required recapture of operating losses previously taken by the Company.
The following summarizes the associated China assets and liabilities that were classified as held for sale in 2017 (in thousands):
|
|
|
|
|
|
|
|
|
December 31, 2017 |
|
Cash |
|
$ |
908 |
|
Inventories |
|
|
505 |
|
Prepaid expenses |
|
|
570 |
|
Net property and equipment |
|
|
4,878 |
|
Other assets |
|
|
946 |
|
Valuation allowance |
|
|
(1,674) |
|
Total assets held for sale |
|
$ |
6,133 |
|
|
|
|
|
|
Accounts payable |
|
$ |
1,817 |
|
Accrued and other liabilities |
|
|
470 |
|
Total liabilities held for sale |
|
$ |
2,287 |
In the third quarter of 2018, the Company completed the refranchising of 31 stores owned through a joint venture in the Minneapolis, Minnesota market. The Company held a 70% ownership share in the restaurants being refranchised. Total consideration for the asset sale of the restaurants was $3.75 million.
In connection with the divestiture, we wrote off approximately $600,000 of goodwill. This goodwill was allocated based on the relative fair value of the sales proceeds versus the total fair value of the Company-owned restaurants’ reporting unit. We recorded a pre-tax refranchising gain of approximately $930,000 associated with the sale of the restaurants.
As a result of assigning our interest in obligations under property leases as a condition of the refranchising of the Minnesota market, we are contingently liable for payment of the 31 leases. These leases have varying terms, the latest of which expires in 2025. As of December 30, 2018, the estimated maximum amount of undiscounted payments the Company could be required to make in the event of nonpayment by the primary lessee was $5.9 million. The fair value of the guarantee is not material.
88
10. Goodwill
The following summarizes changes in the Company’s goodwill, by reportable segment (in thousands):
|
|
|
|
|
|
|
|
|
|
|
||||
|
|
|
|
|
|
|
|
|
|
|
||||
|
|
|
|
|
|
|
|
|
|
|
||||
|
|
|
Domestic Company- owned Restaurants |
|
International (a) |
|
All Others |
|
Total |
|
||||
|
|
|
|
|
|
|
|
|
|
|
|
|
|
|
|
Balance as of December 25, 2016 |
|
$ |
70,048 |
|
$ |
15,045 |
|
$ |
436 |
|
$ |
85,529 |
|
|
Foreign currency adjustments |
|
|
— |
|
|
1,363 |
|
|
— |
|
|
1,363 |
|
|
Balance as of December 31, 2017 |
|
|
70,048 |
|
|
16,408 |
|
|
436 |
|
|
86,892 |
|
|
Divestitures (b) |
|
|
(1,359) |
|
|
— |
|
|
— |
|
|
(1,359) |
|
|
Foreign currency adjustments |
|
|
— |
|
|
(1,017) |
|
|
— |
|
|
(1,017) |
|
|
Balance as of December 30, 2018 |
|
$ |
68,689 |
|
$ |
15,391 |
|
$ |
436 |
|
$ |
84,516 |
|
|
(a) |
The international goodwill balances for all years presented are net of accumulated impairment of $2.3 million associated with our PJUK reporting unit, which was recorded in fiscal 2008. |
|
(b) |
Includes 62 restaurants located in two domestic markets. |
For fiscal year 2018, we performed a quantitative analysis for our domestic Company-owned restaurants, Preferred Marketing Solutions, China, and PJUK reporting units. For fiscal years 2017 and 2016, we performed a qualitative analysis on each reporting unit. No impairment charges were recorded upon the completion of our goodwill impairment tests in 2018, 2017 and 2016, excluding the China goodwill allocated to assets held for sale in 2016.
11. Debt and Credit Arrangements
Long-term debt, net consists of the following (in thousands):
|
|
|
|
|
December 30, |
|
|
December 31, |
|
|
|
|
|
2018 |
|
|
2017 |
|
Outstanding debt |
|
|
$ |
625,000 |
|
$ |
470,000 |
|
Unamortized debt issuance costs |
|
|
|
(3,874) |
|
|
(3,435) |
|
Current portion of long-term debt |
|
|
|
(20,000) |
|
|
(20,000) |
|
Total long-term debt, less current portion, net |
|
|
$ |
601,126 |
|
$ |
446,565 |
On August 30, 2017, the Company entered into a credit agreement (the “Credit Agreement”) which provided for a revolving credit facility in an aggregate principal amount of $600.0 million (the “Revolving Facility”) and a term loan facility in an aggregate principal amount of $400.0 million (the “Term Loan Facility”) and together with the Revolving Facility, the “Facilities”. The Facilities mature on August 30, 2022. The loans under the Facilities, after giving effect to the Amendment described below, accrue interest at a per annum rate equal to, at the Company’s election, either a LIBOR rate plus a margin ranging from 125 to 250 basis points or a base rate (generally determined by a prime rate, federal funds rate or a LIBOR rate plus 1.00%) plus a margin ranging from 25 to 150 basis points. In each case, the actual margin is determined according to a ratio of the Company’s total indebtedness to earnings before interest, taxes, depreciation and amortization (“EBITDA”) for the then most recently ended four-quarter period (the “Leverage Ratio”). Quarterly amortization payments are required to be made on the Term Loan Facility in the amount of $5.0 million which began in the fourth quarter of 2017. Loans outstanding under the Credit Agreement may be prepaid at any time without premium or penalty, subject to customary breakage costs in the case of borrowings for which a LIBOR rate election is in effect. Up to $35.0 million of the Revolving Facility may be advanced in certain agreed foreign currencies, including Euros, Pounds Sterling, Canadian Dollars, Japanese Yen, and Mexican Pesos. The Credit Agreement contains customary affirmative and negative covenants, including financial covenants requiring the maintenance of the Leverage Ratio and a specified fixed charge coverage ratio.
89
On October 9, 2018, we entered into an amendment to the Credit Agreement (the “Amendment”). The amendments and modifications to the Credit Agreement are effective through the remainder of the term of the Facilities and include, without limitation, the following:
|
· |
reduction of the maximum amount available under the Revolving Facility to $400.0 million; there was no change in available Term Loan Facility borrowings; |
|
· |
amendment to the definition of EBITDA to exclude certain costs recorded as Special charges (up to certain pre-defined limits) as detailed in Note 19 “Commitments and Contingencies”; |
|
· |
modification of the financial covenants in the Credit Agreement by increasing the permitted Leverage Ratio to 5.25 to 1.0 beginning in the third quarter of 2018, decreasing over time to 4.00 to 1.0 by 2022; and decreasing the permitted specified fixed charge coverage ratio to 2.00 to 1.0 beginning in the third quarter of 2018 and increasing over time to 2.50 to 1.0 in 2021 and thereafter. We were in compliance with these financial covenants at December 30, 2018; |
|
· |
certain modifications to the negative covenant restricting the ability to make dividends and distributions. If the Leverage Ratio is above 3.75 to 1.0, the Company cannot repurchase any of its shares of common stock and cannot increase the cash dividend above the lesser of $0.225 per share per quarter or $35 million per fiscal year; |
|
· |
increase in the interest rate payable on outstanding loans for the Facilities based on the Leverage Ratio as follows: |
|
Ø |
removal of interest rate pricing tiers if the Leverage Ratio of the Company is less than 1.50 to 1.00; |
|
Ø |
if the Leverage Ratio of the Company is greater than 3.50 to 1.00 but less than 4.50 to 1.00, the Company will pay an additional 0.25% per annum interest rate margin on the outstanding loans under the Facilities and an additional 0.05% per annum commitment fee on the unused portion of the Revolving Facility; |
|
Ø |
if the Leverage Ratio of the Company is greater than 4.50 to 1.00, the Company will pay an additional 0.50% per annum interest rate margin on the outstanding loans under the Facilities and an additional 0.10% per annum commitment fee on the unused portion of the Revolving Facility; and |
|
· |
requirement that the Company and certain direct and indirect domestic subsidiaries of the Company grant a security interest in substantially all of the capital stock and equity interests of their respective domestic and first tier material foreign subsidiaries to secure the obligations owing under the Facilities. |
Under the Credit Agreement, as amended, we have the option to increase the Revolving Facility or the Term Loan Facility in an aggregate amount of up to $300.0 million, subject to the Leverage Ratio of the Company not exceeding 4.00 to 1.00.
Our outstanding debt of $625.0 million at December 30, 2018 under the Facilities was composed of $375.0 million outstanding under the Term Loan Facility and $250.0 million outstanding under the Revolving Facility. Including outstanding letters of credit, the Company’s remaining availability under the Facilities at December 30, 2018 was approximately $110.0 million.
As of December 30, 2018, the Company had approximately $3.9 million in unamortized debt issuance costs, which are being amortized into interest expense over the term of the Facilities. Upon execution of the Amendment, we wrote off approximately $560,000 of these unamortized debt issuance costs in accordance with applicable accounting guidance. The Company also incurred additional amendment fees of approximately $1.9 million, which will be amortized into interest expense over the remaining term of the Facilities.
We attempt to minimize interest risk exposure by fixing our rate through the utilization of interest rate swaps, which are derivative financial instruments. Our swaps are entered into with financial institutions that participate in the Facilities. By using a derivative instrument to hedge exposures to changes in interest rates, we expose ourselves to credit risk. Credit risk is due to the possible failure of the counterparty to perform under the terms of the derivative contract.
90
We use interest rate swaps to hedge against the effects of potential interest rate increases on borrowings under our Facilities. As of December 30, 2018, we have the following interest rate swap agreements:
|
Effective Dates |
|
Floating Rate Debt |
|
Fixed Rates |
|
||
|
April 30, 2018 through April 30, 2023 |
|
$ |
55 |
million |
|
2.33 |
% |
|
April 30, 2018 through April 30, 2023 |
|
$ |
35 |
million |
|
2.36 |
% |
|
April 30, 2018 through April 30, 2023 |
|
$ |
35 |
million |
|
2.34 |
% |
|
January 30, 2018 through August 30, 2022 |
|
$ |
100 |
million |
|
1.99 |
% |
|
January 30, 2018 through August 30, 2022 |
|
$ |
75 |
million |
|
1.99 |
% |
|
January 30, 2018 through August 30, 2022 |
|
$ |
75 |
million |
|
2.00 |
% |
|
January 30, 2018 through August 30, 2022 |
|
$ |
25 |
million |
|
1.99 |
% |
The gain or loss on the swaps is recognized in other comprehensive (loss) income and reclassified into earnings as adjustments to interest expense in the same period or periods during which the swaps affect earnings.
The following table provides information on the location and amounts of our swaps in the accompanying Consolidated Financial Statements (in thousands):
|
|
|
Interest Rate Swap Derivatives |
||||
|
|
|
Fair Value |
|
Fair Value |
||
|
|
|
December 30, |
|
December 31, |
||
|
Balance Sheet Location |
|
2018 |
|
2017 |
||
|
|
|
|
|
|
|
|
|
Other current and long-term assets |
|
$ |
4,905 |
|
$ |
651 |
There were no derivatives that were not designated as hedging instruments.
The effect of derivative instruments on the accompanying Consolidated Financial Statements is as follows (in thousands):
|
|
|
|
|
|
|
|
|
|
|
|
||
|
|
|
|
|
Location of Gain |
|
Amount of Gain |
|
|
||||
|
Derivatives - |
|
Amount of Gain or |
|
or (Loss) |
|
or (Loss) |
|
Total Interest Expense |
||||
|
Cash Flow |
|
(Loss) Recognized |
|
Reclassified from |
|
Reclassified from |
|
on Consolidated |
||||
|
Hedging |
|
in AOCI/AOCL |
|
AOCI/AOCL into |
|
AOCI/AOCL into |
|
Statements of |
||||
|
Relationships |
|
on Derivative |
|
Income |
|
Income |
|
Operations |
||||
|
|
|
|
|
|
|
|
|
|
|
|
|
|
|
Interest rate swaps: |
|
|
|
|
|
|
||||||
|
2018 |
|
$ |
3,222 |
|
|
Interest expense |
|
$ |
(22) |
|
$ |
(25,306) |
|
2017 |
|
$ |
891 |
|
|
Interest expense |
|
$ |
(421) |
|
$ |
(11,283) |
|
2016 |
|
$ |
940 |
|
|
Interest expense |
|
$ |
(1,161) |
|
$ |
(7,397) |
The weighted average interest rates on our debt, including the impact of the interest rate swap agreements, were 3.9%, 2.7% and 2.1% in fiscal 2018, 2017 and 2016, respectively. Interest paid, including payments made or received under the swaps, was $23.5 million in 2018, $10.8 million in 2017 and $7.1 million in 2016. As of December 30, 2018, the portion of the $4.9 million interest rate swap asset that would be reclassified into earnings during the next 12 months as interest income approximates $1.3 million.
91
12. Net Property and Equipment
Net property and equipment consists of the following (in thousands):
|
|
|
December 30, |
|
December 31, |
|
||
|
|
|
2018 |
|
2017 |
|
||
|
Land |
|
$ |
33,833 |
|
$ |
33,994 |
|
|
Buildings and improvements |
|
|
91,665 |
|
|
91,809 |
|
|
Leasehold improvements |
|
|
125,192 |
|
|
125,204 |
|
|
Equipment and other |
|
|
402,991 |
|
|
378,509 |
|
|
Construction in progress |
|
|
11,491 |
|
|
10,983 |
|
|
Total property and equipment |
|
|
665,172 |
|
|
640,499 |
|
|
Accumulated depreciation and amortization |
|
|
(438,278) |
|
|
(406,168) |
|
|
Net property and equipment |
|
$ |
226,894 |
|
$ |
234,331 |
|
13. Notes Receivable
Selected domestic and international franchisees have borrowed funds from the Company, principally for use in the construction and development of their restaurants. In 2018, the Company also provided certain franchisees with royalty payment plans. We have also entered into loan agreements with certain franchisees that purchased restaurants from us or from other franchisees. Loans outstanding were approximately $28.8 million and $19.9 million on a consolidated basis as of December 30, 2018 and December 31, 2017, respectively, net of allowance for doubtful accounts.
The majority of notes receivable bear interest at fixed or floating rates and are generally secured by the assets of each restaurant and the ownership interests in the franchisee. Interest income recorded on franchisee loans was approximately $750,000 in 2018, $579,000 in 2017 and $684,000 in 2016 and is reported in investment income in the accompanying Consolidated Statements of Operations.
Based on our review of certain borrowers’ economic performance and underlying collateral value, we established allowances of $3.4 million and $1.0 million as of December 30, 2018 and December 31, 2017, respectively, for potentially uncollectible notes receivable. The following summarizes changes in our notes receivable allowance for doubtful accounts (in thousands):
|
Balance as of December 25, 2016 |
|
$ |
2,759 |
|
|
Recovered from costs and expenses |
|
|
(1,715) |
|
|
Deductions, including notes written off |
|
|
3 |
|
|
Balance as of December 31, 2017 |
|
|
1,047 |
|
|
Recovered from costs and expenses |
|
|
(393) |
|
|
Additions, net of notes written off |
|
|
2,715 |
|
|
Balance as of December 30, 2018 |
|
$ |
3,369 |
|
92
14. Accrued Expenses and Other Current Liabilities
Accrued expenses and other current liabilities consist of the following (in thousands):
|
|
|
December 30, |
|
December 31, |
|
||
|
|
|
2018 |
|
2017 |
|
||
|
Salaries, benefits and bonuses |
|
$ |
12,979 |
|
$ |
15,365 |
|
|
Insurance reserves, current |
|
|
33,769 |
|
|
19,847 |
|
|
Purchases |
|
|
11,336 |
|
|
11,364 |
|
|
Customer loyalty program (a) |
|
|
18,019 |
|
|
4,276 |
|
|
Rent |
|
|
3,932 |
|
|
3,794 |
|
|
Marketing |
|
|
4,539 |
|
|
1,481 |
|
|
Deposits |
|
|
1,415 |
|
|
3,091 |
|
|
Utilities |
|
|
1,478 |
|
|
1,382 |
|
|
Consulting and professional fees |
|
|
8,671 |
|
|
1,134 |
|
|
Legal costs |
|
|
2,093 |
|
|
804 |
|
|
Other |
|
|
7,481 |
|
|
7,755 |
|
|
Total |
|
$ |
105,712 |
|
$ |
70,293 |
|
|
|
|
|
|
|
|
|
|
|
(a) See Note 2 and Note 3 for additional information regarding the change in accounting for the customer loyalty program. |
|
||||||
|
|
|
|
|
|
|
|
|
15. Other Long-term Liabilities
Other long-term liabilities consist of the following (in thousands):
|
|
|
|
|
|
|
|
|
|
|
|
December 30, |
|
December 31, |
|
||
|
|
|
2018 |
|
2017 |
|
||
|
Deferred compensation plan |
|
$ |
27,796 |
|
$ |
28,690 |
|
|
Insurance reserves |
|
|
42,144 |
|
|
21,995 |
|
|
Accrued rent |
|
|
6,461 |
|
|
7,129 |
|
|
Other |
|
|
2,923 |
|
|
2,332 |
|
|
Total |
|
$ |
79,324 |
|
$ |
60,146 |
|
93
16. Other General Expenses
Other general expenses are included within General and administrative expenses and primarily consist of the following (in thousands):
|
|
|
Year Ended |
||||||
|
|
|
December 30, |
|
|
December 31, |
|
|
December 25, |
|
|
|
2018 |
|
|
2017 |
|
|
2016 |
|
Contribution to National Marketing Fund (a) |
$ |
10,000 |
|
$ |
- |
|
$ |
- |
|
Re-imaging costs for restaurants and write-off of brand assets (b) |
|
5,841 |
|
|
- |
|
|
- |
|
Provision (credit) for uncollectible accounts and notes receivable (c) |
|
3,338 |
|
|
(1,441) |
|
|
(450) |
|
Loss on disposition of fixed assets |
|
2,233 |
|
|
2,493 |
|
|
623 |
|
Papa Rewards (d) |
|
- |
|
|
1,046 |
|
|
442 |
|
Franchise support initiative (e) |
|
34 |
|
|
2,986 |
|
|
3,185 |
|
Other |
|
(1,725) |
|
|
343 |
|
|
361 |
|
Other general expenses |
|
19,721 |
|
|
5,427 |
|
|
4,161 |
|
Special Committee costs (f) |
|
19,474 |
|
|
- |
|
|
- |
|
Administrative expenses |
|
153,356 |
|
|
145,439 |
|
|
153,974 |
|
General and administrative expenses |
$ |
192,551 |
|
$ |
150,866 |
|
$ |
158,135 |
|
(a) |
Incremental contributions to National Marketing Fund to increase marketing and promotional activities during 2018. See Note 19 for additional information. |
|
(b) |
During 2018, the Company paid for certain re-imaging costs for both Company-owned and franchise units. See Note 19 for additional information. |
|
(c) |
Bad debt recorded on accounts receivable and notes receivable. |
|
(d) |
Online customer loyalty program costs in 2017 and 2016. In 2018, the Company adopted Topic 606 with updated accounting guidelines for loyalty programs which are now recorded as a reduction to domestic Company-owned restaurants revenue. See Notes 3 and 4 for additional information. |
|
(e) |
Franchise incentives include incentives to franchisees for opening new restaurants. In 2018, the Company adopted Topic 606 with updated accounting guidelines for new store equipment incentives, which are now recorded as a reduction of commissary revenues. See Notes 3 and 4 for additional information. |
|
(f) |
Costs totaling approximately $19.5 million associated with the activities of the Special Committee of the Board of Directors, including legal and advisory costs related to the review of a wide range of strategic opportunities for the Company that culminated in the recent strategic investment in the Company by affiliates of Starboard Value LP, as well as a third-party audit of the culture of Papa John’s. See Note 19 for additional information. |
17. Income Taxes
The following table presents the domestic and foreign components of income (loss) before income taxes for 2018, 2017 and 2016 (in thousands):
|
|
|
2018 |
|
2017 |
|
2016 |
|||
|
Domestic income / (loss) |
|
$ |
(10,471) |
|
$ |
122,828 |
|
$ |
146,063 |
|
Foreign income |
|
|
16,362 |
|
|
17,514 |
|
|
12,746 |
|
Total income |
|
$ |
5,891 |
|
$ |
140,342 |
|
$ |
158,809 |
94
A summary of the provision (benefit) for income tax follows (in thousands):
|
|
|
2018 |
|
2017 |
|
2016 |
|
|||
|
Current: |
|
|
|
|
|
|
|
|
|
|
|
Federal |
|
$ |
(5,324) |
|
$ |
28,951 |
|
$ |
32,477 |
|
|
Foreign |
|
|
4,736 |
|
|
4,602 |
|
|
2,669 |
|
|
State and local |
|
|
1,529 |
|
|
(234) |
|
|
2,947 |
|
|
Deferred |
|
|
1,705 |
|
|
498 |
|
|
11,624 |
|
|
Total income taxes |
|
$ |
2,646 |
|
$ |
33,817 |
|
$ |
49,717 |
|
Significant deferred tax assets (liabilities) follow (in thousands):
|
|
|
December 30, |
|
December 31, |
||
|
|
|
2018 |
|
2017 |
||
|
Accrued liabilities |
|
$ |
16,339 |
|
$ |
11,378 |
|
Accrued bonuses |
|
|
724 |
|
|
192 |
|
Other assets and liabilities |
|
|
10,705 |
|
|
7,913 |
|
Equity awards |
|
|
5,862 |
|
|
5,690 |
|
Other |
|
|
2,196 |
|
|
2,178 |
|
Foreign net operating losses |
|
|
1,555 |
|
|
2,773 |
|
Foreign tax credit carryforwards |
|
|
7,230 |
|
|
4,707 |
|
Total deferred tax assets |
|
|
44,611 |
|
|
34,831 |
|
Valuation allowance on foreign net operating and capital losses, foreign deferred tax assets, and foreign tax credit carryforwards |
|
|
(8,183) |
|
|
(7,415) |
|
Total deferred tax assets, net of valuation allowances |
|
|
36,428 |
|
|
27,416 |
|
|
|
|
|
|
|
|
|
Deferred expenses |
|
|
(5,576) |
|
|
(6,912) |
|
Accelerated depreciation |
|
|
(24,239) |
|
|
(19,228) |
|
Goodwill |
|
|
(12,645) |
|
|
(12,248) |
|
Other |
|
|
(1,064) |
|
|
(989) |
|
Total deferred tax liabilities |
|
|
(43,524) |
|
|
(39,377) |
|
Net deferred liability |
|
$ |
(7,096) |
|
$ |
(11,961) |
The Company had approximately $5.3 million and $9.4 million of foreign net operating loss carryovers as of December 30, 2018 and December 31, 2017, respectively. The Company had approximately $0.6 million and $2.1 million of valuation allowances primarily related to these foreign net operating losses as of December 30, 2018 and December 31, 2017, respectively. A substantial majority of our foreign net operating losses do not have an expiration date.
In addition, the Company had approximately $7.2 million in foreign tax credit carryforwards as of December 30, 2018 that expire 10 years from inception in years 2025 through 2028. Our ability to utilize these foreign tax credit carryforwards is dependent on our ability to generate foreign earnings in future years sufficient to claim foreign tax credits in excess of foreign taxes paid in those years. The Company provided a full valuation allowance of $7.2 million for these foreign tax credit carryforwards as we believe realization based on the more-likely-than-not criteria has not been met as of December 30, 2018.
95
The reconciliation of income tax computed at the U.S. federal statutory rate to income tax expense for the years ended December 30, 2018, December 31, 2017 and December 25, 2016 is as follows in both dollars and as a percentage of income before income taxes ($ in thousands):
|
|
|
2018 |
|
2017 |
|
2016 |
|
||||||||||||
|
|
|
Income Tax |
|
Income |
|
Income Tax |
|
Income |
|
Income Tax |
|
Income |
|
||||||
|
|
|
Expense |
|
Tax Rate |
|
Expense |
|
Tax Rate |
|
Expense |
|
Tax Rate |
|
||||||
|
|
|
|
|
|
|
|
|
|
|
|
|
|
|
|
|
|
|
|
|
|
Tax at U.S. federal statutory rate |
|
$ |
1,237 |
|
21.0 |
% |
|
$ |
49,120 |
|
35.0 |
% |
|
$ |
55,583 |
|
35.0 |
% |
|
|
State and local income taxes |
|
|
150 |
|
2.6 |
% |
|
|
2,432 |
|
1.7 |
% |
|
|
2,972 |
|
1.9 |
% |
|
|
Foreign income taxes |
|
|
4,879 |
|
82.8 |
% |
|
|
5,306 |
|
3.8 |
% |
|
|
3,143 |
|
2.0 |
% |
|
|
Income of consolidated partnerships |
|
|
|
|
|
|
|
|
|
|
|
|
|
|
|
|
|
|
|
|
attributable to noncontrolling interests |
|
|
(371) |
|
(6.3) |
% |
|
|
(1,554) |
|
(1.1) |
% |
|
|
(2,312) |
|
(1.4) |
% |
|
|
Non-qualified deferred compensation plan |
|
|
|
|
|
|
|
|
|
|
|
|
|
|
|
|
|
|
|
|
(income) loss |
|
|
483 |
|
8.2 |
% |
|
|
(1,236) |
|
(0.9) |
% |
|
|
(428) |
|
(0.3) |
% |
|
|
Excess tax benefits on equity awards |
|
|
447 |
|
7.6 |
% |
|
|
(1,879) |
|
(1.4) |
% |
|
|
— |
|
— |
% |
|
|
Remeasurement of deferred taxes |
|
|
— |
|
— |
% |
|
|
(7,020) |
|
(5.0) |
% |
|
|
— |
|
— |
% |
|
|
Tax credits |
|
|
(6,945) |
|
(117.9) |
% |
|
|
(6,909) |
|
(4.9) |
% |
|
|
(6,771) |
|
(4.3) |
% |
|
|
Disposition of China |
|
|
4,118 |
|
69.9 |
% |
|
|
— |
|
— |
% |
|
|
— |
|
|
% |
|
|
Other |
|
|
(1,352) |
|
17.5 |
% |
|
|
(4,443) |
|
(3.1) |
% |
|
|
(2,470) |
|
(1.6) |
% |
|
|
Total |
|
$ |
2,646 |
|
85.4 |
% |
|
$ |
33,817 |
|
24.1 |
% |
|
$ |
49,717 |
|
31.3 |
% |
|
Income taxes paid were $14.0 million in 2018, $37.2 million in 2017 and $35.1 million in 2016.
On December 22, 2017, the Tax Cuts and Jobs Act, (the “Tax Act”) was signed into law. The Tax Act contains substantial changes to the Internal Revenue Code, including a reduction of the corporate tax rate from 35% to 21% effective January 1, 2018. Upon enactment, 2017 deferred tax assets and liabilities were remeasured. This remeasurement yielded a benefit of approximately $7.0 million in the fourth quarter of 2017. At December 30, 2018 the Company has completed its analysis of the Tax Act. See Note 2 for additional information.
The Company files income tax returns in the U.S. federal jurisdiction and various states and foreign jurisdictions. The Company, with few exceptions, is no longer subject to U.S. federal, state and local, or non-U.S. income tax examinations by tax authorities for years before 2014. The Company is currently undergoing examinations by various tax authorities. The Company anticipates that the finalization of these current examinations and other issues could result in a decrease in the liability for unrecognized tax benefits (and a decrease of income tax expense) of approximately $240,000 during the next 12 months.
The Company had $2.0 million of unrecognized tax benefits at December 30, 2018 which, if recognized, would affect the effective tax rate. A reconciliation of the beginning and ending liability for unrecognized tax benefits excluding interest and penalties is as follows, which is recorded as an other long-term liability (in thousands):
|
Balance at December 25, 2016 |
|
$ |
4,827 |
|
|
Additions for tax positions of current year |
|
|
134 |
|
|
Additions for tax positions of prior years |
|
|
(2,862) |
|
|
Reductions for lapse of statute of limitations |
|
|
(71) |
|
|
Balance at December 31, 2017 |
|
|
2,028 |
|
|
Additions for tax positions of current year |
|
|
510 |
|
|
Reductions for tax positions of prior years |
|
|
(515) |
|
|
Reductions for lapse of statute of limitations |
|
|
— |
|
|
Balance at December 30, 2018 |
|
$ |
2,023 |
|
The Company recognizes accrued interest and penalties related to unrecognized tax benefits as part of income tax expense. The Company’s 2018 and 2017 income tax expense includes interest expense of $39,000 and a benefit of $416,000,
96
respectively. The Company has accrued approximately $165,000 and $124,000 for the payment of interest and penalties as of December 30, 2018 and December 31, 2017, respectively.
18. Related Party Transactions
Certain of our officers and directors own equity interests in entities that franchise restaurants. Following is a summary of full-year transactions and year-end balances with franchisees owned by related parties (in thousands):
|
|
|
2018 |
|
2017 |
|
2016 |
|
|||
|
Revenues from affiliates: |
|
|
|
|
|
|
|
|
||
|
North America commissary sales |
|
$ |
2,653 |
|
$ |
2,619 |
|
$ |
2,372 |
|
|
Other sales |
|
|
238 |
|
|
336 |
|
|
248 |
|
|
North America franchise royalties and fees |
|
|
429 |
|
|
439 |
|
|
413 |
|
|
Total |
|
$ |
3,320 |
|
$ |
3,394 |
|
$ |
3,033 |
|
|
|
|
December 30, |
|
December 31, |
|
||
|
|
|
2018 |
|
2017 |
|
||
|
Accounts receivable affiliates |
|
$ |
69 |
|
$ |
86 |
|
The revenues from affiliates were at rates and terms available to independent franchisees.
We had the following transactions with PJMF:
|
· |
Papa John’s contributed $10.0 million to the PJMF for additional advertising in 2018. See Notes 16 and 19 for additional information. |
|
· |
PJMF reimbursed Papa John’s $900,000, $1.6 million and $1.1 million in 2018, 2017, and 2016, respectively, for certain costs associated with national pizza giveaways awarded to our online loyalty program customers. |
|
· |
PJMF reimbursed Papa John’s $1.0 million in 2018, $1.3 million in 2017 and $1.4 million in 2016 for certain administrative services (i.e. marketing, accounting, and information services), graphic design services, services and expenses of our founder as former brand spokesman, and for software maintenance fees. |
We paid $300,000 in 2018, $446,000 in 2017 and $732,000 in 2016 for charter aircraft services provided by an entity owned by board member, John H. Schnatter. See Note 19 for additional information.
19. Litigation, Commitments and Contingencies
Litigation
The Company is involved in a number of lawsuits, claims, investigations and proceedings, including those specifically identified below, consisting of intellectual property, employment, consumer, commercial and other matters arising in the ordinary course of business. In accordance with ASC 450 “Contingencies,” the Company has made accruals with respect to these matters, where appropriate, which are reflected in the Company’s consolidated financial statements. We review these provisions at least quarterly and adjust these provisions to reflect the impact of negotiations, settlements, rulings, advice of legal counsel and other information and events pertaining to a particular case.
Ameranth, Inc. vs Papa John’s International, Inc. In August 2011, Ameranth, Inc. (“Ameranth”) filed various patent infringement actions against a number of defendants, including the Company, in the U.S. District Court for the Southern District of California (the “California Court”), which were consolidated by the California Court in October 2012 (the “Consolidated Case”). The Consolidated Case was stayed until January 2018 when Ameranth decided to proceed on only one patent, after the Company received a favorable decision by the Patent and Trademark Office on certain other patents. A Markman hearing was held in December 2017, which did not dispose of Ameranth’s claims, and the California Court set a jury trial date of for the claims against the Company. However, on September 25, 2018, the California Court granted the defendants’ Motion for Summary Judgment and found that the Ameranth patent at issue was invalid. Ameranth filed an appeal on October 25, 2018, which is currently being briefed by the parties. The California
97
Court has issued a stay of the case pending the outcome of the appeal, and the Company does not expect a decision until early 2020. The Company believes this case lacks merit and that it has strong defenses to all of the infringement claims. The Company intends to defend the suit vigorously. However, the Company is unable to predict the likelihood of success of Ameranth’s appeal. The Company has not recorded a liability related to this lawsuit as of December 30, 2018, as it does not believe a loss is probable or reasonably estimable.
Durling et al v. Papa John’s International, Inc., is a conditionally certified collective action filed in May 2016 in the United States District Court for the Southern District of New York (“the New York Court”), alleging that corporate restaurant delivery drivers were not properly reimbursed for vehicle mileage and expenses in accordance with the Fair Labor Standards Act ("FLSA"). In July 2018, the New York Court granted a motion to certify a conditional corporate collective class and the opt-in notice process has been completed. As of the close of the opt-in period on October 29, 2018, approximately 9,571 drivers opted into the collective class. On February 5, 2019, the Court denied Plaintiffs’ request to amend their complaint. The Company continues to deny any liability or wrongdoing in this matter and intends to vigorously defend this action. The Company has not recorded any liability related to this lawsuit it does not believe a loss is probable or reasonably estimable.
Other Matters
We have experienced negative publicity and consumer sentiment as a result of statements by the Company’s founder and former spokesperson John H. Schnatter in late 2017 and in July 2018, which contributed to our negative sales results in 2018. Mr. Schnatter resigned as Chairman of the Board on July 11, 2018, the same day that the media reported certain controversial statements made by Mr. Schnatter. A Special Committee of the Board of Directors consisting of all of the independent directors (the “Special Committee”) was formed on July 15, 2018 to evaluate and take action with respect to all of the Company’s relationships and arrangements with Mr. Schnatter. In addition, on July 27, 2018, the Company announced that the Board’s Lead Independent Director, Olivia F. Kirtley, had been unanimously appointed by the Board of Directors to serve as Chairman of the Company’s Board of Directors. Following its formation, the Special Committee terminated Mr. Schnatter’s Founder Agreement, which defined his role in the Company, among other things, as advertising and brand spokesperson for the Company. The Special Committee oversaw the previously announced external audit and investigation of all the Company’s existing processes, policies and systems related to diversity and inclusion, supplier and vendor engagement and Papa John’s culture, which is substantially complete. The Special Committee has delivered recommendations resulting from the audit to Company management, who will implement the recommendations, including initiatives and training regarding Diversity, Equity, and Inclusion. The Company is also implementing various branding and marketing initiatives, including a new advertising and marketing campaign.
In 2018, the Company incurred significant costs (defined as “Special charges”) as a result of the above-mentioned recent events. We incurred $50.7 million of Special charges as follows:
|
· |
franchise royalty reductions of approximately $15.4 million for all North America franchisees, |
|
· |
reimaging costs at domestic and international restaurants and replacement or write off of certain branded assets totaling $5.8 million, |
|
· |
contribution of $10.0 million to the Papa John’s Marketing Fund for additional advertising, and |
|
· |
legal and professional fees, which amounted to $19.5 million, for various matters relating to the review of a wide range of strategic opportunities for the Company that culminated in the recent strategic investment in the Company by affiliates of Starboard, as well as a previously announced external culture audit and other activities overseen by the Special Committee. |
The franchise royalty reductions reduce the amount of North America franchise royalties and fees revenues within our Consolidated Statements of Operations. All other costs associated with these events are included in General and administrative expenses within the Consolidated Statements of Operations. See Note 16 for additional details.
On July 26, 2018, John H. Schnatter filed a complaint in the Court of Chancery of the State of Delaware seeking to inspect certain books and records of the Company. On January 15, 2019, the Court of Chancery of the State of Delaware issued an opinion that Mr. Schnatter was entitled to review a limited set of documents and e-mails related to his change in position.
98
While the Company believes that the request for inspection is not for a proper purpose under Delaware law, the Company is complying with the decision of the Court of Chancery of the State of Delaware.
On August 30, 2018, Mr. Schnatter filed a lawsuit in the Court of Chancery of the State of Delaware against the Company, its chief executive officer, and the members of the Special Committee, claiming breaches of fiduciary duty. On September 21, 2018, Mr. Schnatter amended his complaint to drop the chief executive officer as a defendant. Mr. Schnatter seeks a number of injunctions forbidding the Special Committee from taking various actions and seeks to invalidate the Company’s stockholder rights plan. On February 13, 2019, Mr. Schnatter filed a second amended complaint challenging certain provisions of the Company’s stockholder rights plan and terms of the governance agreement with the third party investor, Starboard Value LP. The action was dismissed without prejudice pursuant to the terms of a March 4, 2019 agreement entered into between the Company and Mr. Schnatter.
On August 30, 2018, a class action lawsuit was filed in the United States District Court, Southern District of New York, Danker v. Papa John’s International, Inc. et al, on behalf of a class of investors who purchased or acquired stock in Papa John's through a period up to and including July 19, 2018. The complaint alleges violations of Sections l0(b) and 20(a) of the Securities Exchange Act of 1934. The District Court has appointed the Oklahoma Law Enforcement Retirement System to lead the case and has also issued a scheduling order for the case to proceed. An amended complaint was filed on February 13, 2019. The Company believes that it has valid and meritorious defenses to these suits and intends to vigorously defend against them. The Company has not recorded any liability related to these lawsuits as of December 30, 2018 as it does not believe a loss is probable or estimable.
Leases
We lease office, retail and commissary space under operating leases, which have an average term of five years and provide for at least one renewal. Certain leases further provide that the lease payments may be increased annually based on the fixed rate terms or adjustable terms such as the Consumer Price Index. We also lease the tractors and trailers used by our distribution subsidiary, (“PJFS”), for an average period of seven years. PJUK, our subsidiary located in the United Kingdom, also leases certain retail space, which is primarily subleased to our franchisees. Total sublease income for sites to our franchisees and other third parties, the majority of which were with PJUK, were $8.6 million, $7.4 million and $7.5 million in 2018, 2017 and 2016, respectively.
Total lease expense was $44.8 million, $45.0 million, and $45.0 million in 2018, 2017, and 2016, respectively.
Future lease costs and future expected sublease income as of December 30, 2018, are as follows (in thousands):
|
|
|
|
|
Future |
|
||
|
|
|
|
|
Expected |
|
||
|
|
|
Gross Lease |
|
Sublease |
|
||
|
Year |
|
Costs |
|
Income |
|
||
|
2019 |
|
$ |
40,834 |
|
$ |
8,079 |
|
|
2020 |
|
|
36,631 |
|
|
8,061 |
|
|
2021 |
|
|
31,159 |
|
|
7,818 |
|
|
2022 |
|
|
25,188 |
|
|
7,462 |
|
|
2023 |
18,694 |
7,182 |
|||||
|
Thereafter |
|
|
57,304 |
|
|
42,518 |
|
|
Total |
|
$ |
209,810 |
|
$ |
81,120 |
|
As a result of assigning our interest in obligations under property leases as a condition of the refranchising of certain restaurants, we are contingently liable for payment of approximately 124 domestic leases. These leases have varying terms, the latest of which expires in 2033. As of December 30, 2018, the estimated maximum amount of undiscounted payments the Company could be required to make in the event of nonpayment by the primary lessees was $11.9 million. The fair value of the guarantee is not material.
99
20. Equity Compensation
We award stock options, time-based restricted stock and performance-based restricted stock units from time to time under the Papa John’s International, Inc. 2018 Omnibus Incentive Plan. There are approximately 6.6 million shares of common stock authorized for issuance and remaining available under the 2018 Omnibus Incentive Plan as of December 30, 2018, which includes 5.3 million shares transferred from the Papa John’s International 2011 Omnibus Incentive Plan. Option awards are granted with an exercise price equal to the market price of the Company’s stock at the date of grant. Options outstanding as of December 30, 2018 generally expire ten years from the date of grant and generally vest over a three-year period.
We recorded stock-based employee compensation expense of $9.9 million in 2018, $10.4 million in 2017 and $10.1 million in 2016. The total related income tax benefit recognized in the Consolidated Statement of Operations was $2.3 million in 2018, $3.8 million in 2017 and $3.7 million in 2016. At December 30, 2018, there was $16.8 million of unrecognized compensation cost related to nonvested option awards and time-based restricted stock units, of which the Company expects to recognize $10.2 million in 2019, $6.2 million in 2020 and $400,000 in 2021.
Stock Options
Options exercised, which were issued from authorized shares, included 75,000 shares in 2018, 147,000 shares in 2017 and 478,000 shares in 2016. The total intrinsic value of the options exercised during 2018, 2017 and 2016 was $1.5 million, $5.2 million and $18.6 million, respectively. Cash received upon the exercise of stock options was $2.7 million, $6.3 million and $7.1 million during 2018, 2017 and 2016, respectively, and the related tax (expense) or benefits realized were approximately ($300,000), $1.9 million and $6.9 million during the corresponding periods.
Information pertaining to option activity during 2018 is as follows (number of options and aggregate intrinsic value in thousands):
|
|
|
|
|
|
|
|
Weighted |
|
|
|
|
|
|
|
|
|
|
|
|
Average |
|
|
|
|
|
|
|
|
|
Weighted |
|
Remaining |
|
|
|
|
|
|
|
|
Number |
|
Average |
|
Contractual |
|
Aggregate |
|
||
|
|
|
of |
|
Exercise |
|
Term |
|
Intrinsic |
|
||
|
|
|
Options |
|
Price |
|
(In Years) |
|
Value |
|
||
|
Outstanding at December 31, 2017 |
|
1,452 |
|
$ |
53.43 |
|
|
|
|
|
|
|
Granted |
|
456 |
|
|
59.23 |
|
|
|
|
|
|
|
Exercised |
|
(75) |
|
|
36.06 |
|
|
|
|
|
|
|
Cancelled |
|
(219) |
|
|
65.33 |
|
|
|
|
|
|
|
Outstanding at December 30, 2018 |
|
1,614 |
|
$ |
54.27 |
|
6.79 |
|
$ |
5,985 |
|
|
Exercisable at December 30, 2018 |
|
976 |
|
$ |
47.66 |
|
5.55 |
|
$ |
5,985 |
|
The following is a summary of the significant assumptions used in estimating the fair value of options granted in 2018, 2017 and 2016:
|
|
|
2018 |
|
2017 |
|
2016 |
|
|
|
|
|
|
|
|
|
|
|
Assumptions (weighted average): |
|
|
|
|
|
|
|
|
Risk-free interest rate |
|
2.7 |
% |
2.0 |
% |
1.3 |
% |
|
Expected dividend yield |
|
1.5 |
% |
1.0 |
% |
1.2 |
% |
|
Expected volatility |
|
27.6 |
% |
26.7 |
% |
27.4 |
% |
|
Expected term (in years) |
|
5.6 |
|
5.6 |
|
5.5 |
|
The risk-free interest rate for the periods within the contractual life of an option is based on the U.S. Treasury yield curve in effect at the time of grant. The expected dividend yield was estimated as the annual dividend divided by the market price of the Company’s shares on the date of grant. Expected volatility was estimated by using the Company’s historical share price volatility for a period similar to the expected life of the option.
100
Options granted generally vest in equal installments over three years and expire ten years after grant. The expected term for these options represents the period of time that options granted are expected to be outstanding and was calculated using historical experience.
The weighted average grant-date fair values of options granted during 2018, 2017 and 2016 was $15.27, $19.88 and $13.96, respectively. The Company granted options to purchase 456,000, 315,000 and 403,000 shares in 2018, 2017 and 2016, respectively.
Restricted Stock and Restricted Stock Units
We granted shares of restricted stock that are time-based and generally vest in equal installments over three years (260,000 in 2018, 73,000 in 2017 and 85,000 in 2016). Upon vesting, the shares are issued from treasury stock. These restricted shares are intended to focus participants on our long-range objectives, while at the same time serving as a retention mechanism. We consider time-based restricted stock awards to be participating securities because holders of such shares have non-forfeitable dividend rights. We declared dividends totaling $185,000 ($0.90 per share) in 2018, $128,000 ($0.85 per share) in 2017 and $117,000 ($0.75 per share) in 2016 to holders of time-based restricted stock.
Additionally, we granted stock settled performance-based restricted stock units to executive management (70,000 units in 2018, 13,000 units in 2017, and 14,000 units in 2016). The vesting of these awards (a three-year cliff vest) is dependent upon the Company’s achievement of a compounded annual growth rate of earnings per share and the achievement of certain sales and unit growth metrics. Upon vesting, the shares are issued from authorized shares.
The fair value of both time-based restricted stock and performance-based restricted stock units is based on the market price of the Company’s shares on the grant date. Information pertaining to these awards during 2018 is as follows (shares in thousands):
|
|
|
|
|
Weighted |
|
|
|
|
|
|
|
Average |
|
|
|
|
|
|
|
Grant-Date |
|
|
|
|
|
Shares |
|
Fair Value |
|
|
|
Total as of December 31, 2017 |
|
181 |
|
$ |
69.11 |
|
|
Granted |
|
330 |
|
|
57.37 |
|
|
Forfeited |
|
(54) |
|
|
64.67 |
|
|
Vested |
|
(87) |
|
|
66.59 |
|
|
Total as of December 30, 2018 |
|
370 |
|
$ |
59.84 |
|
21. Employee Benefit Plans
We have established the Papa John’s International, Inc. 401(k) Plan (the “401(k) Plan”), as a defined contribution benefit plan, in accordance with Section 401(k) of the Internal Revenue Code. The 401(k) Plan is open to employees who meet certain eligibility requirements and allows participating employees to defer receipt of a portion of their compensation and contribute such amount to one or more investment funds. At our discretion, we may make matching contribution payments, which are subject to vesting based on an employee’s length of service with us.
In addition, we maintain a non-qualified deferred compensation plan available to certain employees and directors. Under this plan, the participants may defer a certain amount of their compensation, which is credited to the participants’ accounts. The participant-directed investments associated with this plan are included in other long-term assets ($27.8 million and $28.6 million at December 30, 2018 and December 31, 2017, respectively) and the associated liabilities ($27.8 million and $28.7 million at December 30, 2018 and December 31, 2017, respectively) are included in other long-term liabilities in the accompanying Consolidated Balance Sheets.
101
At our discretion, we contributed a matching payment of 1.5% in 2018 and 3% in 2017 and 2016, up to a maximum of 6% deferred, in 2018, 2017 and 2016, of a participating employee’s earnings deferred into both the 401(k) Plan and the non-qualified deferred compensation plan. Such costs were $1.1 million in 2018, $2.3 million in 2017 and $2.6 million in 2016.
22. Segment Information
We have four reportable segments: domestic Company-owned restaurants, North America commissaries, North America franchising and international operations. The domestic Company-owned restaurant segment consists of the operations of all domestic (“domestic” is defined as contiguous United States) Company-owned restaurants and derives its revenues principally from retail sales of pizza and side items, including breadsticks, cheesesticks, chicken poppers and wings, dessert items and canned or bottled beverages. The North America commissary segment consists of the operations of our regional dough production and product distribution centers and derives its revenues principally from the sale and distribution of food and paper products to domestic Company-owned and franchised restaurants in the United States and Canada. The North America franchising segment consists of our franchise sales and support activities and derives its revenues from sales of franchise and development rights and collection of royalties from our franchisees located in the United States and Canada. The international segment principally consists of distribution sales to franchised Papa John’s restaurants located in the United Kingdom and Mexico and our franchise sales and support activities, which derive revenues from sales of franchise and development rights and the collection of royalties from our international franchisees. International franchisees are defined as all franchise operations outside of the United States and Canada. All other business units that do not meet the quantitative thresholds for determining reportable segments, which are not operating segments, we refer to as “all other,” which consists of operations that derive revenues from the sale, principally to Company-owned and franchised restaurants, of printing and promotional items, franchise contributions to marketing funds and information systems and related services used in restaurant operations, including our point-of-sale system, online and other technology-based ordering platforms.
Generally, we evaluate performance and allocate resources based on profit or loss from operations before income taxes and intercompany eliminations. Certain administrative and capital costs are allocated to segments based upon predetermined rates or actual estimated resource usage. We account for intercompany sales and transfers as if the sales or transfers were to third parties and eliminate the activity in consolidation.
Our reportable segments are business units that provide different products or services. Separate management of each segment is required because each business unit is subject to different operational issues and strategies. No single external customer accounted for 10% or more of our consolidated revenues (see Note 2).
102
Our segment information is as follows:
|
|
|
|
|
|
|
|
|
|
|
|
|
|
|
|
|
|
|
|||||||
|
(In thousands) |
|
2018 |
|
2017 |
|
2016 |
|
|
|||
|
Revenues |
|
|
|
|
|
|
|
|
|
|
|
|
Domestic Company-owned restaurants |
|
$ |
692,380 |
|
$ |
816,718 |
|
$ |
815,931 |
|
|
|
North America commissaries |
|
|
609,866 |
|
|
673,712 |
|
|
623,883 |
|
|
|
North America franchising |
|
|
79,293 |
|
|
106,729 |
|
|
102,980 |
|
|
|
International |
|
|
131,268 |
|
|
126,285 |
|
|
113,103 |
|
|
|
All others |
|
|
60,509 |
|
|
59,915 |
|
|
57,723 |
|
|
|
Total revenues |
|
$ |
1,573,316 |
|
$ |
1,783,359 |
|
$ |
1,713,620 |
|
|
|
|
|
|
|
|
|
|
|
|
|
|
|
|
Intersegment revenues: |
|
|
|
|
|
|
|
|
|
|
|
|
North America commissaries |
|
$ |
201,325 |
|
$ |
244,699 |
|
$ |
236,896 |
|
|
|
North America franchising |
|
|
2,965 |
|
|
3,342 |
|
|
2,869 |
|
|
|
International |
|
|
283 |
|
|
273 |
|
|
269 |
|
|
|
All others |
|
|
30,696 |
|
|
16,715 |
|
|
16,410 |
|
|
|
Total intersegment revenues |
|
$ |
235,269 |
|
$ |
265,029 |
|
$ |
256,444 |
|
|
|
|
|
|
|
|
|
|
|
|
|
|
|
|
Depreciation and amortization: |
|
|
|
|
|
|
|
|
|
|
|
|
Domestic Company-owned restaurants |
|
$ |
15,411 |
|
$ |
15,484 |
|
$ |
16,028 |
|
|
|
North America commissaries |
|
|
7,397 |
|
|
6,897 |
|
|
6,027 |
|
|
|
International |
|
|
1,696 |
|
|
2,018 |
|
|
2,188 |
|
|
|
All others |
|
|
8,513 |
|
|
5,276 |
|
|
3,830 |
|
|
|
Unallocated corporate expenses |
|
|
13,386 |
|
|
13,993 |
|
|
12,914 |
|
|
|
Total depreciation and amortization |
|
$ |
46,403 |
|
$ |
43,668 |
|
$ |
40,987 |
|
|
|
|
|
|
|
|
|
|
|
|
|
|
|
|
Income (loss) before income taxes: |
|
|
|
|
|
|
|
|
|
|
|
|
Domestic Company-owned restaurants (1) |
|
$ |
18,988 |
|
$ |
47,548 |
|
$ |
75,136 |
|
|
|
North America commissaries (2) |
|
|
27,961 |
|
|
47,844 |
|
|
46,325 |
|
|
|
North America franchising (3) |
|
|
70,732 |
|
|
96,298 |
|
|
91,669 |
|
|
|
International (4) |
|
|
14,399 |
|
|
15,888 |
|
|
11,408 |
|
|
|
All others (2) (5) |
|
|
(6,888) |
|
|
(179) |
|
|
1,467 |
|
|
|
Unallocated corporate expenses (2) (3) (5) |
|
|
(118,296) |
|
|
(66,099) |
|
|
(64,791) |
|
|
|
Elimination of intersegment (profits) losses |
|
|
(1,005) |
|
|
(958) |
|
|
(2,405) |
|
|
|
Total (loss) income before income taxes |
|
$ |
5,891 |
|
$ |
140,342 |
|
$ |
158,809 |
|
|
|
(1) |
Includes a $300,000 and $11.6 million refranchising loss/gain in 2018 and 2016, respectively. See Note 9 for additional information. |
|
(2) |
The Company refined its overhead allocation process in 2018 resulting in transfers of expenses from Unallocated corporate expenses of $13.2 million to other segments, primarily North America commissaries of $7.9 million and All others of $3.5 million for the year ended December 30, 2018. |
|
(3) |
Includes Special charges of $15.4 million in North America franchising and $35.3 million in Unallocated corporate expenses for the year ended December 30, 2018, as detailed in Note 16. See Note 19 for additional information. |
|
(4) |
Includes a $1.7 million and $1.4 million impairment loss in 2017 and 2016, respectively. See Note 9 for additional information. |
|
(5) |
Certain prior year amounts have been reclassified to conform to current year presentation. |
103
|
(In thousands) |
|
2018 |
|
2017 |
|
2016 |
|
|||
|
|
|
|
|
|
|
|
|
|
|
|
|
Property and equipment: |
|
|
|
|
|
|
|
|
|
|
|
Domestic Company-owned restaurants |
|
$ |
236,526 |
|
$ |
235,640 |
|
$ |
225,081 |
|
|
North America commissaries |
|
|
140,309 |
|
|
136,701 |
|
|
128,469 |
|
|
International |
|
|
17,218 |
|
|
17,257 |
|
|
15,673 |
|
|
All others |
|
|
71,880 |
|
|
58,977 |
|
|
55,586 |
|
|
Unallocated corporate assets |
|
|
199,239 |
|
|
191,924 |
|
|
192,548 |
|
|
Accumulated depreciation and amortization |
|
|
(438,278) |
|
|
(406,168) |
|
|
(386,884) |
|
|
Net property and equipment |
|
$ |
226,894 |
|
$ |
234,331 |
|
$ |
230,473 |
|
|
|
|
|
|
|
|
|
|
|
|
|
|
Expenditures for property and equipment: |
|
|
|
|
|
|
|
|
|
|
|
Domestic Company-owned restaurants |
|
$ |
13,568 |
|
$ |
15,245 |
|
$ |
16,257 |
|
|
North America commissaries |
|
|
3,994 |
|
|
14,767 |
|
|
14,164 |
|
|
International |
|
|
986 |
|
|
1,884 |
|
|
4,390 |
|
|
All others |
|
|
13,438 |
|
|
8,239 |
|
|
7,897 |
|
|
Unallocated corporate |
|
|
10,042 |
|
|
12,458 |
|
|
12,846 |
|
|
Total expenditures for property and equipment |
|
$ |
42,028 |
|
$ |
52,593 |
|
$ |
55,554 |
|
23. Quarterly Data - Unaudited, in Thousands, except Per Share Data
Our quarterly select financial data is as follows:
|
|
|
Quarter |
|
||||||||||
|
2018 |
|
1st |
|
2nd |
|
3rd |
|
4th |
|
||||
|
|
|
|
|
|
|
|
|
|
|
|
|
|
|
|
Total revenues |
|
$ |
427,369 |
|
$ |
407,959 |
|
$ |
364,007 |
|
$ |
373,981 |
|
|
Operating income (loss) |
|
|
27,317 |
|
|
25,367 |
|
|
(13,990) |
|
|
(8,314) |
|
|
Net income (loss) attributable to the Company (a) |
|
|
16,737 |
|
|
11,791 |
|
|
(13,033) |
|
|
(13,849) |
|
|
Basic earnings per common share (a) |
|
$ |
0.50 |
|
$ |
0.37 |
|
$ |
(0.41) |
|
$ |
(0.44) |
|
|
Diluted earnings per common share (a) |
|
$ |
0.50 |
|
$ |
0.36 |
|
$ |
(0.41) |
|
$ |
(0.44) |
|
|
Dividends declared per common share |
|
$ |
0.225 |
|
$ |
0.225 |
|
$ |
0.225 |
|
$ |
0.225 |
|
|
|
|
Quarter |
|
||||||||||
|
2017 |
|
1st |
|
2nd |
|
3rd |
|
4th |
|
||||
|
|
|
|
|
|
|
|
|
|
|
|
|
|
|
|
Total revenues |
|
$ |
449,266 |
|
$ |
434,778 |
|
$ |
431,709 |
|
$ |
467,606 |
|
|
Operating income |
|
|
43,681 |
|
|
37,217 |
|
|
33,515 |
|
|
36,604 |
|
|
Net income attributable to the Company (b) |
|
|
28,428 |
|
|
23,538 |
|
|
21,817 |
|
|
28,509 |
|
|
Basic earnings per common share (b) |
|
$ |
0.78 |
|
$ |
0.66 |
|
$ |
0.61 |
|
$ |
0.82 |
|
|
Diluted earnings per common share (b) |
|
$ |
0.77 |
|
$ |
0.65 |
|
$ |
0.60 |
|
$ |
0.81 |
|
|
Dividends declared per common share |
|
$ |
0.200 |
|
$ |
0.200 |
|
$ |
0.225 |
|
$ |
0.225 |
|
|
(a) |
The year ended December 30, 2018 was impacted by the following: |
i. The second quarter of 2018 includes an after income tax loss of $1.6 million and an unfavorable impact of $0.05 on basic and diluted EPS from the sale of our Company-owned stores in China. See Note 9 for additional information.
ii. The second quarter of 2018 also includes a tax increase of $2.4 million and an unfavorable impact of $0.07 on basic and diluted EPS related to the refranchising our China stores. See Note 17 for additional information.
104
iii. The third and fourth quarters of 2018 include an after income tax loss of $19.3 million and $19.7 million, respectively, and unfavorable impact on diluted EPS of $0.61 and $0.63, respectively, from Special charges. See Note 19 for additional information.
iv. The fourth quarter of 2018 includes an after tax gain of $1.3 million and a favorable impact of $0.04 on basic and diluted EPS related to the Company’s refranchising of Company-owned restaurants.
|
(b) |
The year ended December 31, 2017 was impacted by the following: |
i. The fourth quarter of 2017 includes an after income tax loss of $1.3 million and an unfavorable impact of $0.04 on basic and diluted EPS from an impairment charge related to our Company-owned stores in China. See Note 9 for additional information.
ii. The fourth quarter of 2017 also includes a tax benefit of $7.0 million and favorable impact of $0.20 on basic and diluted EPS related to the “Tax Cuts and Jobs Act” that was signed in 2017. See Note 17 for additional information.
iii. The fourth quarter of 2017 includes an after income tax benefit of $3.9 million and favorable impact on diluted EPS of $0.11 from a 14th week of operations.
(c)All quarterly information except for the fourth quarter of 2017, is presented in 13-week periods. The fourth quarter of 2017 includes a 14-week period, which increased income after tax approximately $3.9 million, or $0.11 per diluted share.
Quarterly earnings per share on a full-year basis may not agree to the Consolidated Statements of Operations due to rounding.
105
24. Reclassifications of Prior Year Balances
|
Papa John's International, Inc. and Subsidiaries |
||||||||
|
Consolidated Statements of Operations |
||||||||
|
Summary of Statement of Operations Presentation Reclassifications |
||||||||
|
|
|
|
|
|
|
|
|
|
|
|
|
Year Ended December 31, 2017 |
||||||
|
(In thousands, except per share amounts) |
As reported |
|
Reclassifications |
|
Adjusted |
|||
|
Revenues: |
|
|
|
|
|
|
|
|
|
North America commissary and other sales (1) |
$ |
733,627 |
|
$ |
(59,915) |
|
$ |
673,712 |
|
International (2) |
|
126,285 |
|
|
(12,264) |
|
|
114,021 |
|
Other revenues (1) (2) |
|
- |
|
|
72,179 |
|
|
72,179 |
|
|
|
|
|
|
|
|
|
|
|
Costs and expenses: |
|
|
|
|
|
|
|
|
|
North America commissary and other expenses (1) |
$ |
685,206 |
|
$ |
(53,669) |
|
$ |
631,537 |
|
International expenses (2) |
|
78,971 |
|
|
(8,349) |
|
|
70,622 |
|
Other expenses (1) (2) (3) |
|
- |
|
|
69,335 |
|
|
69,335 |
|
General and administrative expenses (3) |
|
158,183 |
|
|
(7,317) |
|
|
150,866 |
|
|
|
|
|
|
|
|
|
|
|
|
|
|
|
|
|
|
|
|
|
|
|
Year Ended December 25, 2016 |
||||||
|
(In thousands, except per share amounts) |
As reported |
|
Reclassifications |
|
Adjusted |
|||
|
Revenues: |
|
|
|
|
|
|
|
|
|
North America commissary and other sales (1) |
$ |
681,606 |
|
$ |
(57,723) |
|
$ |
623,883 |
|
International (2) |
|
113,103 |
|
|
(12,199) |
|
|
100,904 |
|
Other revenues (1) (2) |
|
- |
|
|
69,922 |
|
|
69,922 |
|
|
|
|
|
|
|
|
|
|
|
Costs and expenses: |
|
|
|
|
|
|
|
|
|
North America commissary and other expenses (1) |
$ |
631,475 |
|
$ |
(51,641) |
|
$ |
579,834 |
|
International expenses (2) |
|
71,509 |
|
|
(8,935) |
|
|
62,574 |
|
Other expenses (1) (2) (3) |
|
- |
|
|
66,253 |
|
|
66,253 |
|
General and administrative expenses (3) |
|
163,812 |
|
|
(5,677) |
|
|
158,135 |
As shown in the table above we have reclassified certain prior year amounts within the Consolidated Statements of Operations for the years ended December 31, 2017 and December 25, 2016 in order to conform with current year presentation. These reclassifications had no effect on previously reported total consolidated revenues, total costs and expenses and net income.
|
|
|
(1) |
Includes reclassification of previous amounts reported in North America commissary and other sales and expenses including print and promotional items, information systems and related services used in restaurant operations, including our point of sale system, online and other technology-based ordering platforms. |
|
(2) |
Includes reclassification of previous amounts reported in International related to advertising expenses and rental income and expenses for United Kingdom head leases which are subleased to United Kingdom franchisees. |
|
(3) |
Includes reclassification of various technology related expenditures for fee-based services discussed in (1) above and advertising expenses to be consistent with 2018 presentation. |
106
Item 9. Changes in and Disagreements with Accountants on Accounting and Financial Disclosure
On August 4, 2017, we dismissed Ernst & Young LLP as our independent registered public accounting firm and appointed KPMG LLP as our independent registered public accounting firm for the Company’s fiscal year ending December 30, 2018. The engagement of KPMG LLP was approved by the Audit Committee of the Board of Directors. We filed a Current Report on Form 8-K with the Securities and Exchange Commission on August 4, 2017 announcing the change in auditors, in which filing is incorporated by reference herein. Our independent registered accounting firm’s report on the financial statements for each of the past two years did not contain an adverse opinion or a disclaimer of opinion, and was not qualified or modified as to uncertainty, audit scope, or accounting principles.
We have reclassified certain prior year amounts within the Consolidated Statements of Operations for the years ended December 31, 2017 and December 25, 2016 in order to conform with current year presentation. These reclassifications had no effect on previously reported total consolidated revenues, total costs and expenses and net income. See “Note 24” of “Notes to Consolidated Financial Statements” for additional information. Our previous auditors, Ernst & Young LLP, issued a dual-dated opinion on the previous year’s financial statements regarding these reclassifications.
In connection with the foregoing change in accountants, there was no disagreement of the type described in paragraph (a)(1)(iv) of Item 304 of Regulation S-K or any reportable event as described in paragraph (a)(1)(v) of such Item.
107
Item 9A. Controls and Procedures
|
(a) |
Evaluation of Disclosure Controls and Procedures |
As of the end of the period covered by this report, we carried out an evaluation, under the supervision and with the participation of our management, including our Chief Executive Officer (“CEO”) and Chief Financial Officer (“CFO”), of the effectiveness of our disclosure controls and procedures (as defined in Rules 13a-15(e) and 15d-15(e) of the Exchange Act). Based upon this evaluation, the CEO and CFO concluded that the Company’s disclosure controls and procedures are effective.
|
(b) |
Management’s Report on our Internal Control over Financial Reporting |
Our management is responsible for establishing and maintaining adequate internal control over financial reporting, as such term is defined in Rule 13a-15(f) promulgated under the Exchange Act. Our internal control system is designed to provide reasonable assurance to our management and the board of directors regarding the preparation and fair presentation of published financial statements. All internal control systems, no matter how well designed, have inherent limitations. Therefore, even those systems determined to be effective can provide only reasonable assurance with respect to financial statement preparation and presentation.
Under the supervision and with the participation of our management, including our CEO and CFO, we conducted an evaluation of the effectiveness of our internal control over financial reporting based on the criteria established in Internal Control — Integrated Framework issued by the Committee of Sponsoring Organizations (COSO) of the Treadway Commission (2013 Framework). Based on our evaluation under the COSO 2013 Framework, our management concluded that our internal control over financial reporting was effective as of December 30, 2018.
KPMG LLP, an independent registered public accounting firm, has audited the 2018 Consolidated Financial Statements included in this Annual Report on Form 10-K and, as part of its audit, has issued an attestation report, included in Item 8. Financial Statement and Supplemental Data, on the effectiveness of our internal control over financial reporting.
|
(c) |
Changes in Internal Control over Financial Reporting |
During the quarter ended December 30, 2018, management remediated an identified material weakness in internal control over financial reporting related to the review of manual journal entries. No misstatement arose as a result of this deficiency. For the year ended December 30, 2018, management remediated the material weakness by adding controls over the review and approval of manual journal entries. The Company will continue to monitor these new controls and implement additional enhancements in 2019.
Except for the foregoing, there were no changes in internal control over financial reporting during the quarter ended December 30, 2018 that have materially affected, or are reasonably likely to materially affect, our internal control over financial reporting.
None.
108
Item 10. Directors, Executive Officers and Corporate Governance
Information regarding executive officers is included above under the caption “Executive Officers of the Registrant” at the end of Part I of this Report. Other information regarding directors, executive officers and corporate governance appearing under the captions “Corporate Governance,” “Item 1, Election of Directors,” “Section 16(a) Beneficial Ownership Reporting Compliance” and “Executive Compensation / Compensation Discussion and Analysis” is incorporated by reference from the Company’s definitive proxy statement, which will be filed with the Securities and Exchange Commission no later than 120 days after the end of the fiscal year covered by this Report.
We have adopted a written code of ethics that applies to our directors, officers and employees. We intend to post all required disclosures concerning any amendments to or waivers from, our code of ethics on our website to the extent permitted by NASDAQ. Our code of ethics can be found on our website, which is located at www.papajohns.com.
Item 11. Executive Compensation
Information regarding executive compensation appearing under the captions “Executive Compensation / Compensation Discussion and Analysis,” “Compensation Committee Report” and “Certain Relationships and Related Transactions — Compensation Committee Interlocks and Insider Participation” is incorporated by reference from the Company’s definitive proxy statement, which will be filed with the Securities and Exchange Commission no later than 120 days after the end of the fiscal year covered by this Report.
Item 12. Security Ownership of Certain Beneficial Owners and Management and Related Stockholder Matters
The following table provides information as of December 30, 2018 regarding the number of shares of the Company’s common stock that may be issued under the Company’s equity compensation plans.
|
|
|
|
|
|
|
|
(c) |
|
|
|
(a) |
|
(b) |
|
Number of securities |
|
|
|
|
Number of |
|
Weighted |
|
remaining available |
|
|
|
|
securities to be |
|
average |
|
for future issuance |
|
|
|
|
issued upon exercise |
|
exercise price |
|
under equity |
|
|
|
|
of outstanding |
|
of outstanding |
|
compensation plans, |
|
|
|
|
options, warrants |
|
options, warrants |
|
excluding securities |
|
|
Plan Category |
|
and rights |
|
and rights |
|
reflected in column (a) |
|
|
|
|
|
|
|
|
|
|
|
Equity compensation plans approved by security holders |
|
1,614,551 |
|
$ |
54.27 |
|
6,556,075 |
|
Equity compensation plans not approved by security holders * |
|
164,605 |
|
|
|
|
|
|
Total |
|
1,779,156 |
|
$ |
54.27 |
|
6,556,075 |
*Represents shares of common stock issuable pursuant to the non-qualified deferred compensation plan. The weighted average exercise price (column b) does not include any assumed price for issuance of shares pursuant to the non-qualified deferred compensation plan.
Information regarding security ownership of certain beneficial owners and management and related stockholder matters appearing under the caption “Security Ownership of Certain Beneficial Owners and Management” is incorporated by reference from the Company’s definitive proxy statement, which will be filed with the Securities and Exchange Commission no later than 120 days after the end of the fiscal year covered by this Report.
Item 13. Certain Relationships and Related Transactions, and Director Independence
Information regarding certain relationships and related transactions, and director independence appearing under the captions “Corporate Governance” and “Certain Relationships and Related Transactions” is incorporated by reference from the Company’s definitive proxy statement, which will be filed with the Securities and Exchange Commission no later than 120 days after the end of the fiscal year covered by this Report.
109
Item 14. Principal Accounting Fees and Services
Information regarding principal accounting fees and services appearing under the caption “Ratification of the Selection of Independent Auditors” is incorporated by reference from the Company’s definitive proxy statement, which will be filed with the Securities and Exchange Commission no later than 120 days after the end of the fiscal year covered by this Report.
Item 15. Exhibits, Financial Statement Schedules
(a)(1)Financial Statements:
The following Consolidated Financial Statements, notes related thereto and reports of independent auditors are included in Item 8 of this Report:
|
· |
Reports of Independent Registered Public Accounting Firms |
|
· |
Consolidated Statements of Operations for the years ended December 30, 2018, December 31, 2017 and December 25, 2016 |
|
· |
Consolidated Statements of Comprehensive Income for the years ended December 30, 2018, December 31, 2017 and December 25, 2016 |
|
· |
Consolidated Balance Sheets as of December 30, 2018 and December 31, 2017 |
|
· |
Consolidated Statements of Stockholders’ Equity (Deficit) for the years ended December 30, 2018, December 31, 2017 and December 25, 2016 |
|
· |
Consolidated Statements of Cash Flows for the years ended December 30, 2018, December 31, 2017 and December 25, 2016 |
|
· |
Notes to Consolidated Financial Statements |
(a)(2)Financial Statement Schedules:
110
Schedule II - Valuation and Qualifying Accounts
|
|
|
|
|
|
Charged to |
|
|
|
|
|
|
|
|
|
|
|
Balance at |
|
(recovered from) |
|
|
|
|
|
Balance at |
|||
|
|
|
Beginning of |
|
Costs and |
|
Additions / |
|
|
End of |
||||
|
Classification |
|
Year |
|
Expenses |
|
(Deductions) |
|
|
Year |
||||
|
(in thousands) |
|
|
|
|
|
|
|
|
|
|
|
|
|
|
|
|
|
|
|
|
|
|
|
|
|
|
|
|
|
Fiscal year ended December 30, 2018 |
|
|
|
|
|
|
|
|
|
|
|
|
|
|
|
|
|
|
|
|
|
|
|
|
|
|
|
|
|
Deducted from asset accounts: |
|
|
|
|
|
|
|
|
|
|
|
|
|
|
Reserve for uncollectible accounts receivable |
|
$ |
2,271 |
|
$ |
5,154 |
|
$ |
(5,308) |
(1) |
|
$ |
2,117 |
|
Reserve for franchisee notes receivable |
|
|
1,047 |
|
|
(393) |
|
|
2,715 |
(1) |
|
|
3,369 |
|
Valuation allowance on deferred tax assets |
|
|
7,415 |
|
|
(1,754) |
|
|
2,522 |
|
|
|
8,183 |
|
|
|
$ |
10,733 |
|
$ |
3,007 |
|
$ |
(71) |
|
|
$ |
13,669 |
|
|
|
|
|
|
|
|
|
|
|
|
|
|
|
|
Fiscal year ended December 31, 2017 |
|
|
|
|
|
|
|
|
|
|
|
|
|
|
|
|
|
|
|
|
|
|
|
|
|
|
|
|
|
Deducted from asset accounts: |
|
|
|
|
|
|
|
|
|
|
|
|
|
|
Reserve for uncollectible accounts receivable |
|
$ |
1,486 |
|
$ |
1,744 |
|
$ |
(959) |
(1) |
|
$ |
2,271 |
|
Reserve for franchisee notes receivable |
|
|
2,759 |
|
|
(1,715) |
|
|
3 |
(1) |
|
|
1,047 |
|
Valuation allowance on deferred tax assets |
|
|
5,462 |
|
|
(407) |
|
|
2,360 |
|
|
|
7,415 |
|
|
|
$ |
9,707 |
|
$ |
(378) |
|
$ |
1,404 |
|
|
$ |
10,733 |
|
|
|
|
|
|
|
|
|
|
|
|
|
|
|
|
Fiscal year ended December 25, 2016 |
|
|
|
|
|
|
|
|
|
|
|
|
|
|
|
|
|
|
|
|
|
|
|
|
|
|
|
|
|
Deducted from asset accounts: |
|
|
|
|
|
|
|
|
|
|
|
|
|
|
Reserve for uncollectible accounts receivable |
|
$ |
2,447 |
|
$ |
659 |
|
$ |
(1,620) |
(1) |
|
$ |
1,486 |
|
Reserve for franchisee notes receivable |
|
|
3,653 |
|
|
(250) |
|
|
(644) |
(1) |
|
|
2,759 |
|
Valuation allowance on deferred tax assets |
|
|
2,866 |
|
|
249 |
|
|
2,347 |
|
|
|
5,462 |
|
|
|
$ |
8,966 |
|
$ |
658 |
|
$ |
83 |
|
|
$ |
9,707 |
|
(1) |
Uncollectible accounts written off and reclassifications between accounts and notes receivable reserves. |
All other schedules for which provision is made in the applicable accounting regulation of the Securities and Exchange Commission are not required under the related instructions or are inapplicable and, therefore, have been omitted.
(a)(3)Exhibits:
The exhibits listed in the accompanying index to Exhibits are filed as part of this Form 10-K.
Item 16. Summary
None.
111
EXHIBIT INDEX
|
Exhibit |
|
|
|
|
Number |
|
Description of Exhibit |
|
|
|
|
|
|
|
3.1 |
|
|
|
|
|
|
|
|
|
3.3 |
|
|
|
|
|
|
|
|
|
3.4 |
|
|
|
|
|
|
|
|
|
4.1 |
|
|
|
|
|
|
|
|
|
4.2 |
|
|
|
|
|
|
|
|
|
4.3 |
|
|
|
|
|
|
|
|
|
4.4 |
|
|
|
|
|
|
|
|
|
4.5 |
|
|
|
|
|
|
|
|
|
10.1 |
|
Form of Papa John’s International, Inc. Director Indemnification Agreement. |
|
|
|
|
|
|
|
10.2 |
|
Form of Papa John’s International, Inc. Officer Indemnification Agreement. |
|
|
|
|
|
|
|
10.3 |
|
|
|
|
|
|
|
|
|
10.4 |
|
|
|
|
|
|
|
|
112
|
Exhibit |
|
|
|
|
Number |
|
Description of Exhibit |
|
|
|
|
|
|
|
10.5 |
|
|
|
|
|
|
|
|
|
10.6 |
|
|
|
|
|
|
|
|
|
10.7 |
|
|
|
|
|
|
|
|
|
10.8 |
|
|
|
|
|
|
|
|
|
10.9* |
|
|
|
|
|
|
|
|
|
10.10* |
|
|
|
|
|
|
|
|
|
10.11* |
|
|
|
|
|
|
|
|
|
10.12* |
|
|
|
|
|
|
|
|
|
10.13* |
|
|
|
|
|
|
|
|
|
10.14* |
|
|
|
|
|
|
|
|
|
10.15* |
|
|
|
|
|
|
|
|
113
|
Exhibit |
|
|
|
|
Number |
|
Description of Exhibit |
|
|
|
|
|
|
|
10.16* |
|
|
|
|
|
|
|
|
|
10.17 |
|
|
|
|
|
|
|
|
|
10.18 |
|
|
|
|
|
|
|
|
|
10.19 |
|
|
|
|
|
|
|
|
|
10.20* |
|
|
|
|
|
|
|
|
|
10.21* |
|
|
|
|
|
|
|
|
|
10.22* |
|
|
|
|
|
|
|
|
|
10.23* |
|
|
|
|
|
|
|
|
|
10.24 |
|
|
|
|
|
|
|
|
|
10.25 |
|
|
|
|
|
|
|
|
|
10.26* |
|
|
|
|
|
|
|
|
|
10.27* |
|
|
|
|
|
|
|
|
114
|
Exhibit |
|
|
|
|
Number |
|
Description of Exhibit |
|
|
|
|
|
|
|
10.28* |
|
|
|
|
|
|
|
|
|
21 |
|
|
|
|
|
|
|
|
|
23.1 |
|
|
|
|
|
|
|
|
|
23.2 |
|
|
|
|
|
|
|
|
|
31.1 |
|
Section 302 Certification of Chief Executive Officer Pursuant to Exchange Act Rule 13a-15(e). |
|
|
|
|
|
|
|
31.2 |
|
Section 302 Certification of Chief Financial Officer Pursuant to Exchange Act Rule 13a-15(e). |
|
|
|
|
|
|
|
32.1 |
|
|
|
|
|
|
|
|
|
32.2 |
|
|
|
|
|
|
|
|
|
101 |
|
Financial statements from the Annual Report on Form 10-K of Papa John’s International, Inc. for the year ended December 30, 2018, filed on March 8, 2019 formatted in XBRL: (i) the Consolidated Statements of Operations, (ii) the Consolidated Statements of Comprehensive Income, (iii) the Consolidated Balance Sheets, (iv) the Consolidated Statements of Stockholders’ Equity (Deficit), (v) the Consolidated Statements of Cash Flows and (vi) the Notes to Consolidated Financial Statements. |
|
* Compensatory plan required to be filed as an exhibit pursuant to Item 15(c) of Form 10-K.
115
SIGNATURES
Pursuant to the requirements of Section 13 or 15(d) of the Securities Exchange Act of 1934, the Registrant has duly caused this report to be signed on its behalf by the undersigned, thereunto duly authorized.
|
Date: March 8, 2019 |
|
|
PAPA JOHN’S INTERNATIONAL, INC. |
|
|
|
|
|
|
|
|
|
|
By: |
/s/ Steve M. Ritchie |
|
|
|
|
|
Steve M. Ritchie |
|
|
|
|
|
President and Chief Executive Officer
|
|
Pursuant to the requirements of the Securities Exchange Act of 1934, this report has been signed below by the following persons on behalf of the Registrant and in the capacities and on the dates indicated.
|
Signature |
|
Title |
|
Date |
|
|
|
|
|
|
|
|
|
/s/ Jeffrey C. Smith |
|
Chairman |
|
March 8, 2019 |
|
|
Jeffrey C. Smith |
|
|
|
|
|
|
|
|
|
|
|
|
|
/s/ Steve M. Ritchie |
|
President and Chief Executive Officer |
|
March 8, 2019 |
|
|
Steve M. Ritchie |
|
(Principal Executive Officer and Director) |
|
|
|
|
|
|
|
|
|
|
|
/s/ Joseph H. Smith IV |
|
Senior Vice President, Chief Financial |
|
March 8, 2019 |
|
|
Joseph H. Smith IV |
|
Officer (Principal Financial Officer and |
|
|
|
|
|
|
Principal Accounting Officer) |
|
|
|
|
|
|
|
|
|
|
|
/s/ Christopher L. Coleman |
|
Director |
|
March 8, 2019 |
|
|
Christopher L. Coleman |
|
|
|
|
|
|
|
|
|
|
|
|
|
/s/ Olivia F. Kirtley |
|
Director |
|
March 8, 2019 |
|
|
Olivia F. Kirtley |
|
|
|
|
|
|
|
|
|
|
|
|
|
/s/ Laurette T. Koellner |
|
Director |
|
March 8, 2019 |
|
|
Laurette T. Koellner |
|
|
|
|
|
|
|
|
|
|
|
|
|
/s/ Sonya E. Medina |
|
Director |
|
March 8, 2019 |
|
|
Sonya E. Medina |
|
|
|
|
|
|
|
|
|
|
|
|
|
/s/ Anthony M. Sanfilippo |
|
Director |
|
March 8, 2019 |
|
|
Anthony M. Sanfilippo |
|
|
|
|
|
|
|
|
|
|
|
|
|
|
|
Director |
|
|
|
|
John H. Schnatter |
|
|
|
|
|
|
|
|
|
|
|
|
|
/s/ Mark S. Shapiro |
|
Director |
|
March 8, 2019 |
|
|
Mark S. Shapiro |
|
|
|
|
|
116