10-K: Annual report pursuant to Section 13 and 15(d)
Published on February 24, 2022
UNITED STATES
SECURITIES AND EXCHANGE COMMISSION
Washington, D.C. 20549
FORM
(Mark One)
Annual Report pursuant to Section 13 or 15(d) of the Securities Exchange Act of 1934 |
For the fiscal year ended
or
Transition report pursuant to Section 13 or 15(d) of the Securities Exchange Act of 1934 |
For the transition period from to
Commission File Number:
PAPA JOHN’S INTERNATIONAL, INC.
(Exact name of registrant as specified in its charter)
(State or other jurisdiction of |
(I.R.S. Employer |
|
incorporation or organization) |
Identification No.) |
(Address of principal executive offices) |
(Zip Code) |
(
(Registrant’s telephone number, including area code)
Securities registered pursuant to Section 12(b) of the Act:
(Title of Each Class) |
|
Trading Symbol(s) |
|
(Name of each exchange on which registered) |
Securities registered pursuant to Section 12(g) of the Act: None
Indicate by check mark if the registrant is a well-known seasoned issuer, as defined in Rule 405 of the Securities Act.
Indicate by check mark if the registrant is not required to file reports pursuant to Section 13 or Section 15(d) of the Act. Yes ☐
Indicate by check mark whether the registrant (1) has filed all reports required to be filed by Section 13 or 15(d) of the Securities Exchange Act of 1934 during the preceding 12 months (or for such shorter period that the registrant was required to file such reports), and (2) has been subject to such filing requirements for the past 90 days.
Indicate by check mark whether the registrant has submitted electronically every Interactive Data File required to be submitted pursuant to Rule 405 of Regulation S-T (§232.405 of this chapter) during the preceding 12 months (or for such shorter period that the registrant was required to submit such files).
Indicate by check mark whether the registrant is a large accelerated filer, an accelerated filer, a non-accelerated filer, a smaller reporting company or an emerging growth company. See the definitions of “large accelerated filer,” “accelerated filer” “smaller reporting company” and “emerging growth company” in Rule 12b-2 of the Exchange Act.
Accelerated filer ☐ |
||
Non-accelerated filer ☐ |
Smaller reporting company Emerging growth company
|
If an emerging growth company, indicate by check mark if the Registrant has elected not to use the extended transition period for complying with any new or revised financial accounting standards provided pursuant to Section 13(a) of the Exchange Act.☐
Indicate by check mark whether the registrant has filed a report on and attestation to its management’s assessment of the effectiveness of its internal control over financial reporting under Section 404(b) of the Sarbanes-Oxley Act (15 U.S.C. 7262(b)) by the registered public accounting firm that prepared or issued its audit report.
Indicate by check mark whether the registrant is a shell company (as defined in Rule 12b-2 of the Act). Yes
The aggregate market value of the common stock held by non-affiliates of the Registrant, computed by reference to the closing sale price on The Nasdaq Stock Market as of the last business day of the Registrant’s most recently completed second fiscal quarter, June 27, 2021, was $
As of February 17, 2022, there were
DOCUMENTS INCORPORATED BY REFERENCE
Portions of the Registrant’s Proxy Statement for the Annual Meeting of Stockholders to be held April 27, 2022 are incorporated by reference into Part III of this annual report where indicated.
TABLE OF CONTENTS
2
PART I
Item 1. Business
General
Papa John’s International, Inc., a Delaware corporation (referred to as the “Company”, “Papa John’s” or in the first person notations of “we”, “us” and “our”), operates and franchises pizza delivery and carryout restaurants and, in certain international markets, dine-in and delivery restaurants under the trademark “Papa John’s”. Papa John’s began operations in 1984. At December 26, 2021, there were 5,650 Papa John’s restaurants in operation, consisting of 600 Company-owned and 5,050 franchised restaurants operating in 50 countries and territories. Our Company-owned restaurants include 188 restaurants operated under four joint venture arrangements. All of the 2,311 international restaurants are franchised.
Strategy
We are committed to delivering on our brand promise “BETTER INGREDIENTS. BETTER PIZZA.®” and a business strategy designed to drive sustainable long-term, profitable growth.
We believe that using high quality ingredients leads to superior quality pizzas. Our original crust pizza dough is made from six simple ingredients and is fresh, never frozen. We also top our pizzas with real cheese made from mozzarella, pizza sauce made with vine-ripened tomatoes, and meat free of fillers. Our marketing and menu strategies emphasize the quality of our ingredients and our new product innovations to accelerate sales. One of our most recent menu innovations, the new Epic Stuffed Crust pizza, was officially launched in the first quarter of 2021 and has been one of our most successful launches to date. The Epic Stuffed Crust pizza, and other menu innovations like our recently announced New York Style pizza, along with Garlic Parmesan Crust, toasted handheld “Papadias” flatbread-style sandwiches and Jalapeno Popper Rolls launched in 2020, demonstrates our commitment to building new long-term sustainable menu products on which we can continue to innovate. These products form the foundation of our growing comparable sales and improving unit economics.
We utilize technology to deliver a better customer experience, improve operational efficiencies and inform our decision-making. Our loyalty program (“Papa Rewards”) and one-to-one marketing platforms help us retain loyal customers and attract new ones. As our loyalty program grows, it continues to deliver strategic benefits. Papa Rewards customers are significantly more profitable than non-loyalty customers since we are able to directly engage them with targeted personalized offers that drive higher frequency, ticket price and satisfaction. We also partner with top domestic delivery aggregators to meet customer demand for our products. Aggregators have also helped navigate the labor shortage that the Company is experiencing by providing supplemental delivery drivers, especially during peak times when our delivery teams are working at full capacity.
We continue to pursue a growth strategy by expanding our footprint, both domestically and internationally. In August 2021, we announced our expanded partnership with Drake Food Service International to open over 220 restaurants across Latin America, Spain, Portugal and the United Kingdom (“UK”) by 2025. In September 2021, we announced the Company's largest domestic development deal ever with Sun Holdings, who will open 100 new locations in high-growth markets in Texas and the South by 2029. Most recently, in January 2022, we announced a partnership with FountainVest Partners, one of Asia’s leading independent private equity firms, to open more than 1,350 new stores across South China by 2040, the largest franchisee development agreement in our history.
A large majority of Papa John’s restaurants are franchised. We believe a franchised model provides resiliency of earnings and presents us with an opportunity to enhance growth with less capital investment than a traditional company-operated restaurant model. We seek to attract and retain franchisees with experience in restaurant or retail operations and with the financial resources and management capabilities to open single or multiple locations. While each Papa John’s franchisee manages and operates its own restaurants and business, we devote significant resources to providing franchisees with assistance in restaurant operations, quality assurance, technology, training, marketing, site selection and restaurant design. Papa John’s franchise owners benefit from our award-winning brand, food service capabilities and the Papa John’s digital and delivery model.
3
Segment Overview
Papa John’s has four defined reportable segments: Domestic Company-owned restaurants, North America commissaries (Quality Control Centers), North America franchising and International operations.
Domestic Company-owned Restaurants
The Domestic Company-owned restaurant segment consists of the operations of all domestic Company-owned restaurants (“domestic” is defined as the contiguous United States) and derives its revenues principally from retail sales of pizza, Papadias, and side items, including breadsticks, cheesesticks, chicken poppers and wings, dessert items and canned or bottled beverages.
Of the total 3,339 North American restaurants open as of December 26, 2021, 600 units, or approximately 18%, were Company-owned. In 2021, the 579 domestic Company-owned restaurants included in the full year’s comparable restaurant base generated average annual unit sales of $1.3 million. We are committed to maintaining sound restaurant unit economics.
Operating Company-owned restaurants allows us to improve operations, training, marketing and quality standards for the benefit of the entire Papa John’s system.
North America commissary
The North America commissary segment comprises 11 full-service regional dough production and distribution Quality Control Centers (“QC Centers”) in the United States (“U.S.”), which supply pizza sauce, dough, food products, paper products, smallwares and cleaning supplies twice weekly to each traditional restaurant served. This system enables us to monitor and control product quality and consistency while lowering food and other costs. We also have one QC Center in Canada, which produces and distributes fresh dough. We evaluate the QC Center system capacity in relation to existing restaurants’ volumes and planned restaurant growth, and facilities are developed or upgraded as operational or economic conditions warrant. To ensure consistent food quality, each domestic franchisee is required to purchase dough and pizza sauce from our QC Centers and to purchase all other supplies from our QC Centers or other approved suppliers.
North America franchising
The North America franchising segment consists of our franchise sales and support activities and derives its revenues from the sale of franchise and development rights and the collection of royalties from our franchisees located in the United States and Canada. Our North American franchised restaurants, which included 2,384 restaurants in the full year’s comparable base for 2021, generated average annual unit sales of $1.1 million. These sales, while not included in the Company’s revenues, contribute to our royalty revenues, franchisee marketing fund contributions, and commissary revenue.
International
The International segment principally consists of distribution sales to franchised Papa John’s restaurants located in the UK and our franchise sales and support activities, which derive revenues from sales of franchise and development rights and the collection of royalties from our international franchisees. International franchisees are defined as all franchise operations outside of the United States and Canada. As of December 26, 2021, there were 2,311 international restaurants, all of which are franchised. The Company currently operates one international QC Center, which is in the UK. Other QC Centers outside the U.S. are operated by franchisees pursuant to license agreements or by other third parties.
All others
All other business units that do not meet the quantitative thresholds for determining reportable segments, which are not operating segments, we refer to as “all others”. These consist of operations that derive revenues from franchise contributions to our marketing funds and the sale, principally to Company-owned and franchised restaurants, of
4
information systems and related services used in restaurant operations, including our point-of-sale system, online and other technology-based ordering platforms, and printing and promotional items.
See “Management’s Discussion and Analysis of Financial Condition and Results of Operations” and “Note 22” of “Notes to Consolidated Financial Statements” for financial information about our segments.
Development
At December 26, 2021, there were 5,650 Papa John’s restaurants operating in 50 countries and territories, as follows:
Domestic Company-owned |
Franchised North America |
Total North America |
International |
System-wide |
|||||
Beginning - December 27, 2020 |
588 |
2,701 |
3,289 |
2,111 |
5,400 |
||||
Opened |
11 |
74 |
85 |
304 |
389 |
||||
Closed |
- |
(35) |
(35) |
(104) |
(139) |
||||
Acquired |
1 |
- |
1 |
- |
1 |
||||
Sold |
- |
(1) |
(1) |
- |
(1) |
||||
Ending - December 26, 2021 |
600 |
2,739 |
3,339 |
2,311 |
5,650 |
||||
Net unit growth |
12 |
38 |
50 |
200 |
250 |
Although most of our domestic Company-owned markets are well-penetrated, our Company-owned restaurant growth strategy is to continue to open domestic restaurants in existing markets as appropriate, thereby increasing consumer awareness and enabling us to take advantage of operational and marketing scale efficiencies. Our experience in developing markets indicates that market penetration through the opening of multiple restaurants in a particular market results in increased average restaurant sales in that market over time. We have co-developed domestic markets with some franchisees or divided markets among franchisees and will continue to use market co-development in the future, where appropriate.
Franchise Program
We continue to attract qualified and experienced franchisees, whom we consider to be a vital part of our system’s continued growth. We believe our relationship with our franchisees is fundamental to the performance of our brand and we strive to maintain a collaborative relationship with our franchisees. Franchisees are approved on the basis of the applicant’s business background, restaurant operating experience and financial resources.
North America Development and Franchise Agreements. We enter into development agreements with our franchisees in North America for the opening of a specified number of restaurants within a defined period of time and specified geographic area. The franchise agreement is generally executed once a franchisee secures a location. Our current standard franchise agreement requires the franchisee to pay a royalty fee of 5% of sales, and the majority of our existing franchised restaurants have a 5% contractual royalty rate in effect. Incentives offered from time to time, including new store incentives, will reduce the contractual royalty rate paid. We provided financial assistance for traditional North America franchisees in 2020 and 2019 in the form of lower royalties, royalty-based service incentives, and targeted relief as well as additional contributions to Papa John’s Marketing Fund (“PJMF”). This temporary franchisee assistance program concluded in the third quarter of 2020.
Over the past several years, we have offered various development incentive programs for domestic franchisees to accelerate unit openings. Such incentives included the following for 2021 traditional openings: (1) waiver of all or part of the standard one-time franchise fee; (2) waiver of all or part of the 5% royalty fee for a period of time; (3) credit for new store equipment; and (4) credit to be applied toward a future food purchase, under certain circumstances. We believe development incentive programs have accelerated unit openings, and we expect to continue to utilize such development incentives.
5
Substantially all existing franchise agreements have an initial 10-year term with a 10-year renewal option. We have the right to terminate a franchise agreement for a variety of reasons, including a franchisee’s failure to make payments when due or failure to adhere to our operational policies and standards. Many state franchise laws limit our ability as a franchisor to terminate or refuse to renew a franchise.
International Development and Franchise Agreements. In international markets, we have either a development agreement or a master franchise agreement with a franchisee for the opening of a specified number of restaurants within a defined period of time and specified geographic area. Under a master franchise agreement, the franchisee has the right to sub-franchise a portion of the development to one or more sub-franchisees approved by us.
Our current standard international master franchise and development agreements provide for payment to us of a royalty fee of 5% of sales. For international markets with sub-franchise agreements, the effective sub-franchise royalty received by the Company is generally 3% of sales and the master franchisee generally receives a royalty of 2% of sales. The remaining terms applicable to the operation of individual restaurants are substantially equivalent to the terms of our domestic franchise agreement. Development agreements will be negotiated at other-than-standard terms for fees and royalties, and we may offer various development and royalty incentives to help drive unit growth and results.
Franchise Operations. All franchisees are required to operate their Papa John’s restaurants in compliance with our policies, standards and specifications, including matters such as menu items, ingredients, and restaurant design. Franchisees have full discretion in human resource practices, and generally have full discretion to determine the prices to be charged to customers, but we generally have the authority to set maximum price points for nationally advertised promotions.
Franchisee Loans. Selected domestic and international franchisees have borrowed funds from us, principally for the purchase of restaurants from us or other franchisees or, in certain international markets, for construction and development of new restaurants. Loans made to franchisees can bear interest at fixed or floating rates and in most cases are secured by the fixtures, equipment and signage of the restaurant and/or are guaranteed by the franchise owners. At December 26, 2021, net loans outstanding totaled $47.9 million. See “Note 2” of “Notes to Consolidated Financial Statements” for additional information.
Marketing Programs
Our domestic marketing strategy consists of both national and local components. Our national strategy includes national advertising via television, print, direct mail, digital, mobile marketing and social media channels. Our digital marketing activities have increased significantly over the past several years in response to increasing customer use of online and mobile technology. Local advertising programs include television, radio, print, direct mail, store-to-door flyers, digital, mobile marketing and local social media channels.
Domestic Company-owned and franchised Papa John’s restaurants within a defined market may be required to join an area advertising cooperative (“Co-op”). Each member restaurant contributes a percentage of sales to the Co-op for market-wide programs, such as television, radio, digital and print advertising, and sports sponsorships. The rate of contribution and uses of the monies collected are determined by a majority vote of the Co-op’s members.
The restaurant-level and Co-op marketing efforts are supported by media, print, digital and electronic advertising materials that are produced by PJMF, our national marketing fund. PJMF is a consolidated nonstock corporation, designed to operate at break-even for the purpose of designing and administering advertising and promotional programs for all participating domestic restaurants. PJMF produces and buys air time for Papa John’s national television commercials and advertises the Company’s products through digital media including banner advertising, paid search-engine advertising, mobile marketing, social media advertising and marketing, text messaging, and email. PJMF also engages in other brand-building activities, such as consumer research and public relations activities. Domestic Company-owned and franchised Papa John’s restaurants are required to contribute a certain minimum percentage of sales to PJMF.
In international markets, our marketing focuses on reaching customers who live or work within a small radius of a Papa John’s restaurant. Our international markets use a combination of advertising strategies, including television, radio, print, digital, mobile marketing and local social media depending on the size of the local market.
6
Human Capital
Our team members are critical to our success. As of December 26, 2021, we employed approximately 14,000 persons, of whom approximately 11,500 were team members at Company-owned restaurants, approximately 700 were management personnel at Company-owned restaurants, approximately 700 were corporate personnel and approximately 1,100 were QC Center and our print and promotions subsidiary personnel. Our team members are non-unionized, and most restaurant team members work part-time and are paid on an hourly basis.
Our franchisees are independent business owners, so their employees are not our employees and therefore are not included in our employee count. We estimate the total number of persons in the Papa John’s system, including our team members, franchisees and the team members of franchisees, was approximately 115,000 as of December 26, 2021.
Diversity, Equity and Inclusion
Our commitment to diversity, equity and inclusion is rooted in our belief that having a Papa John's family that fully reflects and celebrates the global nature of our brand is the right way to do business. After being recognized by Forbes in 2021 as one of America's Best Employers for Diversity, Papa John's joined Forbes' annual list of the World's Best employers. We were honored to rank #1 amongst all pizza companies and #2 in the entire restaurant category. Also, for the second year in a row, we received a score of 100 on the Human Rights Campaign Foundation’s 2022 Corporate Equality Index.
Creating an inclusive and diverse culture that supports and values team members is important to attracting and retaining talented, dedicated employees. We’re implementing initiatives to diversify our workforce and leadership pipeline, embed policies and practices that ensure fairness and instill and reward behaviors across the organization that foster belonging and increase employee engagement. Out of the 19 members of our Senior Leadership Team and Board of Directors, nine are female, three are Black, and one is Hispanic. We have also initiated multiple corporate initiatives over the past several years, including required unconscious bias training for team members, annual Diversity, Equity, and Inclusion training for all team members, the launch of The Papa John’s Foundation for Building Community, our Day of Service with Boys and Girls Clubs of America, and the creation of eight employee resource affinity groups.
Talent Attraction, Retention and Development
Our ability to attract and retain hourly employees in our restaurants has become more challenging, especially as the job market has become more competitive and COVID-19 related factors, especially the rapid spread of the Omicron variant, have prevented employees from being able to work due to illness or quarantine. While we expect the impact of Omicron to subside, we expect labor and inflationary cost challenges to be a continued priority focus for us in 2022. We continue to aspire to be the employer of choice in our industry, including through commitment to diversity and inclusion, and our investments in our team members. In 2021, we announced new hiring, referral and appreciation bonuses. We also made permanent the expanded health, wellness, paid time off and college tuition benefits that we rolled out during the pandemic, including free virtual healthcare visits for all part-time and full-time team members. We intend to continue making these kinds of investments to ensure we support our team members as they support our customers.
To help our team members succeed in their roles and to ensure consistent operational execution, we emphasize continuous training and development opportunities, including providing innovative tools and materials for the operational training and development of team members. Operations personnel complete our management training program and ongoing development programs, including multi-unit training, in which instruction is given on all aspects of our systems and operations. In addition, to further support our team members’ development, we have established our Dough & Degrees program, which allows our team members to earn a college degree for free or at a reduced tuition in partnership with Purdue University Global and the University of Maryland Global Campus. We also offer a tuition reimbursement program that provides another opportunity for our team members to advance their careers.
Workplace Health and Safety
As part of the Company’s enterprise-wide safety management system, we invest in training, technology and people to protect both our customers and team members. All Papa John’s team members, from those at our corporate offices to
7
those working in our warehouses and restaurants, receive annual safety training based on the requirements of their roles. Our QC Centers and restaurant operations undergo annual safety audits, as well as random safety checks by regional safety managers and field safety coordinators.
We have also taken steps to mitigate the impact of the COVID-19 pandemic on our team members and our customers by implementing extra health and safety measures across our business, including No Contact Delivery and enhanced cleaning and sanitization measures.
Industry and Competition
The United States Quick Service Restaurant pizza (“QSR Pizza”) industry is mature and highly competitive with respect to price, service, location, food quality, customer loyalty programs and product innovation. The QSR Pizza category is largely fragmented, and competitors include a few large national chains and many smaller regional chains, as well as a large number of local independent pizza operators, any of which can utilize a growing number of food delivery services. Some of our competitors have been in existence for substantially longer periods than Papa John’s, have substantially greater resources than Papa John’s and can have higher levels of restaurant penetration and stronger, more developed brand awareness in markets where we compete. Competition from delivery aggregators and other food delivery concepts also continues to increase.
Internationally, the pizza delivery model is not as mature as the domestic market and presents a growth opportunity for Papa John’s. We believe demand from international consumers will continue to increase as the demand for pizza delivery and carryout continues. We continue to execute on our growth strategy and expand throughout the world.
With respect to the sale of franchises, we compete with many franchisors of restaurants and other business concepts. There is also active competition for management personnel, drivers and hourly team members, and attractive commercial real estate sites suitable for Papa John’s restaurants.
Government Regulation
We, along with our franchisees, are subject to various federal, state, local and international laws affecting the operation of our respective businesses, including laws and regulations related to our marketing and advertising as well as the preparation and sale of food, food safety and menu labeling. Each Papa John’s restaurant is subject to licensing and regulation by a number of governmental authorities, which include zoning, health, safety, sanitation, building and fire agencies in the state or municipality in which the restaurant is located. Difficulties in obtaining, or the failure to obtain, required licenses or approvals could delay or prevent the opening of a new restaurant in a particular area. Our QC Centers are licensed and subject to regulation by state and local health and fire codes, and the operation of our trucks is subject to federal and state transportation regulations. We are also subject to federal and state environmental regulations. In addition, our domestic operations are subject to various federal and state laws governing such matters as minimum wage requirements, benefits, taxation, working conditions, citizenship requirements, and overtime.
We are subject to Federal Trade Commission (“FTC”) regulation and various state laws regulating the offer and sale of franchises. The laws of several states also regulate substantive aspects of the franchisor-franchisee relationship. The FTC requires us to furnish to prospective franchisees a franchise disclosure document containing prescribed information. State laws that regulate the franchisor-franchisee relationship presently exist in a significant number of states, and bills have been introduced in Congress from time to time that would provide for federal regulation of the U.S. franchisor-franchisee relationship in certain respects if such bills were enacted. State laws often limit, among other things, the duration and scope of non-competition provisions and the ability of a franchisor to terminate or refuse to renew a franchise. Some foreign countries also have disclosure requirements and other laws regulating franchising and the franchisor-franchisee relationship. National, state and local government regulations or initiatives, including health care legislation, “living wage,” or other current or proposed regulations, and increases in minimum wage rates affect Papa John’s as well as others within the restaurant industry. We are also subject to applicable laws in each non-U.S. jurisdiction in which we operate.
8
Privacy and Data Protection
We are subject to privacy and data protection laws and regulations globally. The legal and regulatory landscape for privacy and data protection continues to evolve, and there has been an increase in attention given to privacy and data protection issues with the potential to impact our business. This includes recently enacted laws and regulations in the U.S. and in other countries which require notification to individuals and government authorities of breaches involving certain categories of personal information. Any changes in privacy and data protection laws or regulations could also adversely impact the way we use e-mail, text messages and other marketing techniques and could require changes in our marketing strategies. We have a privacy policy posted on our website at www.papajohns.com. The security of our financial data, customer information and other personal information is a priority for us.
Trademarks, Copyrights and Domain Names
We protect our intellectual property through a combination of patents, copyrights, trademarks and trade secrets, foreign intellectual property laws, confidentiality agreements and other contractual provisions. We have also registered, and applied for the registration of, U.S. and international trademarks, service marks, domain names and copyrights. From time to time, we are made aware of the use by other persons in certain geographical areas of names and marks that are the same as or substantially similar to our marks. It is our policy to pursue registration of our marks whenever possible and to vigorously oppose any infringement of our marks.
We hold copyrights in authored works used in our business, including advertisements, packaging, training, website, and promotional materials. In addition, we have registered and maintain Internet domain names, including “papajohns.com,” and country code domains patterned as papajohns.cc, or a close variation thereof, with “.cc” representing a specific country code.
Environmental Matters
We are not aware of any federal, state, local or international environmental laws or regulations that we expect to materially affect our earnings or competitive position or result in material capital expenditures. However, we cannot predict the effect of possible future environment legislation or regulations on our operations. During 2021, we had no material environmental compliance-related capital expenditures, and no such material expenditures are anticipated in 2022.
Impact of COVID-19
Please refer to “Recent Business Matters” within “Item 7. Management’s Discussion and Analysis of Financial Condition and Results of Operations” for a discussion of recent business developments, including the impact the COVID-19 pandemic is having on our business and results of operations and financial condition.
Additional Information
All of our periodic and current reports filed with the Securities and Exchange Commission (the “SEC”) pursuant to Section 13(a) or 15(d) of the Securities and Exchange Act of 1934, as amended (the “Exchange Act”), are available, free of charge, through our website located at www.papajohns.com. These reports include our annual reports on Form 10-K, quarterly reports on Form 10-Q, current reports on Form 8-K and any amendments to those reports. These reports are available through our website as soon as reasonably practicable after we electronically file them with the SEC. We also make available free of charge on our website our Corporate Governance Guidelines, Board Committee Charters, and our Code of Ethics, which applies to Papa John’s directors, officers and employees. Printed copies of such documents are also available free of charge upon written request to Investor Relations, Papa John’s International, Inc., P.O. Box 99900, Louisville, KY 40269-0900. The SEC maintains an internet site that contains reports, proxy and information statements, and other information regarding issuers that file electronically with the SEC, including us, at www.sec.gov. The references to these website addresses do not constitute incorporation by reference of the information contained on the websites, which should not be considered part of this document.
9
Item 1A. Risk Factors
We are subject to risks that could have a negative effect on our business, financial condition and results of operations. These risks could cause actual operating results to differ from those expressed in certain “forward-looking statements” contained in this Form 10-K as well as in other Company communications. You should carefully consider the following risk factors together with all other information included in this Form 10-K and our other publicly filed documents.
Industry Risks
We are subject to risks related to epidemic and pandemic outbreaks, including COVID-19, which may have a material adverse effect on our business, financial condition and results of operations.
We are subject to risks related to the global COVID-19 pandemic, which has had, and is expected to continue to have, significant adverse impacts on economic and market conditions. In response to the pandemic, governments and other authorities around the world have imposed or re-imposed measures to attempt to control the spread of COVID-19, including restrictions on freedom of movement and business operations such as travel bans, social distancing requirements, including limitations on gatherings, shelter-in-place orders and quarantines, facial covering mandates and mandated business closures, which have resulted in significant changes in commercial activity and consumer behavior. We cannot predict when the effects of the pandemic will subside, how long there will be continuing resurgences of the virus or its variants, including the Delta and Omicron variants, or the effectiveness and uptake of vaccines and treatment therapies. To the extent that the COVID-19 pandemic continues or worsens, restrictions imposed by governments may not be lifted, or additional restrictions may be imposed. As a result, businesses such as our restaurants or QC Centers are subject to restrictions or other requirements intended to control the spread of COVID-19, including vaccine or testing mandates, and our employees may be prohibited from working, and our supply chains may be interrupted. It may be challenging to staff our QC Centers and restaurants and to obtain and process ingredients and raw materials to support our business needs. In addition, individuals have and may continue to become ill, quarantined or otherwise unable to work and/or travel due to health reasons, vaccine mandates or other governmental restrictions. Also, governments may impose other laws, regulations or taxes that could adversely impact our business, financial condition or results of operations.
The potential adverse effects of COVID-19 also could include, but may not be limited to, our ability to meet consumer demand through the continued availability of our workforce and our franchisees’ workforce; adverse impacts from new laws and regulations affecting our business; increased cyber risks and reliance on technology infrastructure to support our business and operations, including through remote-work protocols; fluctuations in foreign currency markets; credit risks of our customers and counterparties; and impairment of long-lived assets, the carrying value of goodwill or other indefinite-lived intangible assets. However, given the evolving health, economic, social, and governmental environments, the specific impact that COVID-19 could have on these risks remains uncertain.
Moreover, during the duration of the COVID-19 pandemic, we have experienced a significant increase in comparable sales and revenues. While we believe that as pandemic-related restrictions are lifted, we are benefitting from the increase in customers we have experienced due to our menu innovation, customer loyalty programs and our offerings of high-quality pizza and other menu items, we do not expect to be able to maintain the same level of annual growth rates in comparable sales and revenues in the future.
Our profitability may suffer as a result of intense competition in our industry.
The U.S. QSR Pizza industry is mature and highly competitive. Competition is based on price, service, location, food quality, brand recognition and loyalty, product innovation, effectiveness of marketing and promotional activity, use of technology, and the ability to identify and satisfy consumer preferences. We may need to reduce the prices for some of our products to respond to competitive and customer pressures, which may adversely affect our profitability. When commodity and other costs increase, we may be limited in our ability to increase prices. With the significant level of competition and the pace of innovation, we may be required to increase investment spending in several areas, particularly marketing and technology, which can decrease profitability.
10
In addition to competition with our larger competitors, we face competition from new competitors such as fast casual pizza concepts. We also face competitive pressures from an array of food delivery concepts and aggregators delivering for quick service or dine in restaurants, using new delivery technologies or delivering for competitors who previously did not have delivery capabilities, some of which may have more effective marketing. The emergence or growth of new competitors, in the pizza category or in the food service industry generally, may make it difficult for us to maintain or increase our market share and could negatively impact our sales and our system-wide restaurant operations. We also face increasing competition from other home delivery services and grocery stores that offer an increasing variety of prepped or prepared meals in response to consumer demand. As a result, our sales can be directly and negatively impacted by actions of our competitors, the emergence or growth of new competitors, consumer sentiment or other factors outside our control.
One of our competitive strengths is our “BETTER INGREDIENTS. BETTER PIZZA.®” brand promise. This means we may use ingredients that cost more than the ingredients some of our competitors may use. Because of our investment in higher-quality ingredients, we could have lower profit margins than some of our competitors if we are not able to establish a quality differentiator that resonates with consumers. Our sales may be particularly impacted as competitors increasingly emphasize lower-cost menu options.
Changes in consumer preferences or discretionary consumer spending could adversely impact our results.
Changes in consumer preferences and trends could negatively affect us (for example, changes in consumer perceptions of certain ingredients that could cause consumers to avoid pizza or some of its ingredients in favor of foods that are or are perceived as healthier, lower-calorie, or lower in carbohydrates or otherwise based on their ingredients or nutritional content). Preferences for a dining experience such as fast casual pizza concepts could also adversely affect our restaurant business and reduce the effectiveness of our marketing and technology initiatives. Also, our success depends to a significant extent on numerous factors affecting consumer confidence and discretionary consumer income and spending, such as general economic conditions, customer sentiment and the level of employment. Any factors that could cause consumers to spend less on food or shift to lower-priced products could reduce sales or inhibit our ability to maintain or increase pricing, which could adversely affect our operating results.
Food safety and quality concerns may negatively impact our business and profitability.
Incidents or reports of food- or water-borne illness or other food safety issues, investigations or other actions by food safety regulators, food contamination or tampering, employee hygiene and cleanliness failures, improper franchisee or employee conduct, or presence of communicable disease at our restaurants (both Company-owned and franchised), QC Centers, or suppliers could lead to product liability or other claims. If we were to experience any such incidents or reports, our brand and reputation could be negatively impacted. This could result in a significant decrease in customer traffic and could negatively impact our revenues and profits. Similar incidents or reports occurring at quick service restaurants unrelated to us could likewise create negative publicity, which could negatively impact consumer behavior towards us.
We rely on our domestic and international suppliers, as do our franchisees, to provide quality ingredients and to comply with applicable laws and industry standards. A failure of one of our domestic or international suppliers to meet our quality standards, or meet domestic or international food industry standards, could result in a disruption in our supply chain and negatively impact our brand and our results.
Failure to preserve the value and relevance of our brand could have a negative impact on our financial results.
Our results depend upon our ability to differentiate our brand and our reputation for quality. Damage to our brand or reputation could negatively impact our business and financial results. Our brand has been highly rated in certain U.S. surveys, and we strive to build the value of our brand as we develop international markets.
Consumer perceptions of our brand are affected by a variety of factors, such as the nutritional content and preparation of our food, the quality of the ingredients we use, our corporate culture, our policies and systems related to diversity, equity
11
and inclusion, our business practices, our engagement in local communities and the manner in which we source the commodities we use.
Consumer acceptance of our offerings is subject to change for a variety of reasons, and some changes can occur rapidly. Consumer perceptions may also be affected by third parties, including former employees and executives, presenting or promoting adverse commentary or portrayals of our industry, our brand, our suppliers or our franchisees, or otherwise making statements, disclosing information or taking actions that could damage our reputation. If we are unsuccessful in managing incidents that erode consumer trust or confidence, particularly if such incidents receive considerable publicity or result in litigation, our brand value and financial results could be negatively impacted.
Our inability or failure to recognize, respond to and effectively manage the accelerated impact of social media could adversely impact our business.
In recent years, there has been a marked increase in the use of social media platforms, including blogs, chat platforms, social media websites, and other forms of internet-based communications that allow individuals access to a broad audience of consumers and other persons. The rising popularity of social media and other consumer-oriented technologies has increased the speed and accessibility of information dissemination. The dissemination of negative information via social media could harm our business, brand, reputation, marketing partners, financial condition, and results of operations, regardless of the information’s accuracy.
In addition, we frequently use social media to communicate with consumers and the public in general. Failure to use social media effectively could lead to a decline in brand value and revenue. Other risks associated with the use of social media include improper disclosure of proprietary information, negative comments about our brand, exposure of personally identifiable information, fraud, hoaxes or malicious dissemination of false information.
Our franchise business model presents a number of risks.
Our success increasingly relies on the financial success and cooperation of our franchisees, yet we have limited influence over their operations. Our franchisees manage their businesses independently, and therefore are responsible for the day-to-day operation of their restaurants. The revenues we realize from franchised restaurants are largely dependent on the ability of our franchisees to maintain or grow their sales. If our franchisees do not maintain or grow sales, our revenues and margins could be negatively affected. Also, if sales trends worsen for franchisees, especially in emerging markets and/or high-cost markets, their financial results may deteriorate, which could result in, among other things, required financial support from us, higher numbers of restaurant closures, reduced numbers of restaurant openings, delayed or reduced payments to us, or increased franchisee assistance, which reduces our revenues.
Our success also increasingly depends on the willingness and ability of our franchisees to remain aligned with us on operating, promotional and marketing plans. Franchisees’ ability to continue to grow is also dependent in large part on the availability of franchisee funding at reasonable interest rates and may be negatively impacted by the financial markets in general or by the creditworthiness of our franchisees. Our operating performance could also be negatively affected if our franchisees experience food safety or other operational problems or project an image inconsistent with our brand and values, particularly if our contractual and other rights and remedies are limited, costly to exercise or subjected to litigation. If franchisees do not successfully operate restaurants in a manner consistent with our required standards, the brand’s image and reputation could be harmed, which in turn could hurt our business and operating results.
We may be adversely impacted by increases in the cost of food ingredients and other costs.
We are exposed to fluctuations in prices of commodities. An increase in the cost or sustained high levels of the cost of cheese or other commodities could adversely affect the profitability of our system-wide restaurant operations, particularly if we are unable to increase the selling price of our products to offset increased costs. We have recently experienced inflation in commodities prices, including food ingredients, which has increased our operating expenses. Cheese, representing our largest food cost, and other commodities can be subject to significant cost fluctuations due to weather, availability, global demand and other factors that are beyond our control. Additionally, increases in labor, mileage, insurance, fuel, and other costs could adversely affect the profitability of our restaurant and QC Center businesses. Many
12
of the factors affecting costs in our system-wide restaurant operations are beyond our control, and we may not be able to adequately mitigate these costs or pass along these costs to our customers or franchisees, given the significant competitive pricing pressures we face.
Changes in privacy or data protection laws could adversely affect our ability to market our products effectively.
We rely on a variety of direct marketing techniques, including email, text messages and postal mailings. Any future restrictions in federal, state or foreign laws regarding marketing and solicitation or domestic or international data protection laws that govern these activities could adversely affect the continuing effectiveness of email, text messages and postal mailing techniques and could force changes in our marketing strategies. If this occurs, we may need to develop alternative marketing strategies, which may not be as effective and could impact the amount and timing of our revenues.
Our international operations are subject to increased risks and other factors that may make it more difficult to achieve or maintain profitability or meet planned growth rates.
Our international operations could be negatively impacted by volatility and instability in international economic, political, security or health conditions in the countries in which the Company or our franchisees operate, especially in emerging markets. In addition, there are risks associated with differing business and social cultures and consumer preferences. We may face limited availability for restaurant locations, higher location costs and difficulties in franchisee selection and financing. We may be subject to difficulties in sourcing and importing high-quality ingredients (and ensuring food safety) in a cost-effective manner, hiring and retaining qualified team members, marketing effectively and adequately investing in information technology, especially in emerging markets.
Our international operations are also subject to additional risk factors, including import and export controls, compliance with anti-corruption and other foreign laws, difficulties enforcing intellectual property and contract rights in foreign jurisdictions, and the imposition of increased or new tariffs or trade barriers. We intend to continue to expand internationally, which would make the risks related to our international operations more significant over time.
Our international restaurants’ results, which are completely franchised, depend heavily on the operating capabilities and financial strength of our franchisees. Any changes in the ability of our franchisees to run their stores profitably in accordance with our operating standards, or to effectively sub-franchise restaurants, could result in brand damage, a higher number of restaurant closures and a reduction in the number of new restaurant openings.
Sales made by our franchisees in international markets and certain loans we provide to such franchisees are denominated in their local currencies, and fluctuations in the U.S. dollar occur relative to the local currencies. Accordingly, changes in currency exchange rates will cause our revenues, investment income and operating results to fluctuate. We have not historically hedged our exposure to foreign currency fluctuations. Our international revenues and earnings may be adversely impacted as the U.S. dollar rises against foreign currencies because the local currency will translate into fewer U.S. dollars. Additionally, the value of certain assets or loans denominated in local currencies may deteriorate. Other items denominated in U.S. dollars, including product imports or loans, may also become more expensive, putting pressure on franchisees’ cash flows.
We are subject to risks and uncertainties associated with the United Kingdom’s withdrawal from the European Union (referred to as “Brexit”), including implications for the free flow of labor and goods in the United Kingdom and the European Union and other financial, legal, tax and trade implications.
Adverse global economic conditions subject us to additional risk.
Our financial condition and results of operations are impacted by global markets and economic conditions over which neither we nor our franchisees have control. An economic downturn, including deterioration in the economic conditions in the U.S. or international markets where we compete, may result in a reduction in the demand for our products, longer payment cycles, slower adoption of new technologies and increased price competition.
Poor economic conditions may adversely affect the ability of our franchisees to pay royalties or amounts owed and could also disrupt our business and adversely affect our results. Higher inflation, and a related increase in costs, including rising
13
interest rates, could also impact our franchisees and their ability to open new restaurants or operating existing restaurants profitability.
Higher labor costs, increased competition for qualified team members and ensuring adequate staffing in our restaurants and QC Centers increase the cost of doing business. Additionally, changes in employment and labor laws, including health care legislation and minimum wage increases, could increase costs for our system-wide operations.
Our success depends in part on our and our franchisees’ ability to recruit, motivate, train and retain a qualified workforce to work in our restaurants in an intensely competitive environment. Our ability to attract and retain hourly employees in our restaurants has recently become more challenging, especially as the job market has become more competitive, and we expect staffing and labor challenges to continue into 2022. Increased costs associated with recruiting, motivating and retaining qualified employees to work in Company-owned and franchised restaurants, which have stemmed in part from the labor shortage experienced by the QSR industry in 2021, have had, and may in the future have, a negative impact on our Company-owned restaurant margins and the margins of franchised restaurants. Competition for qualified drivers for both our restaurants and supply-chain function also continues to increase as more companies compete for drivers or enter the delivery space, including third party aggregators. Additionally, economic actions, such as boycotts, protests, work stoppages or campaigns by labor organizations, could adversely affect us (including our ability to recruit and retain talent) or our franchisees and suppliers. Social media may be used to foster negative perceptions of employment with our Company in particular or in our industry generally, and to promote strikes or boycotts.
We are also subject to federal, state and foreign laws governing such matters as minimum wage requirements, overtime compensation, benefits, working conditions, citizenship requirements and discrimination and family and medical leave and employee related litigation. Labor costs and labor-related benefits are primary components in the cost of operation of our restaurants and QC Centers. Labor shortages, increased employee turnover and health care mandates could increase our system-wide labor costs.
A significant number of hourly personnel are paid at rates close to the federal and state minimum wage requirements. Accordingly, the enactment of additional state or local minimum wage increases above federal wage rates or regulations related to exempt employees has increased and could continue to increase labor costs for our domestic system-wide operations. A significant increase in the federal minimum wage requirement could adversely impact our financial condition and results of operations.
We rely on information technology to operate our businesses and maintain our competitiveness, and any failure to invest in or adapt to technological developments or industry trends could harm our business.
We rely heavily on information systems, including digital ordering solutions, through which over half of our domestic sales originate. We also rely heavily on point-of-sale processing in our Company-owned and franchised restaurants for data collection and payment systems for the collection of cash, credit and debit card transactions, and other processes and procedures. Our ability to efficiently and effectively manage our business depends on the reliability and capacity of these technology systems. In addition, we anticipate that consumers will continue to have more options to place orders digitally, both domestically and internationally. We plan to continue to invest in enhancing and improving the functionality and features of our information technology systems. However, we cannot ensure that our initiatives will be beneficial to the extent, or within the timeframes, expected or that the estimated improvements will be realized as anticipated or at all. Our failure to adequately invest in new technology and adapt to technological developments and industry trends, particularly our digital ordering capabilities, could result in a loss of customers and related market share. Notwithstanding adequate investment in new technology, our marketing and technology initiatives may not be successful in improving our comparable sales results. Additionally, we are in an environment where the technology life cycle is short and consumer technology demands are high, which requires continued reinvestment in technology that will increase the cost of doing business and will increase the risk that our technology may not be customer-centric or could become obsolete, inefficient or otherwise incompatible with other systems.
We rely on our international franchisees to maintain their own point-of-sale and online ordering systems, which are often purchased from third-party vendors, potentially exposing international franchisees to more operational risk, including cyber and data privacy risks and governmental regulation compliance risks.
14
Company Risks
Our reorganization activities may increase our expenses, may not be successful, and may adversely impact employee hiring and retention.
On September 17, 2020, we announced plans to open an office in Atlanta, Georgia, which opened in October 2021. As a result, we have incurred and may continue to incur certain non-recurring corporate reorganization costs, and these expenses have impacted and could adversely impact our results of operations during the relevant periods and reduce our cash position. Additionally, our ability to achieve the anticipated benefits of our corporate reorganization are subject to assumptions and uncertainties. If we do not realize the anticipated benefits from these measures, or if we incur costs greater than anticipated, our financial condition and operating results may be adversely affected.
In addition, turnover in our corporate office support teams due to certain functions relocating to our office in Georgia could distract our employees, decrease employee morale, harm our reputation, and negatively impact the overall performance of our corporate support teams. As a result of these or other similar risks, our business, results of operations and financial condition may be adversely affected.
We may not be able to effectively market our products or maintain key marketing partnerships.
The success of our business depends on the effectiveness of our marketing and promotional plans. We may not be able to effectively execute our national or local marketing plans, particularly if we experienced lower sales that would result in reduced levels of marketing funds. We may be required to expend additional funds to effectively improve consumer sentiment and sales, and we may also be required to engage in additional activities to retain customers or attract new customers to the brand. Such marketing expenses and promotional activities, which could include discounting our products, could adversely impact our results.
Persons or marketing partners who endorse our products could take actions that harm their reputations, which could also cause harm to our brand. From time to time, in response to changes in the business environment and the audience share of marketing channels, we expect to reallocate marketing resources across social media and other channels. That reallocation may not be effective or as successful as the marketing and advertising allocations of our competitors, which could negatively impact the amount and timing of our revenues.
We may not be able to execute our strategy or achieve our planned growth targets, which could negatively impact our business and our financial results.
Our growth strategy depends on our and our franchisees’ ability to open new restaurants and to operate them on a profitable basis. We expect substantially all of our international unit growth and much of our domestic unit growth to be franchised units. Accordingly, our profitability increasingly depends upon royalty revenues from franchisees. If our franchisees are not able to operate their businesses successfully under our franchised business model, our results could suffer. Additionally, we may fail to attract new qualified franchisees or existing franchisees may close underperforming locations. Planned growth targets and the ability to operate new and existing restaurants profitably are affected by economic, regulatory and competitive conditions and consumer buying habits. A decrease in sales, or increased commodity or operating costs, including, but not limited to, employee compensation and benefits or insurance costs, could slow the rate of new store openings or increase the number of store closings. Our business is susceptible to adverse changes in local, national and global economic conditions, which could make it difficult for us to meet our growth targets. Additionally, we or our franchisees may face challenges securing financing, finding suitable store locations at acceptable terms or securing required domestic or foreign government permits and approvals. Declines in comparable sales, net store openings and related operating profits can impact our stock price. If we do not continue to grow future sales and operating results and meet our related growth targets or external expectations for net restaurant openings or our other strategic objectives in the future, our stock price could decline.
15
Our franchisees remain dependent on the availability of financing to remodel or renovate existing locations, upgrade systems and enhance technology, or construct and open new restaurants. From time to time, the Company may provide financing to certain franchisees and prospective franchisees in order to mitigate store closings, allow new units to open, or complete required upgrades. If we are unable or unwilling to provide such financing, which is a function of, among other things, a franchisee’s creditworthiness, the number of new restaurant openings may be slower or the rate of closures may be higher than expected and our results of operations may be adversely impacted. To the extent we provide financing to franchisees, our results could be negatively impacted by negative performance of these franchisee loans.
Our dependence on a sole supplier or a limited number of suppliers for some ingredients could result in disruptions to our business.
Domestic restaurants purchase substantially all food and related products from our QC Centers. We are dependent on Leprino Foods Dairy Products Company (“Leprino”) as our sole supplier for mozzarella cheese, one of our key ingredients. Leprino, one of the major pizza category suppliers of cheese in the United States, currently supplies all of our mozzarella cheese domestically and substantially all of our mozzarella cheese internationally. We also depend on a sole source for our supply of certain desserts and garlic sauce, which constitute less than 10% of our domestic Company-owned restaurant sales. While we have no other sole sources of supply for key ingredients or menu items, we do source other key ingredients from a limited number of suppliers. Alternative sources of mozzarella cheese, desserts, other key ingredients or menu items may not be available on a timely basis or may not be available on terms as favorable to us as under our current arrangements.
Increase in ingredient and other operating costs, including those caused by weather, climate change, COVID-19 and food safety, could adversely affect our results of operations.
Our Company-owned and franchised restaurants could also be harmed by supply chain interruptions including those caused by factors beyond our control or the control of our suppliers. We experienced limited interruptions in our supply chain in 2021. However, prolonged disruption in the supply of products from or to our QC Centers due to weather, climate change, natural disasters, COVID-19, crop disease, food safety incidents, regulatory compliance, labor dispute or interruption of service by carriers could increase costs, limit the availability of ingredients critical to our restaurant operations and have a significant impact on results. Increasing weather volatility or other long-term changes in global weather patterns, including related to global climate change, could have a significant impact on the price or availability of some of our ingredients. In particular, adverse weather or crop disease affecting the California tomato crop could disrupt the supply of pizza sauce to our and our franchisees’ restaurants. Insolvency of key suppliers could also cause similar business interruptions and negatively impact our business.
We rely on third parties for certain business processes and services, and failure or inability of such third-party vendors to perform subjects us to risks, including business disruption and increased costs.
We depend on the performance of suppliers, aggregators and other third parties in our business operations. Third-party business processes we utilize include information technology, gift card authorization and processing, other payment processing, benefits, and other accounting and business services. We conduct third-party due diligence and seek to obtain contractual assurance that our vendors will maintain adequate controls, such as adequate security against data breaches. However, the failure of our suppliers to maintain adequate controls or comply with our expectations and standards could have a material adverse effect on our business, financial condition, and operating results.
Changes in purchasing practices by our domestic franchisees could harm our commissary business.
Although our domestic franchisees currently purchase substantially all food products from our QC Centers, the only required QC Center purchases by franchisees are pizza sauce, dough and other items we may designate as proprietary or integral to our system. Any changes in purchasing practices by domestic franchisees, such as seeking alternative approved suppliers of ingredients or other food products, could adversely affect the financial results of our QC Centers and the Company.
16
Our current insurance may not be adequate and we may experience claims in excess of our reserves.
Our insurance programs for workers’ compensation, owned and non-owned automobiles, general liability, property, and health insurance coverage provided to our employees are funded by the Company up to certain retention levels under our retention programs. Retention limits generally range up to $1.0 million. These insurance programs may not be adequate to protect us, and it may be difficult or impossible to obtain additional coverage or maintain current coverage at a reasonable cost. We also have experienced claims volatility and high costs for our insurance programs. We estimate loss reserves based on historical trends, actuarial assumptions and other data available to us, but we may not be able to accurately estimate reserves. If we experience claims in excess of our projections, our business could be negatively impacted. Our franchisees could be similarly impacted by higher claims experience, hurting both their operating results and/or limiting their ability to maintain adequate insurance coverage at a reasonable cost.
Risks Related to our Indebtedness
We have incurred substantial debt obligations, which could adversely affect our financial condition, and we may be able to incur substantially more indebtedness, including secured debt, and take other actions that could further exacerbate the risks associated with our substantial indebtedness or affect our ability to satisfy our obligations under our indebtedness.
Our outstanding debt as of December 26, 2021 was $490.0 million, which was comprised of $400.0 million outstanding under our 3.875% senior notes due 2029 (the “Notes”) and $90.0 million under our revolving credit facility (the “PJI Revolving Facility”) that forms part of our amended and restated credit agreement (the “Amended Credit Agreement”). We had approximately $510.0 million of remaining availability under the PJI Revolving Facility as of December 26, 2021.
Our substantial level of indebtedness could have important consequences, including the following:
| ● | require us to dedicate a substantial portion of our cash flow from operations to payments on our indebtedness, thereby reducing the availability of our cash flow to fund working capital, capital expenditures, growth opportunities, acquisitions and other general corporate purposes; |
| ● | increase our vulnerability to and limit our flexibility in planning for, or reacting to, changes in our business, the industry in which we operate, regulatory and economic conditions; |
| ● | expose us to the risk of increased interest rates as borrowings under our Amended Credit Agreement will be subject to variable rates of interest; |
| ● | increase our vulnerability to a downgrade of our credit rating, which could adversely affect our cost of funds, liquidity and access to capital markets; |
| ● | place us at a competitive disadvantage compared to our competitors that have less debt; and |
| ● | limit our ability to borrow additional funds. |
We expect to fund our expenses and to pay the principal of and interest on our indebtedness from cash flow from operations. Our ability to meet our expenses and to pay principal of and interest on our indebtedness when due thus depends on our future performance, which will be affected by financial, business, economic and other factors. We will not be able to control many of these factors, such as economic conditions in the markets where we operate and pressure from competitors.
In addition, subject to restrictions in the agreements governing our existing and future indebtedness, we may be able to incur substantially more indebtedness in the future, resulting in higher leverage. The Indenture and the Amended Credit Agreement allow us to incur additional indebtedness, including secured debt. Such additional indebtedness may be substantial. Our ability to recapitalize, incur additional debt and take a number of other actions that are not prohibited by the Indenture or the Amended Credit Agreement could have the effect of exacerbating the risks associated with our substantial indebtedness or diminishing our ability to make payments on our indebtedness when due, which would reduce the availability of cash flow to fund acquisitions, working capital, capital expenditures, other growth opportunities and other general corporate purposes.
17
The agreements governing our debt, including the Indenture governing our Notes and the Amended Credit Agreement, contain various covenants that impose restrictions on us.
The Indenture and the Amended Credit Agreement impose operating and financial restrictions on our activities. In particular, such agreements limit or prohibit our ability to, among other things:
| ● | incur additional indebtedness; |
| ● | make certain investments; |
| ● | sell assets, including capital stock of certain subsidiaries; |
| ● | declare or pay dividends, repurchase or redeem stock or make other distributions to stockholders; |
| ● | consolidate, merge, liquidate or dissolve; |
| ● | enter into transactions with our affiliates; and |
| ● | incur liens. |
In addition, our Amended Credit Agreement requires us to maintain compliance with specified leverage ratios under certain circumstances. Our ability to comply with these provisions may be affected by events beyond our control, and these provisions could limit our ability to plan for or react to market conditions, meet capital needs or otherwise conduct our business activities and plans.
These restrictions on our ability to operate our business could seriously harm our business by, among other things, limiting our ability to take advantage of financing, merger and acquisition and other corporate opportunities.
Furthermore, various risks, uncertainties and events beyond our control could affect our ability to comply with these covenants. Failure to comply with any of the covenants in our existing or future financing agreements could result in a default under those agreements and under other agreements containing cross-default or cross-acceleration provisions. Such a default would permit lenders to accelerate the maturity of the debt under these agreements and to foreclose upon any collateral securing the debt. Under these circumstances, we might not have sufficient funds or other resources to satisfy all of our obligations. In addition, the limitations imposed by financing agreements on our ability to incur additional debt and to take other actions might significantly impair our ability to obtain other financing. We cannot assure you that we will be granted waivers or amendments to these agreements if for any reason we are unable to comply with these agreements or that we will be able to refinance our debt on terms acceptable to us, or at all.
We are exposed to variable interest rates under our Amended Credit Agreement, and increases in interest rates would also increase our debt service costs and could materially impact our profitability.
We are exposed to variable interest rates under the Amended Credit Agreement. We have entered into interest rate swaps that fix a significant portion of our variable interest rate risk. However, by using a derivative instrument to hedge exposures to changes in interest rates, we also expose ourselves to credit risk. Credit risk is due to the possible failure of the counterparty to perform under the terms of the derivative contract.
General Risks
Natural disasters, hostilities, social unrest, severe weather and other catastrophic events may disrupt our operations or supply chain.
The occurrence of a natural disaster, hostilities, cyber-attack, social unrest, terrorist activity, outbreak of epidemic, pandemic or other contagious disease, power outages, severe weather (such as tornados, hurricanes, blizzards, ice storms, floods, heat waves, etc.) or other catastrophic events may disrupt our operations or supply chain and result in the closure of our restaurants (Company-owned or franchised), our corporate offices, any of our QC Centers or the facilities of our suppliers, and can adversely affect consumer spending, consumer confidence levels and supply availability and costs, any of which could materially adversely affect our results of operations.
18
Increasingly complex laws and regulations could adversely affect our business.
We operate in an increasingly complex regulatory environment, and the cost of regulatory compliance is increasing. Our failure, or the failure of any of our franchisees, to comply with applicable U.S. and international labor, health care, food, health and safety, consumer protection, anti-bribery and corruption, competition, environmental and other laws may result in civil and criminal liability, damages, fines and penalties. Enforcement of existing laws and regulations, changes in legal requirements, and/or evolving interpretations of existing regulatory requirements may result in increased compliance costs and create other obligations, financial or otherwise, that could adversely affect our business, financial condition or operating results. Increased regulatory scrutiny of food matters and product marketing claims, and increased litigation and enforcement actions may increase compliance and legal costs and create other obligations that could adversely affect our business, financial condition or operating results. Governments may also impose requirements and restrictions that impact our business. For example, some local government agencies have implemented ordinances that restrict the sale of certain food or drink products.
Compliance with new or additional domestic and international government laws or regulations, including the European Union General Data Protection Regulation (“GDPR”) and the California Consumer Privacy Act (“CCPA”) which could increase costs for compliance. These laws and regulations are increasing in complexity and number, change frequently and increasingly conflict among the various countries in which we operate, which has resulted in greater compliance risk and costs. If we fail to comply with these laws or regulations, we could be subject to reputational damage and significant litigation, monetary damages, regulatory enforcement actions or fines in various jurisdictions. For example, a failure to comply with the GDPR could result in fines up to the greater of €20 million or 4% of annual global revenues.
There also has been increased stakeholder focus, including by U.S. and foreign governmental authorities, investors, media and nongovernmental organizations, on environmental sustainability matters, such as climate change, the reduction of greenhouse gases and water consumption. Legislative, regulatory or other efforts to combat climate change or other environmental concerns could result in future increases in taxes, restrictions on or increases in the costs of supplies, transportation and utilities, any of which could increase our operating costs and those of our franchisees, and necessitate future investments in facilities and equipment. These risks also include the increased pressure to make commitments, set targets, or establish additional goals to take actions to meet them, which could expose us and our franchisees to market, operational, execution and reputational costs or risks. Conversely, if we are not effective in addressing social and environmental sustainability matters, consumer trust and investor confidence in our Company may suffer.
Disruptions of our critical business or information technology systems could harm our ability to compete and conduct our business.
Our critical business and information technology systems have in the past and could in the future be damaged or interrupted by power loss, various technological failures, user errors, cyber-attacks, ransomware sabotage or acts of God. In particular, the Company and our franchisees have experienced occasional interruptions of our digital ordering solutions, which make online ordering unavailable or slow to respond, negatively impacting sales and the experience of our customers. If our digital ordering solutions do not perform with adequate speed and security, our customers may be less inclined to return to our digital ordering solutions.
Part of our technology infrastructure, such as our domestic point-of-sale system, is specifically designed for us and our operational systems, which could cause unexpected costs, delays or inefficiencies when infrastructure upgrades are needed or prolonged and widespread technological difficulties occur. Significant portions of our technology infrastructure, particularly in our digital ordering solutions, are provided by third parties, and the performance of these systems is largely beyond our control. Occasionally, we have experienced or could experience temporary disruptions in our business due to third-party systems failing to adequately perform. Failure to manage future failures of these systems, particularly as our online sales grow, could harm our business and the satisfaction of our customers. Such third-party systems could be disrupted either through system failure or if third party vendor patents and contractual agreements do not afford us protection against similar technology. In addition, we may not have or be able to obtain adequate protection or insurance to mitigate the risks of these events or compensate for losses related to these events, which could damage our business and reputation and be expensive and difficult to remedy or repair.
19
Failure to maintain the integrity of internal or customer data could result in damage to our reputation, loss of sales, and/or subject us to litigation, penalties or significant costs.
We are subject to a number of privacy and data protection laws and regulations. We collect and retain large volumes of internal and customer data, including credit card data and other personally identifiable information of our employees and customers housed in the various information systems we use. Constantly changing information security threats, particularly persistent cyber security threats, pose risks to the security of our systems and networks, and the confidentiality, availability and integrity of our data and the availability and integrity of our critical business functions. As techniques used in cyber-attacks evolve, we may not be able to timely detect threats or anticipate and implement adequate security measures. The integrity and protection of the customer, employee, franchisee and Company data are critical to us. Our information technology systems and databases, and those provided by our third-party vendors, including international vendors, have been and will continue to be subject to computer viruses, malware attacks, unauthorized user attempts, phishing and denial of service and other malicious cyber-attacks. The failure to prevent fraud or security breaches or to adequately invest in data security could harm our business and revenues due to the reputational damage to our brand. Such a breach could also result in litigation, regulatory actions, penalties, and other significant costs to us and have a material adverse effect on our financial results. These costs could be significant and well in excess of, or not covered by, our cyber insurance coverage.
We have been and will continue to be subject to various types of investigations and litigation, including collective and class action litigation, which could subject us to significant damages or other remedies.
We are subject to the risk of investigations and litigation from various parties, including vendors, customers, franchisees, state and federal agencies, stockholders and employees. From time to time, we are involved in a number of lawsuits, claims, investigations, and proceedings consisting of securities, antitrust, intellectual property, employment, consumer, personal injury, corporate governance, commercial and other matters arising in the ordinary course of business.
We have been subject to claims in cases containing collective and class action allegations. Plaintiffs in these types of lawsuits often seek recovery of very large or indeterminate amounts, and the magnitude of the potential loss and defense costs relating to such lawsuits may not be accurately estimated. Litigation trends involving personal injury, employment law, intellectual property and the relationship between franchisors and franchisees may increase our cost of doing business. We evaluate all of the claims and proceedings involving us to assess the expected outcome, and where possible, we estimate the amount of potential losses to us. In many cases, particularly collective and class action cases, we may not be able to estimate the amount of potential losses and/or our estimates may prove to be insufficient. These assessments are made by management based on the information available at the time made and require the use of a significant amount of judgment, and actual outcomes or losses may materially differ. Regardless of whether any claims against us are valid, or whether we are ultimately held liable, such litigation may be expensive to defend and may divert resources away from our operations and negatively impact earnings. Further, we may not be able to obtain adequate insurance to protect us from these types of litigation matters or extraordinary business losses.
We may be subject to harassment or discrimination claims and legal proceedings. Our Code of Ethics and Business Conduct policies prohibit harassment and discrimination in the workplace, in sexual or in any other form. To monitor and enforce these policies, we have ongoing programs for workplace training and compliance, and we investigate and take disciplinary action with respect to alleged violations. Nevertheless, actions by our team members could violate those policies. Franchisees and suppliers are also required to comply with all applicable laws and govern themselves with integrity. Any violations (or perceptions thereof) by our franchisees or suppliers could have a negative impact on consumer perceptions of us and our business and create reputational or other harm to the Company.
We may not be able to adequately protect our intellectual property rights, which could negatively affect our results of operations.
We depend on the Papa John’s brand name and rely on a combination of trademarks, service marks, copyrights, and similar intellectual property rights to protect and promote our brand. We believe the success of our business depends on our continued ability to exclusively use our existing marks to increase brand awareness and further develop our brand, both domestically and abroad. We may not be able to adequately protect our intellectual property rights, and we may be required
20
to pursue litigation to prevent consumer confusion and preserve our brand’s high-quality reputation. Litigation could result in high costs and diversion of resources, which could negatively affect our results of operations, regardless of the outcome.
We may be subject to impairment charges.
Impairment charges are possible due to the nature and timing of decisions we make about underperforming assets or markets, or if previously opened or acquired restaurants perform below our expectations. This could result in a decrease in our reported asset value and reduction in our net income.
We operate globally and changes in tax laws could adversely affect our results.
We operate globally and changes in tax laws could adversely affect our results. We have international operations and generate substantial revenues and profits in foreign jurisdictions. The domestic and international tax environments continue to evolve as a result of tax changes in various jurisdictions in which we operate and changes in the tax laws in certain countries, including the United States, could impact our future operating results. A significant increase in the U.S. corporate tax rate could negatively impact our financial results.
Item 1B. Unresolved Staff Comments
None.
21
Item 2. Properties
As of December 26, 2021, there were 5,650 Papa John’s restaurants worldwide. The following tables provide the locations of our restaurants. We define “North America” as the United States and Canada and “domestic” as the contiguous United States.
North America Restaurants:
|
Company (1) |
|
Franchised |
|
Total |
|
Alabama |
|
3 |
|
83 |
|
86 |
Alaska |
|
— |
|
11 |
|
11 |
Arizona |
|
— |
|
69 |
|
69 |
Arkansas |
|
— |
|
26 |
|
26 |
California |
|
— |
|
179 |
|
179 |
Colorado |
|
— |
|
46 |
|
46 |
Connecticut |
|
— |
|
5 |
|
5 |
Delaware |
|
— |
|
17 |
|
17 |
District of Columbia |
|
— |
|
10 |
|
10 |
Florida |
|
39 |
|
254 |
|
293 |
Georgia |
|
86 |
|
100 |
|
186 |
Hawaii |
|
— |
|
14 |
|
14 |
Idaho |
|
— |
|
13 |
|
13 |
Illinois |
|
8 |
|
73 |
|
81 |
Indiana |
|
44 |
|
93 |
|
137 |
Iowa |
|
— |
|
24 |
|
24 |
Kansas |
|
16 |
|
19 |
|
35 |
Kentucky |
|
42 |
|
64 |
|
106 |
Louisiana |
|
— |
|
60 |
|
60 |
Maine |
|
— |
|
3 |
|
3 |
Maryland |
|
60 |
|
42 |
|
102 |
Massachusetts |
|
— |
|
7 |
|
7 |
Michigan |
|
— |
|
33 |
|
33 |
Minnesota |
|
— |
|
35 |
|
35 |
Mississippi |
|
— |
|
33 |
|
33 |
Missouri |
|
41 |
|
27 |
|
68 |
Montana |
|
— |
|
9 |
|
9 |
Nebraska |
|
— |
|
13 |
|
13 |
Nevada |
|
— |
|
25 |
|
25 |
New Hampshire |
|
— |
|
3 |
|
3 |
New Jersey |
|
— |
|
53 |
|
53 |
New Mexico |
|
— |
|
16 |
|
16 |
New York |
|
— |
|
85 |
|
85 |
North Carolina |
|
101 |
|
81 |
|
182 |
North Dakota |
|
— |
|
9 |
|
9 |
Ohio |
|
— |
|
161 |
|
161 |
Oklahoma |
|
— |
|
37 |
|
37 |
Oregon |
|
— |
|
14 |
|
14 |
Pennsylvania |
|
— |
|
83 |
|
83 |
Rhode Island |
|
— |
|
3 |
|
3 |
South Carolina |
|
8 |
|
78 |
|
86 |
South Dakota |
|
— |
|
13 |
|
13 |
Tennessee |
|
36 |
|
79 |
|
115 |
Texas |
|
90 |
|
215 |
|
305 |
Utah |
|
— |
|
30 |
|
30 |
Virginia |
|
26 |
|
118 |
|
144 |
Washington |
|
— |
|
43 |
|
43 |
West Virginia |
|
— |
|
23 |
|
23 |
Wisconsin |
|
— |
|
24 |
|
24 |
Wyoming |
|
— |
|
9 |
|
9 |
Total U.S. Papa John’s Restaurants |
|
600 |
|
2,564 |
|
3,164 |
Canada |
|
— |
|
175 |
|
175 |
Total North America Papa John’s Restaurants |
|
600 |
|
2,739 |
|
3,339 |
| (1) | Company-owned Papa John’s restaurants include restaurants owned by majority-owned subsidiaries. There were 188 such restaurants at December 26, 2021 (60 in Maryland, 90 in Texas, 26 in Virginia, and 12 in Georgia). |
22
International Restaurants:
|
Franchised |
|
Azerbaijan |
|
12 |
Bahrain |
|
18 |
Belarus |
|
20 |
Bolivia |
|
5 |
Cambodia |
5 |
|
Cayman Islands |
|
2 |
Chile |
|
135 |
China |
|
226 |
Colombia |
|
55 |
Costa Rica |
|
40 |
Cyprus |
|
7 |
Dominican Republic |
|
19 |
Ecuador |
|
24 |
Egypt |
|
64 |
El Salvador |
|
31 |
France |
|
5 |
Germany |
13 |
|
Guam |
|
3 |
Guatemala |
|
25 |
Iraq |
|
1 |
Ireland |
|
79 |
Israel |
|
15 |
Kazakhstan |
|
6 |
Kuwait |
|
30 |
Kyrgyzstan |
|
3 |
Mexico |
|
68 |
Morocco |
4 |
|
Netherlands |
|
32 |
Nicaragua |
|
4 |
Oman |
|
11 |
Pakistan |
15 |
|
Panama |
|
27 |
Peru |
|
46 |
Philippines |
|
15 |
Poland |
|
7 |
Portugal |
3 |
|
Puerto Rico |
|
26 |
Qatar |
|
38 |
Russia |
|
186 |
Saudi Arabia |
|
7 |
South Korea |
|
219 |
Spain |
|
82 |
Trinidad |
|
9 |
Tunisia |
|
10 |
Turkey |
|
60 |
United Arab Emirates |
|
66 |
United Kingdom |
|
507 |
Venezuela |
|
26 |
Total International Papa John’s Restaurants |
2,311 |
23
Most Papa John’s Company-owned restaurants are located in leased space. The initial term of most domestic restaurant leases is five years with most leases providing for one or more options to renew for at least one additional term. Generally, the leases are triple net leases, which require us to pay all or a portion of the cost of insurance, taxes and utilities. As a result of assigning our interest in obligations under property leases as a condition of the refranchising of certain restaurants, we are also contingently liable for payment of approximately 70 domestic leases.
Our corporate office in Atlanta, Georgia, is located in a leased space. Nine of our 12 North America QC Centers are located in leased spaces, with the remaining three QC centers located in buildings we own. Our corporate office and our printing operations located in Louisville, KY are in buildings owned by us. We also maintain a Company-owned office and a full-service QC Center outside of London, United Kingdom (“UK”), where our international operations are managed.
At December 26, 2021, we leased and subleased approximately 425 Papa John’s restaurant sites to franchisees in the UK. The initial lease terms on the franchised sites in the UK are generally 15 years. The initial lease terms of the franchisee subleases are generally five to ten years. See “Note 3” of “Notes to Consolidated Financial Statements” for additional information.
Item 3. Legal Proceedings
The information contained in “Note 19, Litigation, Commitments and Contingencies” of “Notes to Consolidated Financial Statements” is incorporated by reference herein.
Item 4. Mine Safety Disclosures
None.
24
Information about our Executive Officers
Set forth below are the current executive officers of Papa John’s:
First Elected |
||||||
Name |
Age (a) |
Position |
Executive Officer |
|||
Robert M. Lynch |
45 |
President and Chief Executive Officer |
2019 |
|||
Ann B. Gugino |
49 |
Chief Financial Officer |
2020 |
|||
Marvin Boakye |
48 |
Chief People and Diversity Officer |
2019 |
|||
Amanda Clark |
42 |
Chief Development Officer |
2020 |
|||
Caroline M. Oyler |
56 |
Chief Legal and Risk Officer |
2018 |
|||
Jack H. Swaysland |
57 |
Chief Operating Officer, International |
2018 |
|||
C. Max Wetzel |
45 |
Executive Vice President, Chief Commercial Officer |
2019 |
|||
(a) Ages are as of January 1, 2022 |
||||||
Robert M. Lynch was appointed as President and Chief Executive Officer in August 2019. Mr. Lynch joined Papa John’s after serving as President of Arby’s Restaurant Group since August 2017, and served as Brand President and Chief Marketing Officer from August 2013 to August 2017. Prior to Arby’s, he served as Vice President of Marketing at Taco Bell. Mr. Lynch has more than 20 years combined experience in the QSR and consumer packaged goods industries, and also held senior roles at HJ Heinz Company and Procter & Gamble.
Ann B. Gugino was appointed to Chief Financial Officer in October 2020. Ms. Gugino joined Papa John’s from Target Corporation where she served as Senior Vice President, Financing Planning and Analysis since 2018, providing overall strategy, guidance, and direction in the development and execution of Target’s planning, analysis and capital investment portfolios. Prior to Target, Ms. Gugino spent 18 years at Patterson Companies Inc., including four years as Executive Vice President and Chief Financial Officer.
Marvin Boakye was appointed Chief People and Diversity Officer in November 2019 after previously serving as Papa John’s first Chief People Officer since January 2019. Mr. Boakye joined Papa John’s after serving as Vice President of Human Resources at petroleum company Andeavor, in Texas where he also led diversity, equity and inclusion. Prior to Andeavor, he was Chief Human Resources Officer for MTS Allstream, a telecommunications company now part of Bell Canada from June 2015 to March 2017. Prior to that, Mr. Boakye held senior human resources positions for organizations across the United States, Canada and Latin America, including at Goodyear, the Pulte Group and The Home Depot.
Amanda Clark was appointed as Chief Development Officer in February 2020. Ms. Clark joined Papa John’s from Taco Bell, where she was responsible for design, consumer facing technology, merchandising, customer marketing, new concepts and company development, serving as Executive Vice President Restaurant Experience from February 2019 to February 2020, Senior Vice President North America Development from May 2017 to February 2019 and the General Manager for Taco Bell Canada from November 2015 to August 2018. Previously, Ms. Clark served in roles of increasing responsibility in Brand Marketing at Taco Bell since 2013. Prior to joining Taco Bell, Ms. Clark worked at Procter and Gamble in various marketing roles for nearly 12 years on P&G brands including Olay, Pampers and Oral-B.
25
Caroline M. Oyler was appointed Chief Legal and Risk Officer in October 2018. Ms. Oyler previously served as Senior Vice President, Chief Legal Officer from May 2018 to October 2018 and Senior Vice President, General Counsel from May 2014 to May 2018. Additionally, Ms. Oyler served as Senior Vice President, Legal Affairs from November 2012 to May 2014. She joined the Company’s legal department in 1999. She also served as interim head of Human Resources from December 2008 to September 2009. Prior to joining Papa John’s, Ms. Oyler practiced law with the firm Wyatt, Tarrant and Combs LLP.
Jack H. Swaysland was appointed to Chief Operating Officer, International in May 2018 after serving as Senior Vice President, International since April 2016. Mr. Swaysland previously served as Vice President, International from April 2015 to April 2016, Regional Vice President, International from May 2013 to April 2015, and Vice President, International Operations from April 2010 to May 2013. Mr. Swaysland has served in various capacities of increasing responsibility in International Operations since joining the Company 13 years ago.
C. Max Wetzel was appointed Executive Vice President, Chief Commercial Officer in November 2021 after previously serving as Chief Commercial and Marketing Officer since November 2019. Mr. Wetzel joined Papa John’s after serving as Vice President Consumer Brands and Business Transformation – U.S. and Canada since July 2018 at PPG Architectural Coatings. Also at PPG, Mr. Wetzel served as Vice President Home Centers and Global Strategic Marketing from June 2016 through July 2018 and as General Manager Home Centers and Chief Marketing Officer U.S. & Canada starting in November 2014. Prior to PPG, Mr. Wetzel worked at H.J. Heinz Company for ten years in a variety of domestic and global roles, leading consumer-driven businesses, developing brand marketing strategies and delivering profitable growth.
There are no family relationships between any of the directors or executive officers of the Company.
26
PART II
Item 5. Market for Registrant’s Common Equity, Related Stockholder Matters and Issuer Purchases of Equity Securities
Our common stock trades on The Nasdaq Global Select Market tier of The Nasdaq Stock Market under the symbol “PZZA”. As of February 17, 2022, there were 1,359 record holders of our common stock. However, there are significantly more beneficial owners of our common stock than there are record holders.
On January 27, 2022, our Board of Directors declared a first quarter dividend of $0.35 per share of common stock, representing an approximate $12.7 million aggregate dividend that was paid on February 18, 2022 to common stockholders of record as of the close of business on February 7, 2022.
We anticipate continuing the payment of quarterly cash dividends. The actual amount of such dividends is subject to declaration by our Board of Directors and will depend upon future earnings, results of operations, capital requirements, our financial condition, contractual restrictions, including the terms of the agreements governing our debt and any future indebtedness we may incur and other relevant factors. There can be no assurance that the Company will continue to pay quarterly cash dividends at the current rate or at all.
On October 28, 2021, our Board of Directors approved a share repurchase program with an indefinite duration for up to $425.0 million of the Company’s common stock. This share repurchase program operated alongside our previous $75.0 million share repurchase authorization, which began on November 4, 2020 and expired on December 26, 2021. In fiscal 2021, approximately 594,000 shares with an aggregate cost of $72.5 million and an average price of $121.96 per share were repurchased under these programs. Funding for the share repurchase programs were provided through our operating cash flows and our $600.0 million PJI Revolving Facility.
The following table summarizes our repurchase activity by fiscal period during the fourth quarter ended December 26, 2021 (in thousands, except per share amounts):
|
|
|
Total Number |
|
Maximum Dollar |
||||||
Total |
Average |
of Shares Purchased |
Value of Shares |
||||||||
Number |
Price |
as Part of Publicly |
that May Yet Be |
||||||||
of Shares |
Paid per |
Announced Plans |
Purchased Under the |
||||||||
Fiscal Period |
|
Purchased |
|
Share |
|
or Programs |
|
Plans or Programs |
|||
9/27/2021 - 10/24/2021 |
|
132 |
$ |
126.44 |
|
132 |
$ |
35,026 |
|||
10/25/2021 - 11/21/2021 |
|
70 |
$ |
125.25 |
|
70 |
$ |
451,219 |
|||
11/22/2021 - 12/26/2021 |
|
205 |
$ |
128.84 |
|
205 |
$ |
424,800 |
|||
Total |
|
407 |
$ |
127.44 |
|
407 |
$ |
424,800 |
|||
Subsequent to year-end, we acquired an additional 109,000 shares at an aggregate cost of $13.3 million. Approximately $411.5 million remained available under the Company’s share repurchase program as of February 17, 2022.
The Company utilizes a written trading plan under Rule 10b5-1 under the Securities Exchange Act of 1934, as amended, from time to time to facilitate the repurchase of shares of our common stock under this share repurchase program. There can be no assurance that we will repurchase shares of our common stock either through a Rule 10b5-1 trading plan or otherwise.
The information required by Item 5 with respect to securities authorized for issuance under equity compensation plans is incorporated herein by reference to Part III, Item 12 of this Form 10-K.
27
Stock Performance Graph
The following performance graph compares the cumulative shareholder return of the Company’s common stock for the five-year period between December 25, 2016 and December 26, 2021 to (i) the Nasdaq US Benchmark TR Index and (ii) a group of the Company’s peers consisting of U.S. companies listed on Nasdaq with standard industry classification (SIC) codes 5800-5899 (eating and drinking places). Management believes the companies included in this peer group appropriately reflect the scope of the Company’s operations and match the competitive market in which the Company operates. The graph assumes the value of the investments in the Company’s common stock and in each index was $100 on December 25, 2016, and that all dividends were reinvested.
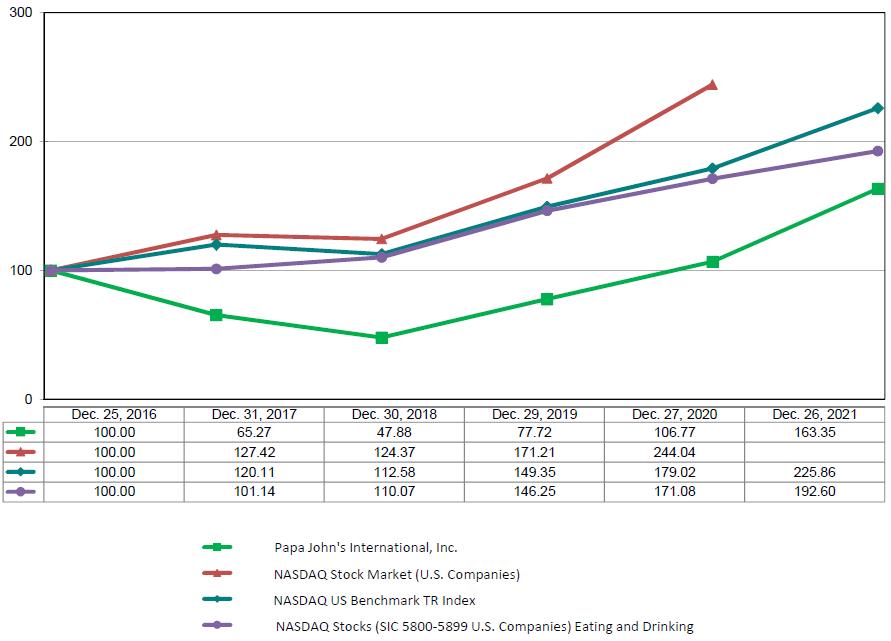
(Note) The Nasdaq Stock Market (U.S. Companies) Index was replaced with the Nasdaq US Benchmark TR Index in 2021.
Item 6. Intentionally Omitted
28
Item 7. Management’s Discussion and Analysis of Financial Condition and Results of Operations
Introduction
Papa John’s International, Inc. (referred to as the “Company,” “Papa John’s” or in the first-person notations of “we,” “us” and “our”) began operations in 1984. At December 26, 2021, there were 5,650 Papa John’s restaurants in operation, consisting of 600 Company-owned and 5,050 franchised restaurants. Our revenues are derived from retail sales of pizza and other food and beverage products to the general public by Company-owned restaurants, franchise royalties, and sales of franchise and development rights. Additionally, approximately 47% of our North America revenues in each of the last two fiscal years were derived from sales to franchisees of various items including food and paper products from our domestic Quality Control Centers (“QC Centers”), operation of our international QC Center in the United Kingdom (“UK”), contributions received by Papa John’s Marketing Fund (“PJMF”) which is our national marketing fund, printing and promotional items and information systems equipment, and software and related services. We believe that in addition to supporting both Company and franchised profitability and growth, these activities contribute to product quality and consistency throughout the Papa John’s system.
Recent Business Matters
In 2021, the Company focused on executing strategic priorities and building a foundation for long-term success, including the specific items described below.
Growth Strategy. The Company delivered its tenth consecutive quarter of system-wide sales growth and continues to expand both domestically and internationally, as evidenced by our comparable sales and restaurant unit growth. Our two-year comparable sales increases were 29.4% in North America and 25.6% internationally, driven by menu innovation and customer retention. Product innovation is an important part of our plan to continue building sales and also represents our platform for longer-term strategy and opportunity. Additionally, our expanding development pipeline is on track to be a key long-term growth driver. In 2021, we announced one of our largest domestic development deals to open 100 new locations in high growth markets in Texas and the South by 2029. We also announced our expanded partnership with Drake Food Service International to open over 220 Papa John’s restaurants internationally by 2025, and most recently announced a partnership with FountainVest Partners to open more than 1,350 new stores across South China by 2040, the largest franchisee development agreement in Papa John’s history. We plan to continue focusing on our strategic innovative products and restaurant development across our platforms to drive sustainable growth this year and beyond.
Capital Allocation Strategy. During 2021, we executed on key components of our capital structure and allocation strategy by aligning our capital structure to support the long-term growth potential of the Company. During the fourth quarter of 2021, we announced a $425.0 million share repurchase program. Earlier in the year, we issued $400.0 million of 3.875% senior notes which will mature on September 15, 2029 and concurrently refinanced our revolving credit facility. We also increased our annual dividend rate and completed the repurchase and conversion of all of our Series B Convertible Preferred Stock (the “Series B Preferred Stock”). This strategic capital realignment will allow us to deliver on our broader growth strategy and provide ongoing value to our shareholders.
Coronavirus (“COVID-19”) and Related Market Impact. The COVID-19 outbreak has presented evolving risks and developments domestically and internationally, as well as new opportunities for our business. Our delivery and carryout model positioned us to continue to experience strong demand for our products. Increased demand partly driven by changes in consumer behavior during the pandemic contributed to our strong comparable sales growth during 2021 and 2020. To ensure we can continue to meet the demand of our customers, we continue to monitor our supply chain and labor force availability. We have recently experienced inflation in commodities prices, including food ingredients, which has increased our operating expenses. Our ability to attract and retain hourly employees in our restaurants has also become more challenging, especially as the job market has become more competitive. We have continued to address labor shortages during 2021 through new hiring, referral and appreciation bonuses in the Company’s corporate restaurants and supply chain, holding national recruiting events, supplementing delivery drivers with delivery aggregator partnerships as needed and technology advancements. We expect labor and inflationary cost challenges, including the impact on store development, to be a continued priority focus for us in 2022. We continue to monitor the progression of the COVID-19 pandemic and state, local and federal government regulatory and public health responses thereto, including the federal
29
Occupational Health and Safety Administration’s efforts to implement a nationwide vaccine requirement for large employers.
We believe the pandemic has accelerated our efforts to innovate and bring new customers to the Papa John’s system. While we believe that as the pandemic-related restrictions are lifted, we will benefit in the long-term from the increase in customers we have experienced during the duration of the pandemic due to our menu innovation, customer loyalty program and our offerings of high-quality pizza and other menu items, we do not expect to be able to maintain the same level of annual growth rates in comparable sales and revenues in the future.
Strategic Corporate Reorganization for Long-term Growth. Our corporate office in Atlanta, Georgia located in Three Ballpark Center at The Battery Atlanta opened in October 2021. The Atlanta office is part of a broader strategic reorganization of corporate functions reflecting the Company’s ongoing transformation into a brand and culture that can effectively and efficiently deliver on the Company’s purpose, values and strategic business priorities. Affected employees who did not relocate to Atlanta were offered a separation package. As a result, we incurred certain one-time corporate reorganization costs of approximately $19.1 million related to employee severance and transition, recruitment and relocation and other third-party costs from the fourth quarter of 2020 through 2021. Of that amount, we incurred costs of approximately $13.1 million in 2021 and $6.0 million in 2020. Looking forward to 2022, our one-time corporate reorganization costs are substantially complete and we do not anticipate that any significant remaining reorganization costs will be incurred. See “Items Impacting Comparability; Non-GAAP Measures” for additional information.
Presentation of Financial Results
Critical Accounting Policies and Estimates
The results of operations are based on our Consolidated Financial Statements, which were prepared in conformity with accounting principles generally accepted in the United States (“GAAP”). The preparation of Consolidated Financial Statements requires management to select accounting policies for critical accounting areas as well as estimates and assumptions that affect the amounts reported in the Consolidated Financial Statements. The Company’s significant accounting policies, including recently issued accounting pronouncements, are more fully described in “Note 2” of “Notes to Consolidated Financial Statements.” A number of our significant accounting policies are critical due to the fact that they involve a significant level of estimation uncertainty and have had or are reasonably likely to have a material impact on our financial condition or results of operations. Significant changes in assumptions and/or conditions in our critical accounting policies could materially impact the operating results.
Allowance for Credit Losses on Franchisee Notes Receivable
The Company has provided financing (recorded as notes receivable) to select domestic and international franchisees principally for use in the construction and development of their restaurants and for the purchase of restaurants from the Company or other franchisees. Most notes receivable bear interest at fixed or floating rates and are generally secured by the assets of each restaurant and the ownership interests in the franchise. The Company has also provided long-term financing to certain franchisees with royalty payment plans.
The Company establishes an allowance for credit losses on franchisee notes receivables when it is more likely than not that some portion or all of the balance will not be realized. The allowance for credit losses on notes receivable is highly judgmental and subjective based on management’s judgments of each franchisee’s economic performance and future market conditions. The Company considers each individual note receivable separately for evaluation of its allowance for credit losses which represent specific reserve calculations, except for certain notes receivable issued related to equipment development incentives where a general portfolio reserve exists supported by historical write-off experiences. Included in the terms of the notes receivable agreements, the Company is provided collateral rights of the franchisee’s stores (e.g., underlying franchise business, property and equipment) and personal guarantees from the operators to recover the carrying value of the outstanding note receivable in the event collectability concerns arise. As a result, the Company also considers the fair value of the underlying collateral rights (e.g., underlying franchisee business, property and equipment) and any guarantees when assessing the allowance for credit losses (which may require third-party valuations of fair value). Further, the Company also considers overall franchisee credit quality, which is monitored through the timing of payments compared
30
to the prescribed payment terms and known facts regarding the financial condition of the franchisee or customer, including metrics such as comparable store sales of the franchisees operations and weekly per store sales averages. Notes receivable balances are charged off against the allowance after recovery efforts have ceased.
Franchisee notes receivable was $49.4 million with an allowance for credit losses of $1.5 million as of December 26, 2021 compared to $51.1 million with an allowance for credit losses of $3.2 million as of December 27, 2020.
Insurance Reserves
Our insurance programs for workers’ compensation, owned and non-owned automobiles, general liability and property insurance coverage provided to our employees are funded by the Company up to certain retention. Retention limits range up to $1.0 million. We record the liability for losses based upon undiscounted estimates of the liability for claims incurred and for events that have occurred but have not been reported using certain third-party actuarial projections and our historical claims loss experience.
As of December 26, 2021, our insurance reserves were $88.1 million as compared to $82.0 million at December 27, 2020. Our insurance reserves primarily relate to auto liability and workers’ compensation claims and includes the gross up of claims above our retention levels, with a corresponding receivable recorded in Prepaid and other current assets and Other assets on the Consolidated Balance Sheets. The insurance reserves represent the mid-point of the range as determined by our actuarial analysis, which considered various actuarial valuation methodologies. The determination of the recorded insurance reserves is highly complex due to the significant uncertainty in the potential value of reported claims and the number and potential value of incurred but not reported claims.
Income Tax Accounts and Tax Reserves
Papa John’s is subject to income taxes in the United States and several foreign jurisdictions. Significant judgment is required in determining Papa John’s provision for income taxes and the related assets and liabilities. The provision for income taxes includes income taxes paid, currently payable or receivable and those deferred. Deferred tax assets and liabilities are determined based on differences between financial reporting and tax basis of assets and liabilities and are measured using enacted tax rates and laws that are expected to be in effect when the differences reverse. Deferred tax assets are also recognized for the estimated future effects of tax attribute carryforwards (e.g., net operating losses, capital losses, and foreign tax credits). The effect on deferred taxes of changes in tax rates is recognized in the period in which the new tax rate is enacted.
Valuation allowances are established when necessary on a jurisdictional basis to reduce deferred tax assets to the amounts we expect to realize and were $28.6 million and $23.0 million as of December 26, 2021 and December 27, 2020, respectively. The determination as to whether a deferred tax asset will be realized is based on the evaluation of historical profitability, future market growth, future taxable income, the expected timing of the reversals of existing temporary differences and tax planning strategies. The Company assesses deferred taxes and the adequacy or need for a valuation allowance on a quarterly basis.
Tax authorities periodically audit the Company. We record reserves and related interest and penalties for identified exposures as income tax expense. We evaluate these issues and adjust for events, such as statute of limitations expirations, court rulings or audit settlements, which may impact our ultimate payment for such exposures.
In the event the Company is unable to generate future taxable income, there is a material change in the actual effective tax rates, the time period within which the underlying temporary differences become taxable or deductible, or if the tax laws change unfavorably, then we could be required to increase the valuation allowance against deferred tax assets, resulting in an increase in income tax expense and the effective tax rate. Each change of income tax expense of $1.5 million would impact the fiscal 2021 effective tax rate by one percentage point. See “Note 17” of “Notes to Consolidated Financial Statements” for additional information.
31
Global Restaurant Sales and Unit Information
“Comparable sales” represents the change in year-over-year sales for the same base of restaurants for the same fiscal periods. “Global system-wide restaurant sales” represents total restaurant sales for all company-owned and franchised stores open during the comparable periods, and “Global system-wide restaurant sales growth” represents the change in total system restaurant sales year-over-year. We believe North America, international and global restaurant and comparable sales growth and Global system-wide restaurant sales information is useful in analyzing our results since our franchisees pay royalties and marketing fund contributions that are based on a percentage of franchise sales. Comparable sales and Global system-wide restaurant sales results for restaurants operating outside of the United States are reported on a constant dollar basis, which excludes the impact of foreign currency translation. Franchise sales also generate commissary revenue in the United States and in certain international markets. Franchise restaurant and comparable sales growth information is also useful for comparison to industry trends and evaluating the strength of our brand. Management believes the presentation of franchise restaurant sales growth, excluding the impact of foreign currency, provides investors with useful information regarding underlying sales trends and the impact of new unit growth without being impacted by swings in the external factor of foreign currency. Franchise restaurant sales are not included in the Company’s revenues.
|
Year Ended |
|||||
|
December 26, 2021 |
December 27, 2020 |
||||
Comparable sales growth: |
||||||
Domestic Company-owned restaurants |
11.3% |
14.2% |
||||
North America franchised restaurants |
12.0% |
18.6% |
||||
North America restaurants |
11.8% |
17.6% |
||||
International restaurants |
13.0% |
12.6% |
||||
Total comparable sales growth |
12.1% |
16.3% |
||||
System-wide restaurant sales growth: |
||||||
(excluding the impact of foreign currency) |
||||||
Domestic Company-owned restaurants |
11.1% |
7.5% |
||||
North America franchised restaurants |
13.0% |
18.7% |
||||
North America restaurants |
12.6% |
16.0% |
||||
International restaurants |
24.4% |
15.5% |
||||
Total global system-wide restaurant sales growth |
15.4% |
15.9% |
||||
Restaurant Progression |
|
Year Ended |
||||
|
December 26, 2021 |
|
December 27, 2020 |
|||
North America Company-owned: |
||||||
Beginning of period |
|
588 |
|
598 |
||
Opened |
|
11 |
|
2 |
||
Closed |
|
— |
|
(12) |
||
Acquired |
|
1 |
|
— |
||
End of period |
|
600 |
|
588 |
||
North America franchised: |
||||||
Beginning of period |
|
2,701 |
|
2,690 |
||
Opened |
|
74 |
|
62 |
||
Closed |
|
(35) |
|
(51) |
||
Sold |
(1) |
— |
||||
End of period |
|
2,739 |
|
2,701 |
||
International franchised: |
||||||
Beginning of period |
|
2,111 |
|
2,107 |
||
Opened |
|
304 |
|
156 |
||
Closed |
|
(104) |
|
(152) |
||
End of period |
|
2,311 |
|
2,111 |
||
Total restaurants – end of period |
|
5,650 |
|
5,400 |
||
Full year net store growth |
|
250 |
5 |
|||
32
Fiscal Year
Our fiscal year ends on the last Sunday in December of each year. All fiscal years presented in the accompanying Consolidated Financial Statements consist of 52 weeks.
Results of Operations
2021 Compared to 2020
This section of this Annual Report on Form 10-K generally discusses fiscal 2021 and 2020 items and year-to-year comparisons between fiscal 2021 and 2020. Discussion of 2019 items and year-to-year comparisons between fiscal 2020 and 2019 that are not included in this Form 10-K can be found in “Management’s Discussion and Analysis of Financial Condition and Results of Operations” in Part II, Item 7 of the Company’s Annual Report on From 10-K for the fiscal year ended December 27, 2020.
The following table sets forth the various components of the Consolidated Statements of Operations expressed as a percentage of total revenues, except operating costs which are expressed as a percentage of the associated revenue component.
Year Ended |
|||||||||||||
December 26, 2021 |
December 27, 2020 |
||||||||||||
% of Related |
% of Related |
Increase |
|||||||||||
($ in thousands) |
Revenues |
Revenues |
(Decrease) |
||||||||||
Revenues: |
|||||||||||||
Domestic Company-owned restaurant sales |
$ |
778,323 |
$ |
700,757 |
|||||||||
North America franchise royalties and fees |
129,310 |
96,732 |
|||||||||||
North America commissary revenues |
761,305 |
680,793 |
|||||||||||
International revenues |
150,771 |
123,963 |
|||||||||||
Other revenues |
248,712 |
210,989 |
|||||||||||
Total revenues |
2,068,421 |
1,813,234 |
|||||||||||
Costs and expenses: |
|||||||||||||
Operating costs (excluding depreciation and amortization shown separately below): |
|||||||||||||
Domestic Company-owned restaurant expenses |
621,871 |
79.9% |
563,799 |
80.5% |
(0.6)% |
||||||||
North America commissary expenses |
703,622 |
92.4% |
630,937 |
92.7% |
(0.3)% |
||||||||
International expenses |
87,286 |
57.9% |
73,994 |
59.7% |
(1.8)% |
||||||||
Other expenses |
226,320 |
91.0% |
200,304 |
94.9% |
(3.9)% |
||||||||
General and administrative expenses |
212,265 |
10.3% |
204,242 |
11.3% |
(1.0)% |
||||||||
Depreciation and amortization |
48,816 |
2.4% |
49,705 |
2.7% |
(0.3)% |
||||||||
Total costs and expenses |
1,900,180 |
91.9% |
1,722,981 |
95.0% |
(3.1)% |
||||||||
Operating income |
168,241 |
8.1% |
90,253 |
5.0% |
3.1% |
||||||||
Investment income |
1,912 |
0.1% |
2,131 |
0.1% |
0.0% |
||||||||
Interest expense |
(19,205) |
(0.9)% |
(17,022) |
(0.9)% |
0.0% |
||||||||
Income before income taxes |
$ |
150,948 |
7.3% |
$ |
75,362 |
4.2% |
3.1% |
||||||
Revenues
Consolidated revenues increased $255.2 million, or 14.1%, to $2.07 billion in 2021, compared to $1.81 billion in 2020.
Domestic Company-owned restaurant sales increased $77.6 million, or 11.1%, in 2021. The increase was primarily due to positive comparable sales of 11.3%, which were positively impacted by new product innovation, including the successful launch of our new Epic Stuffed Crust pizza in the first quarter of 2021, and due to higher demand that has been sustained during the pandemic, which was not reflected in the first quarter of 2020.
33
North America franchise royalties and fees increased $32.6 million, or 33.7%, in 2021. The increase was primarily due to positive comparable sales of 12.0% and a higher effective royalty rate from higher franchise royalties of $14.3 million in 2021 as a result of ending our temporary franchise assistance program in the third quarter of 2020. The franchise assistance program was above and beyond the level of franchise assistance the Company would incur in the ordinary course of its business.
North America franchise restaurant sales increased 13.0% to $2.8 billion for 2021 compared to prior year. North America franchise restaurant sales are not included in Company revenues; however, our North America franchise royalties are derived from these sales.
North America commissary revenues increased $80.5 million, or 11.8%, primarily due to higher volumes and higher pricing from higher commodities costs.
International revenues increased $26.8 million, or 21.6% in 2021 primarily due to higher royalties from increased equivalent units and higher comparable sales of 13.0%. International revenues also increased $8.1 million in 2021 due to favorable foreign exchange rates. “Equivalent units” represents the number of restaurants open at the beginning of a given period, adjusted for restaurants opened, closed, acquired or sold during the period on a weighted average basis.
International franchise restaurant sales increased 24.4% to $1.2 billion in 2021, excluding the impact of foreign currency, primarily due to increases in comparable sales and net new restaurant openings. International franchise restaurant sales are not included in Company revenues; however, our international royalty revenue is derived from these sales.
Other revenues, which primarily includes our national marketing funds, online and mobile ordering business and our wholly-owned print and promotions subsidiary, increased $37.7 million, or 17.9% in 2021 primarily due to higher marketing fund revenues from an increase in franchise sales and higher revenues from our technology platform, including our mobile ordering business which benefited from increased restaurant sales.
Costs and Expenses
Total costs and expenses were approximately $1.90 billion, or 91.9% of total revenues in 2021, as compared to $1.7 billion, or 95.0% of total revenues for the prior year. The decrease in total costs and expenses, as a percentage of revenues, were primarily due to the following:
Domestic Company-owned restaurant expenses were $621.9 million or 79.9% of related revenues in 2021, compared to expenses of $563.8 million, or 80.5% of related revenues for the prior year. The 0.6% decrease in expenses, as a percentage of revenues, was primarily due to leveraging fixed costs on higher revenues, partially offset by higher commodity and labor costs.
North America commissary expenses were $703.6 million, or 92.4% of related revenues in 2021, compared to $630.9 million, or 92.7% of related revenues, for the prior year. The 0.3% decrease in expenses, as a percentage of revenues, was primarily due to leveraging fixed costs on higher revenues.
International expenses were $87.3 million, or 57.9% of related revenues, for 2021 compared to $74.0 million, or 59.7% of related revenues for the prior year. The 1.8% decrease in expenses as a percentage of revenues was primarily due to lower operating costs on higher royalties from a 13.0% increase in comparable sales for 2021 and the favorable impact of foreign currency exchange rates in 2021.
Other expenses were $226.3 million, or 91.0% of related revenues in 2021, as compared to $200.3 million, or 94.9% of related revenues for the prior year. The 3.9% decrease in expenses, as a percentage of related revenues, was primarily due to higher margins from our technology platform, including our mobile ordering business.
34
General and administrative (“G&A”) expenses were $212.3 million, or 10.3% of revenues for 2021 compared to $204.2 million, or 11.3% of revenues for 2020. G&A expenses consisted of the following (dollars in thousands):
Year Ended |
||||||
December 26, |
December 27, |
|||||
2021 |
2020 |
|||||
Administrative expenses (a) |
$ |
199,452 |
$ |
185,202 |
||
Special items (b) |
13,094 |
5,985 |
||||
Other general expenses (c) |
(281) |
13,055 |
||||
General and administrative expenses |
$ |
212,265 |
$ |
204,242 |
||
| (a) | The increase in administrative expenses of $14.3 million for the year ended December 26, 2021 compared to prior year was primarily due to higher professional and legal fees and travel and labor costs. |
| (b) | Represents $13.1 million and $6.0 million in strategic reorganization costs for the years ended December 26, 2021 and December 27, 2020, respectively, associated with the opening of our new office in Atlanta, Georgia. See “Note 16” of “Notes to Consolidated Financial Statements” for additional information. |
| (c) | The decrease in other general expenses of $13.3 million in 2021 was primarily due to discretionary marketing fund investments of $15.0 million which was part of our temporary franchisee assistance program that concluded in the third quarter of 2020. |
See “Items Impacting Comparability; Non-GAAP Measures” for additional information regarding the Special items.
Depreciation and amortization. Depreciation and amortization expense was $48.8 million, or 2.4% of revenues in 2021, as compared to $49.7 million, or 2.7% of revenues for 2020. The 0.3% decrease is primarily due to higher revenues in 2021.
Operating Income by Segment
Operating income is summarized in the following table on a reporting segment basis. Operating income increased approximately $78.0 million for the year ended December 26, 2021 as compared to the prior year. Alongside the GAAP operating income data, we have included “adjusted” operating income to exclude Special items. Special items in 2021 and 2020 consist of strategic corporate reorganization costs associated with our corporate office in Atlanta, Georgia. The reconciliation of GAAP to non-GAAP financial results, as well as the Special items, are included in “Items Impacting Comparability; Non-GAAP Measures.” We believe these non-GAAP measures are important for comparability purposes.
Year Ended |
|||||||||||||||||||||
|
Reported |
|
Special |
|
Adjusted |
|
Reported |
|
Special |
|
Adjusted |
|
Adjusted |
||||||||
Dec. 26, |
items |
Dec. 26, |
|
Dec. 27, |
items |
Dec. 27, |
Increase |
||||||||||||||
(In thousands) |
|
2021 |
|
in 2021 |
|
2021 |
|
2020 |
|
in 2020 |
|
2020 |
|
(Decrease) |
|||||||
Domestic Company-owned restaurants |
$ |
49,628 |
$ |
— |
$ |
49,628 |
$ |
37,049 |
$ |
— |
$ |
37,049 |
$ |
12,579 |
|||||||
North America franchising |
120,949 |
— |
120,949 |
89,801 |
— |
89,801 |
31,148 |
||||||||||||||
North America commissaries |
39,873 |
|
— |
|
39,873 |
33,185 |
|
— |
|
33,185 |
|
6,688 |
|||||||||
International |
34,896 |
— |
34,896 |
24,034 |
— |
24,034 |
10,862 |
||||||||||||||
All others |
17,704 |
— |
17,704 |
7,043 |
— |
7,043 |
10,661 |
||||||||||||||
Unallocated corporate expenses |
(94,114) |
13,094 |
(81,020) |
(100,069) |
5,985 |
(94,084) |
13,064 |
||||||||||||||
Elimination of intersegment (profits) |
(695) |
— |
(695) |
(790) |
— |
(790) |
95 |
||||||||||||||
Total |
$ |
168,241 |
$ |
13,094 |
$ |
181,335 |
$ |
90,253 |
$ |
5,985 |
$ |
96,238 |
$ |
85,097 |
|||||||
35
The increase in operating income, excluding Special items, of $85.1 million, or 88.4% in 2021 compared to 2020 was primarily due to the following:
| ● | Domestic Company-owned restaurants increased $12.6 million in 2021 primarily due to higher profits from comparable sales increases of 11.3%, partially offset by higher commodities and labor costs. |
| ● | North America franchising increased $31.1 million in 2021 primarily due to higher comparable sales of 12.0% and a higher effective royalty rate from higher franchise royalties of $14.3 million driven by the conclusion of our temporary royalty reduction program in the third quarter of 2020. This temporary royalty support was above and beyond the level of franchise assistance the Company would incur in the ordinary course of its business. |
| ● | North America commissaries increased $6.7 million in 2021 primarily due to higher profits from higher volumes. |
| ● | International increased approximately $10.9 million in 2021 primarily due to higher royalty revenue from comparable sales of 13.0% and increased equivalent units. |
| ● | All Others, which primarily includes our online and mobile ordering business and our marketing funds, increased $10.7 million in 2021 primarily due to higher revenues from our technology platform, including our mobile ordering business. |
| ● | Unallocated corporate expenses decreased approximately $13.1 million in 2021 primarily due to our discretionary marketing fund investments of $15.0 million in 2020 which was part of our previously announced franchise assistance program that concluded in the third quarter of 2020. This decrease was partially offset by higher travel and labor costs. |
Interest expense. Interest expense increased approximately $2.2 million for the year ended December 26, 2021 primarily due to higher interest rate for our senior notes and higher average outstanding debt on our revolving credit facility drawn to partially fund the repurchase and conversion of our Series B Preferred Stock. Total debt outstanding was $490.0 million and $350.0 million as of December 26, 2021 and December 27, 2020, respectively.
Income before income taxes. Income before income taxes was $150.9 million in 2021, compared to $75.4 million in 2020, or an increase of $75.5 million due to the reasons discussed above.
Income tax expense. The effective income tax rate was 17.2% for 2021, compared to 19.6% for 2020. The effective rate was lower in 2021 due to the finalization of our 2020 federal income tax return, which resulted in a $2.7 million benefit to income tax expense. The rate also included excess tax benefits from stock option exercise and restricted shares vesting activity. The following compares income tax expense for 2021 and 2020:
Year Ended |
|||||
December 26, 2021 |
December 27, 2020 |
||||
Income before income taxes |
$ |
150,948 |
$ |
75,362 |
|
Income tax expense |
$ |
25,993 |
$ |
14,748 |
|
Effective tax rate |
17.2% |
19.6% |
|||
See “Items Impacting Comparability; Non-GAAP Measures” and “Note 7” and “Note 17” of “Notes to Consolidated Financial Statements,” for additional information.
Diluted earnings per share. Diluted earnings per common share was $0.12 for 2021 compared to diluted earnings per common share of $1.28 in 2020, representing a decrease of $1.16. Excluding Special items, adjusted diluted earnings per common share was $3.51 in 2021, compared to $1.40 in 2020, representing an increase of $2.11. Diluted earnings per common share for the year ended December 26, 2021 included $3.10 from a reduction in net income attributable to common shareholders related to the repurchase and conversion of all shares of previously outstanding Series B Preferred Stock during the second quarter. This reduction reflects the excess of the one-time cash payment over the carrying value of the Series B Preferred Stock. See “Note 6” and “Note 7” of “Notes to Consolidated Financial Statements” for additional information.
36
Items Impacting Comparability; Non-GAAP Measures
The table below reconciles our GAAP financial results to our adjusted financial results, which are non-GAAP measures (collectively defined as “Special items”). We present these non-GAAP measures because we believe the Special items impact the comparability of our results of operations. See “Note 6”, “Note 16”, and “Note 17” of “Notes to Consolidated Financial Statements,” for additional information about the Special items.
Year Ended |
||||||
Dec. 26, |
|
Dec. 27, |
||||
(In thousands, except per share amounts) |
|
2021 |
2020 |
|||
(Note) |
||||||
GAAP operating income |
$ |
168,241 |
$ |
90,253 |
||
Strategic corporate reorganization costs (1) |
13,094 |
5,985 |
||||
Adjusted operating income |
$ |
181,335 |
$ |
96,238 |
||
GAAP net income attributable to common shareholders |
$ |
4,073 |
$ |
41,737 |
||
Strategic corporate reorganization costs (1) |
13,094 |
5,985 |
||||
Repurchase and conversion of Series B Preferred Stock (2) |
109,852 |
— |
||||
Tax effect of strategic corporate reorganization costs (3) |
(2,946) |
(1,346) |
||||
Two-class impact for Non-GAAP adjustment to net income (4) |
— |
(662) |
||||
Adjusted net income attributable to common shareholders |
$ |
124,073 |
$ |
45,714 |
||
GAAP diluted earnings per common share |
$ |
0.12 |
$ |
1.28 |
||
Strategic corporate reorganization costs (1) |
0.37 |
0.18 |
||||
Repurchase and conversion of Series B Preferred Stock (2) |
3.10 |
— |
||||
Tax effect of strategic corporate reorganization costs (3) |
(0.08) |
(0.04) |
||||
Two-class impact for Non-GAAP adjustment to net income (4) |
— |
(0.02) |
||||
Adjusted diluted earnings per common share |
$ |
3.51 |
$ |
1.40 |
||
(Note) The above table does not include the impact of the allocation of undistributed earnings to participating securities for Special items in 2021.
| (1) | Represents strategic corporate reorganization costs associated with our new office in Atlanta, Georgia. |
| (2) | Represents the one-time charge related to the repurchase and conversion of all shares of Series B Preferred Stock and includes related professional fees incurred as part of the transaction. |
| (3) | The tax effect for strategic corporate reorganization costs was calculated by applying the marginal tax rate of 22.5% for 2021 and 2020, respectively. There was no tax effect on the repurchase and conversion of the Series B Preferred Stock as the one-time charge was non-deductible for tax purposes. |
| (4) | Represents an adjustment to the allocation of undistributed earnings to participating securities for the strategic corporate reorganization costs. |
The non-GAAP adjusted results shown above and within this document, which exclude the Special items, should not be construed as a substitute for or a better indicator of the Company’s performance than the Company’s GAAP results. Management believes presenting certain financial information excluding the Special items is important for purposes of comparing our historical operating results and providing transparency in how we evaluate our operating performance. Management uses these metrics to evaluate the Company’s underlying operating performance and to analyze trends.
In addition, we present free cash flow in this report, which is a non-GAAP measure. Please see “Liquidity and Capital Resources – Free Cash Flow” for a discussion of why we believe free cash flow provides useful information regarding our financial condition and results of operations, and a reconciliation of free cash flow to the most directly comparable GAAP measure.
The presentation of the non-GAAP measures in this report is made alongside the most directly comparable GAAP measures.
37
Liquidity and Capital Resources
Cash Flows
The table below summarizes our cash flows from continuing operations for each of the last two fiscal years (in thousands):
2021 |
2020 |
|||||
Total cash provided by (used in): |
||||||
Operating activities |
$ |
184,675 |
$ |
186,439 |
||
Investing activities |
(63,512) |
(41,071) |
||||
Financing activities |
(180,526) |
(43,461) |
||||
Change in cash and cash equivalents, excluding the impact of foreign currency |
$ |
(59,363) |
$ |
101,907 |
||
Operating Activities
Total cash provided by operating activities was $184.7 million for the year ended December 26, 2021 which was generally consistent with the prior year comparable period. The Company benefited from strong comparable sales growth of 12.1% in 2021 driven by our product innovation, customer retention and expansion both domestically and internationally, which more than doubled our net income to $125.0 million from $60.6 million a year ago. This was offset by unfavorable changes in working capital, including the repayment of previously deferred employer payroll taxes from the Coronavirus Aid, Relief, and Economic Security Act and the timing of payments associated with our national marketing fund.
Investing Activities
Cash flow used in investing activities was $63.5 million in 2021 compared to $41.1 million in 2020. The increase of $22.4 million was primarily driven by a $32.9 million increase in capital spend as part of our long-term growth strategy and expansion both domestically and internationally, including expenditures for the buildout of our corporate office located in Atlanta, Georgia, information technology upgrades for our corporate and restaurant facilities, and the development of Company-owned restaurants. This was partially offset by higher repayments from notes issued to franchisees.
Financing Activities
Cash flow used in financing activities was $180.5 million in 2021 compared to $43.5 million in 2020, an increase of $137.0 million. During 2021, the Company executed a new capital allocation strategy to optimize its capital structure, accelerating our long-term earnings potential and providing ongoing value to our shareholders. This strategy included cash consideration paid for the repurchase of the Company’s outstanding shares of Series B Preferred stock totaling $188.6 million, share repurchases made under the Company’s share repurchase programs of $72.5 million, and an increase to our dividend rate per common share, from $0.90 to $1.40 on an annual basis. These cash uses were partially offset by net proceeds of $60.0 million from the issuance of our 3.875% senior notes due 2029 and refinancing of our revolving credit facility, and also $80.0 million in net proceeds received from our revolving credit facility which were mainly used to fund our share repurchases.
Debt
On September 14, 2021, the Company issued $400.0 million of 3.875% senior notes (the “Notes”) which will mature on September 15, 2029. Concurrently with the issuance of the Notes, the Company entered into an amended and restated credit agreement (the “Amended Credit Agreement”) replacing the previous credit agreement (“Previous Credit Agreement”). The Amended Credit Agreement provides for a senior secured revolving credit facility in an aggregate available principal amount of $600.0 million (the “PJI Revolving Facility”), of which up to $40.0 million is available as swingline loans and up to $80.0 million is available as letters of credit. The PJI Revolving Facility will mature on September 14, 2026.
The net proceeds from the Notes, together with borrowings under the PJI Revolving Facility, were used to repay outstanding revolver and term loan borrowings under the Company’s Previous Credit Agreement.
38
Our outstanding debt as of December 26, 2021 was $490.0 million, which was comprised of $400.0 million outstanding under the Notes and $90.0 million outstanding under the PJI Revolving Facility. Remaining availability under the PJI Revolving Facility was approximately $510.0 million as of December 26, 2021.
Our Amended Credit Agreement contains affirmative and negative covenants that, among other things, require customary reporting obligations and restrict, subject to certain exceptions, the incurrence of additional indebtedness and liens, the consummation of certain mergers, consolidations, sales of assets and similar transactions, the making of investments, equity distributions and other restricted payments, and transactions with affiliates. The Company is also subject to certain financial covenants, as shown in the following table, that could restrict or impose constraints on the liquidity of our business:
|
|
Actual Ratio for the |
||
Year Ended |
||||
Permitted Ratio |
December 26, 2021 |
|||
Leverage ratio |
|
Not to exceed 5.25 to 1.0 |
|
2.0 to 1.0 |
Interest coverage ratio |
|
Not less than 2.00 to 1.0 |
|
5.0 to 1.0 |
Our leverage ratio is defined as outstanding debt divided by consolidated earnings before interest, taxes, depreciation and amortization (“EBITDA”) for the most recent four fiscal quarters. Our interest coverage ratio is defined as the sum of consolidated EBITDA and consolidated rental expense for the most recent four fiscal quarters divided by the sum of consolidated interest expense and consolidated rental expense for the most recent four fiscal quarters. We were in compliance with all financial covenants as of December 26, 2021.
In addition, the Indenture governing the Notes contains customary covenants that, among other things and subject to certain exceptions, limit our ability and the ability of certain of our subsidiaries to: incur additional indebtedness and guarantee indebtedness; pay dividends or make other distributions or repurchase or redeem our capital stock; prepay, redeem or repurchase certain debt; issue certain preferred stock or similar equity securities; make loans and investments; sell assets; incur liens; enter into transactions with affiliates; enter into agreements restricting our subsidiaries’ ability to pay dividends; and consolidate, merge or sell all or substantially all of our assets.
Papa John’s Marketing Fund, Inc. (“PJMF”), our national marketing fund, has a $20.0 million revolving line of credit (the “PJMF Revolving Facility”) pursuant to a Revolving Loan Agreement, dated September 30, 2015 with U.S. Bank National Association, as lender. There was no debt outstanding under the PJMF Revolving Facility as of December 26, 2021 or December 27, 2020. The PJMF operating results and the related debt outstanding do not impact the financial covenants under the Amended Credit Agreement.
See “Note 12” of “Notes to Consolidated Financial Statements” for additional information.
Share Repurchases
As part of our long-term growth and capital allocation strategy, we are committed to investing in share repurchases to provide ongoing value and enhanced returns to our shareholders. On October 28, 2021, our Board of Directors approved a share repurchase program with an indefinite duration for up to $425.0 million of the Company’s common stock. The share repurchase program operated alongside our previous $75.0 million share repurchase authorization, which began on November 4, 2020 and expired on December 26, 2021.
The following table summarizes our repurchase activity for the years ended December 26, 2021 and December 27, 2020:
Maximum Dollar |
|||||||||||
Total |
Average |
Aggregate |
Value of Shares |
||||||||
Number |
Price |
Cost of |
that May Yet Be |
||||||||
(in thousands, except average price per share) |
of Shares |
Paid per |
Shares |
Purchased Under the |
|||||||
Year Ended |
Purchased |
|
Share |
Purchased |
Plans or Programs |
||||||
December 26, 2021 |
594 |
$ |
121.96 |
$ |
72,499 |
$ |
424,800 |
||||
December 27, 2020 |
32 |
$ |
83.90 |
$ |
2,701 |
$ |
72,299 |
39
Subsequent to year-end, we acquired an additional 109,000 shares at an aggregate cost of $13.3 million. Approximately $411.5 million remained available under the Company’s share repurchase program as of February 17, 2022.
The Company utilizes a written trading plan under Rule 10b5-1 under the Securities Exchange Act of 1934, as amended, from time to time to facilitate the repurchase of shares of our common stock under this share repurchase program. There can be no assurance that we will repurchase shares of our common stock either through a Rule 10b5-1 trading plan or otherwise.
Dividends
The Company recorded dividends of approximately $46.0 million for the year ended December 26, 2021 consisting of the following:
| ● | $40.4 million paid to common stockholders ($1.15 per share); |
| ● | $3.0 million in preferred dividends on the Series B Preferred Stock (3.6% of the investment per annum); |
| ● | $1.5 million of common stock deemed dividend distributions in conjunction with the repurchase and conversion of the Series B Preferred Stock; and |
| ● | $1.1 million in common stock “pass-through” dividends paid to Series B Preferred Stockholders on an as-converted basis ($0.45 per share). |
The Company paid common stock dividends of $29.4 million, common stock “pass-through” dividends to Series B Preferred Stockholders of $4.6 million, and $9.1 million in preferred dividends on the Series B Preferred Stock in 2020.
On January 27, 2022, our Board of Directors declared a first quarter dividend of $0.35 per share of common stock, representing an approximate $12.7 million aggregate dividend that was paid on February 18, 2022 to common stockholders of record as of the close of business on February 7, 2022. The declaration and payment of any future dividends will be at the discretion of our Board of Directors.
Free Cash Flow
Free cash flow, a non-GAAP measure, is defined as net cash provided by operating activities (from the Consolidated Statements of Cash Flows) less the purchases of property and equipment and dividends paid to preferred stockholders. We view free cash flow as an important financial measure because it is one factor that management uses in determining the amount of cash available for discretionary investment. Free cash flow is not a term defined by GAAP, and as a result, our measure of free cash flow might not be comparable to similarly titled measures used by other companies. Free cash flow should not be construed as a substitute for or a better indicator of the Company’s performance than the Company’s GAAP measures.
The Company’s free cash flow for the last two years was as follows (in thousands):
Year Ended |
||||||
|
December 26, |
|
December 27, |
|||
2021 |
2020 |
|||||
Net cash provided by operating activities |
$ |
184,675 |
$ |
186,439 |
||
Purchases of property and equipment |
(68,559) |
(35,652) |
||||
Dividends paid to preferred stockholders (1) |
|
(6,394) |
|
(13,649) |
||
Free cash flow |
$ |
109,722 |
$ |
137,138 |
||
(1) Excludes $188.6 million of cash consideration paid for the repurchase and conversion of the Series B Preferred Stock in the second quarter of 2021.
40
Cash Requirements
The Company believes that its balances of cash and cash equivalents and borrowing capacity, along with cash generated by operations, will be sufficient to satisfy its cash requirements, cash dividends, interest payments and share repurchases over the next twelve months and beyond.
The Company’s material cash requirements as of December 26, 2021 include the following contractual obligations (in thousands):
Payments Due by Period |
|
|||||||||||||||
|
Less than |
|
|
|
After 5 |
|
|
|||||||||
1 Year |
1-3 Years |
3-5 Years |
Years |
Total |
|
|||||||||||
Contractual Obligations: |
||||||||||||||||
3.875% Senior Notes |
$ |
— |
$ |
— |
$ |
— |
$ |
400,000 |
$ |
400,000 |
||||||
Revolving Facility |
— |
— |
90,000 |
— |
90,000 |
|||||||||||
Interest payments (1) |
|
23,299 |
|
36,150 |
|
34,600 |
|
46,500 |
|
140,549 |
||||||
Total debt |
$ |
23,299 |
$ |
36,150 |
$ |
124,600 |
$ |
446,500 |
$ |
630,549 |
||||||
Operating leases (2) |
|
33,323 |
|
63,243 |
|
49,521 |
|
96,187 |
|
242,274 |
||||||
Finance leases (2) |
5,969 |
10,791 |
5,507 |
1,748 |
24,015 |
|||||||||||
Total contractual obligations |
$ |
62,591 |
$ |
110,184 |
$ |
179,628 |
$ |
544,435 |
$ |
896,838 |
||||||
| (1) | Interest payments assume an outstanding debt balance of $490.0 million. Interest payments are calculated based on LIBOR plus the applicable margin in effect at December 26, 2021, and includes the impact of interest rate swap agreements in effect. The actual interest rates on our variable rate debt and the amount of our indebtedness could vary from those used to compute the above interest payments. See “Note 12” of “Notes to Consolidated Financial Statements” for additional information concerning our debt and credit arrangements. |
| (2) | See “Note 3” of “Notes to Consolidated Financial Statements” for additional information. The above amounts exclude variable-based rents and future expected sub-lease income in the UK. |
The above table does not include the following:
| ● | Unrecognized tax benefits of $0.9 million, including interest and penalties, since we are not able to make reasonable estimates of the period of cash settlement with respect to the taxing authority. |
| ● | Redeemable noncontrolling interests of $5.5 million as we are not able to predict the timing of the redemptions. |
| ● | Expected capital expenditures of approximately $75.0 million to $85.0 million in 2022, which the Company expects to spend primarily on the buildout and development of Company-owned stores and technological enhancements. |
Impact of Inflation
From time to time, we experience the impacts of inflation, which cause increased food, labor and benefits costs and higher operating expenses. To the extent permitted by competition, increased costs are recovered through a combination of menu price increases and/or implementing other cost reductions.
41
Off-Balance Sheet Arrangements
We guarantee leases for certain Papa John’s North American franchisees who have purchased restaurants that were previously Company-owned. We are contingently liable on these leases. These leases have varying terms, the latest of which expires in 2036. As of December 26, 2021, the estimated maximum amount of undiscounted payments the Company could be required to make in the event of nonpayment by the primary lessees was approximately $11.5 million.
We have certain other commercial commitments where payment is contingent upon the occurrence of certain events. With our insurance programs, we are party to surety bonds with off-balance sheet risk as follows by year (in thousands):
Amount of Commitment Expiration Per Period |
|||||||||||||||
|
Less than |
|
1-3 |
|
3-5 |
|
After |
|
|
||||||
1 Year |
Years |
Years |
5 Years |
Total |
|||||||||||
Surety bonds |
$ |
45,748 |
$ |
— |
$ |
— |
$ |
— |
$ |
45,748 |
|||||
The surety bond arrangements expire within one year but have automatic renewal clauses. See “Note 12” and “Note 19” of “Notes to Consolidated Financial Statements” for additional information related to contractual and other commitments.
Forward-Looking Statements
Certain matters discussed in this Annual Report on Form 10-K and other Company communications that are not statements of historical fact constitute forward-looking statements within the meaning of the federal securities laws. Generally, the use of words such as “expect,” “intend,” “estimate,” “believe,” “anticipate,” “will,” “forecast,” “plan,” “project,” or similar words identify forward-looking statements that we intend to be included within the safe harbor protections provided by the federal securities laws. Such forward-looking statements include or may relate to projections or guidance concerning business performance, revenue, earnings, cash flow, earnings per share, share repurchases, the financial impact of the temporary business opportunities, disruptions and temporary changes in demand we are experiencing related to the current outbreak of the COVID-19 pandemic and the related restrictions, commodity costs, currency fluctuations, profit margins, unit growth, unit level performance, capital expenditures, restaurant and franchise development, the duration of changes in consumer behavior caused by the pandemic, labor shortages, inflation, reorganization costs and the related organizational, employment and real estate changes from opening our new office in Atlanta, royalty relief, the effectiveness of our menu innovations and other business initiatives, marketing efforts, liquidity, compliance with debt covenants, strategic decisions and actions, dividends, effective tax rates, regulatory changes and impacts, adoption of new accounting standards, and other financial and operational measures. Such statements are not guarantees of future performance and involve certain risks, uncertainties and assumptions, which are difficult to predict and many of which are beyond our control. Therefore, actual outcomes and results may differ materially from those matters expressed or implied in such forward-looking statements. The risks, uncertainties and assumptions that are involved in our forward-looking statements include, but are not limited to:
| ● | the ability of the Company to manage difficulties and opportunities associated with or related to the COVID-19 pandemic or the cessation thereof in the future, including risks related to: the impact of governmental restrictions on freedom of movement and business operations including quarantines, social distancing requirements and mandatory business closures; changes in consumer demand or behavior; labor shortages at Company and/or franchised stores and our quality control centers; impact of delayed new store openings, both domestically and internationally; vaccine mandates; our ability to navigate changing governmental programs and regulations relating to the pandemic; and the increased risk of phishing, ransomware and other cyber-attacks; |
| ● | our ability to fully realize the anticipated benefits of our corporate reorganization and new office in Atlanta, Georgia; |
| ● | increased costs for branding initiatives and launching new advertising and marketing campaigns and promotions to boost consumer sentiment and sales trends, and the risk that such initiatives will not be effective; |
| ● | risks related to social media, including publicity adversely and rapidly impacting our brand and reputation; |
| ● | aggressive changes in pricing or other marketing or promotional strategies by competitors, which may adversely affect sales and profitability; and new product and concept developments by food industry competitors; |
42
| ● | changes in consumer preferences or consumer buying habits, including the growing popularity of delivery aggregators, as well as changes in general economic conditions or other factors that may affect consumer confidence and discretionary spending, including higher unemployment; |
| ● | the adverse impact on the Company or our results caused by global health concerns, product recalls, food quality or safety issues, incidences of foodborne illness, food contamination and other general public health concerns about our Company-owned or franchised restaurants or others in the restaurant industry; |
| ● | the effectiveness of our technology investments and changes in unit-level operations; |
| ● | the ability of the Company and its franchisees to meet planned growth targets and operate new and existing restaurants profitably, including difficulties finding qualified franchisees, store level employees or suitable sites; |
| ● | increases in labor costs, food costs or sustained higher other operating costs, including as a result of supply chain disruption and inflation. This could also include increased employee compensation, including as a result of labor shortages, changes in minimum wage, benefits, insurance, tax rates, new regulatory requirements or increasing compliance costs; |
| ● | increases in insurance claims and related costs for programs funded by the Company up to certain retention limits, including medical, owned and non-owned vehicles, workers’ compensation, general liability and property; |
| ● | disruption of our supply chain or commissary operations which could be caused by our sole source of supply of mozzarella cheese, desserts, garlic cups or limited source of suppliers for other key ingredients or more generally due to weather, natural disasters including drought, disease, or geopolitical or other disruptions beyond our control, including COVID-19; |
| ● | increased risks associated with our international operations, including economic and political conditions and risks associated with the withdrawal of the UK from the European Union, instability or uncertainty in our international markets, especially emerging markets, fluctuations in currency exchange rates, difficulty in meeting planned sales targets and new store growth; |
| ● | the impact of current or future claims and litigation and our ability to comply with current, proposed or future legislation that could impact our business including compliance with the European Union General Data Protection Regulation; |
| ● | the Company's ability to continue to pay dividends to stockholders based upon profitability, cash flows and capital adequacy if restaurant sales and operating results decline; |
| ● | disruption of critical business or information technology systems, or those of our suppliers, and risks associated with systems failures and data privacy and security breaches, including theft of confidential Company, employee and customer information, including payment cards; and |
| ● | changes in Federal or state income, general and other tax laws, rules and regulations and changes in generally accepted accounting principles. |
These and other risk factors are discussed in detail in “Part I. Item 1A. — Risk Factors” of this Annual Report on Form 10-K. We undertake no obligation to update publicly any forward-looking statements, whether as a result of future events, new information or otherwise, except as required by law.
43
Item 7A. Quantitative and Qualitative Disclosures About Market Risk
Interest Rate Risk
We are exposed to the impact of interest rate changes on our PJI Revolving Facility. We attempt to minimize interest rate risk exposure by fixing our interest rate through the utilization of interest rate swaps, which are derivative financial instruments. The interest rate swaps were eligible for hedge accounting for part of the period and were de-designated following the issuance of the Notes. Our swaps are entered into with financial institutions that participate in the PJI Revolving Facility. By using a derivative instrument to hedge exposures to changes in interest rates, we expose ourselves to credit risk due to the possible failure of the counterparty to perform under the terms of the derivative contract. We do not enter into contracts for trading purposes and do not use leveraged instruments. See “Note 12” of “Notes to Consolidated Financial Statements” for additional information on our debt obligations and derivative instruments.
Foreign Currency Exchange Rate Risk
We are exposed to foreign currency exchange rate fluctuations from our operations outside of the United States, which can adversely impact our revenues, net income and cash flows. Our international operations principally consist of distribution sales to franchised Papa John’s restaurants located in the United Kingdom and our franchise sales and support activities, which derive revenues from sales of franchise and development rights and the collection of royalties from our international franchisees. Approximately 7.3% of our 2021 revenues, 6.8% of our 2020 revenues and 7.8% of our 2019 revenues were derived from these international operations.
We have not historically hedged our exposure to foreign currency fluctuations. Foreign currency exchange rate fluctuations had a favorable impact of approximately $8.1 million on our consolidated revenues in 2021 compared to an unfavorable impact of approximately $600,000 in 2020. Foreign currency exchange rates had a favorable impact of $1.4 million on our operating income in 2021 compared to an unfavorable impact of $1.0 million in 2020. A 10% adverse change in the foreign currency rates for our international markets would result in an additional negative impact on annual revenue and operating income of approximately $15.6 million and $3.3 million, respectively.
Commodity Price Risk
In the ordinary course of business, the food and paper products we purchase, including cheese (our largest ingredient cost), are subject to seasonal fluctuations, weather, availability, demand and other factors that are beyond our control. We have pricing agreements with some of our vendors, including forward pricing agreements for a portion of our cheese purchases for our domestic Company-owned restaurants, which are accounted for as normal purchases; however, we still remain exposed to on-going commodity volatility.
The following table presents the actual average block price for cheese by quarter in 2021, 2020 and 2019. Also presented is the projected 2022 average block price by quarter (based on the February 17, 2022 Chicago Mercantile Exchange cheese futures prices):
|
2022 |
|
2021 |
|
2020 |
|
2019 |
|||||
Projected |
Block |
Block |
Block |
|||||||||
Market |
Price |
Price |
Price |
|||||||||
Quarter 1 |
$ |
1.956 |
$ |
1.676 |
$ |
1.857 |
$ |
1.490 |
||||
Quarter 2 |
|
2.088 |
|
1.680 |
|
1.679 |
|
1.696 |
||||
Quarter 3 |
|
2.095 |
|
1.676 |
|
2.262 |
|
1.898 |
||||
Quarter 4 |
|
2.031 |
|
1.786 |
|
2.235 |
|
1.984 |
||||
Full Year |
$ |
2.043 |
$ |
1.705 |
$ |
2.008 |
$ |
1.767 |
||||
44
Item 8. Financial Statements and Supplementary Data
Report of Independent Registered Public Accounting Firm (PCAOB ID
Consolidated Financial Statements:
| ● | Consolidated Statements of Operations for the years ended December 26, 2021, December 27, 2020 and December 29, 2019 |
| ● | Consolidated Statements of Comprehensive Income (Loss) for the years ended December 26, 2021, December 27, 2020 and December 29, 2019 |
| ● | Consolidated Balance Sheets as of December 26, 2021 and December 27, 2020 |
| ● | Consolidated Statements of Stockholders’ Deficit for the years ended December 26, 2021, December 27, 2020 and December 29, 2019 |
| ● | Consolidated Statements of Cash Flows for the years ended December 26, 2021, December 27, 2020 and December 29, 2019 |
| ● | Notes to Consolidated Financial Statements |
45
Report of Independent Registered Public Accounting Firm
To the Stockholders and the Board of Directors of Papa John’s International, Inc. and Subsidiaries
Opinion on the Financial Statements
We have audited the accompanying consolidated balance sheets of Papa John’s International, Inc. and Subsidiaries (the Company) as of December 26, 2021 and December 27, 2020, the related consolidated statements of operations, comprehensive income (loss), stockholders' deficit and cash flows for each of the three years in the period ended December 26, 2021, and the related notes (collectively referred to as the “consolidated financial statements”). In our opinion, the consolidated financial statements present fairly, in all material respects, the financial position of the Company at December 26, 2021 and December 27, 2020, and the results of its operations and its cash flows for each of the three years in the period ended December 26, 2021, in conformity with U.S. generally accepted accounting principles.
We also have audited, in accordance with the standards of the Public Company Accounting Oversight Board (United States) (PCAOB), the Company's internal control over financial reporting as of December 26, 2021, based on criteria established in Internal Control-Integrated Framework issued by the Committee of Sponsoring Organizations of the Treadway Commission (2013 Framework), and our report dated February 24, 2022, expressed an unqualified opinion thereon.
Basis for Opinion
These financial statements are the responsibility of the Company's management. Our responsibility is to express an opinion on the Company’s financial statements based on our audits. We are a public accounting firm registered with the PCAOB and are required to be independent with respect to the Company in accordance with the U.S. federal securities laws and the applicable rules and regulations of the Securities and Exchange Commission and the PCAOB.
We conducted our audits in accordance with the standards of the PCAOB. Those standards require that we plan and perform the audit to obtain reasonable assurance about whether the financial statements are free of material misstatement, whether due to error or fraud. Our audits included performing procedures to assess the risks of material misstatement of the financial statements, whether due to error or fraud, and performing procedures that respond to those risks. Such procedures included examining, on a test basis, evidence regarding the amounts and disclosures in the financial statements. Our audits also included evaluating the accounting principles used and significant estimates made by management, as well as evaluating the overall presentation of the financial statements. We believe that our audits provide a reasonable basis for our opinion.
Critical Audit Matters
The critical audit matters communicated below are matters arising from the current period audit of the consolidated financial statements that were communicated or required to be communicated to the audit committee and that: (1) relate to accounts or disclosures that are material to the financial statements and (2) involved our especially challenging, subjective or complex judgments. The communication of critical audit matters does not alter in any way our opinion on the consolidated financial statements, taken as a whole, and we are not, by communicating the critical audit matters below, providing separate opinions on the critical audit matters or on the accounts or disclosures to which they relate.
46
Measurement and valuation of insurance reserves |
|
Description of the Matter |
As described in Note 2 to the consolidated financial statements, the Company is self-insured for certain obligations up to stated retention levels under its retention programs related to workers’ compensation, automobile, property and general liability programs. As of December 26, 2021, the Company has $88.1 million accrued for self-insurance reserves (“Insurance Reserves”). Judgments and estimates are used by the Company in determining the potential value associated with incurred but not reported claims.
|
Auditing the valuation of the Insurance Reserves is highly judgmental and complex due to the significant uncertainty in estimating the potential value of reported claims, estimating the number and potential value of incurred but not reported claims and the use of actuarial valuation methods. The reserve estimate is sensitive to actuarial assumptions (e.g., future emergence of losses, incurred but not reported claims) used to estimate the ultimate liability for reported claims and claims that have been incurred but have not been reported. |
|
How We Addressed the Matter in Our Audit |
We tested controls related to the measurement and valuation of the Insurance Reserves. For example, we tested controls over management’s review of the assumptions and methods used to establish the estimate, the underlying data, significant actuarial assumptions and the related reconciliations.
To test the measurement and valuation of the Insurance Reserves, our audit procedures included, among others, performing transactional tests of details over the completeness and accuracy of claims data and vouching payments made to third parties. Furthermore, we involved our actuarial specialists to assist in the evaluation of the key assumptions and methodologies used by management to determine the Insurance Reserves. |
Measurement and valuation of allowance for credit losses for franchisee notes receivable |
|
Description of the Matter |
As described in Note 10 to the consolidated financial statements, the Company has an allowance for credit losses for franchisee notes receivable of $1.5 million (“Allowance for Credit Losses for Franchisee Notes Receivable”) against a gross balance of franchisee notes receivable of $49.4 million as of December 26, 2021. The Allowance for Credit Losses for Franchisee Notes Receivable is estimated to reduce the outstanding notes receivable for expected credit losses after consideration of the fair value of the Company’s collateral rights (e.g., underlying franchisee business, property and equipment) and any guarantees as well as a review of each franchisee’s economic performance, historical loss information, current market conditions, and future economic conditions.
Auditing the Allowance for Credit Losses for Franchisee Notes Receivable is challenging due to the judgment inherent in estimating the fair value of the Company’s collateral rights, which has a significant effect on measurement and valuation.
|
47
How We Addressed the Matter in Our Audit |
We tested controls related to the measurement and valuation of the Allowance for Credit Losses for Franchisee Notes Receivable. For example, we tested controls over management’s review of the progression of outstanding notes receivable and the Allowance for Credit Losses for Franchisee Notes Receivable and the overall review of its adequacy. Where judgment was exercised by management, our audit procedures included testing controls over management’s evaluation of the assumptions, including the fair value of the collateral rights and guarantees where collateral is available or personal guarantee given in connection with issuance of the applicable note. Our control testing also considered management’s review over the completeness and accuracy of the underlying data used in evaluating the measurement and valuation of the Allowance for Credit Losses for Franchisee Notes Receivable.
To test the measurement and valuation of the Allowance for Credit Losses for Franchisee Notes Receivable, our audit procedures included, among others, evaluating the status of collection of scheduled payments for outstanding notes receivable, analyzing unit economics for franchisees to identify indicators of their financial health, evaluating the estimates of collateral value, and the underlying data used by management. |
|
/s/
We have served as the Company’s auditor since 2019.
February 24, 2022 |
48
Papa John’s International, Inc. and Subsidiaries
Consolidated Statements of Operations
Year ended |
|||||||||
|
December 26, |
|
December 27, |
|
December 29, |
||||
(In thousands, except per share amounts) |
|
2021 |
2020 |
2019 |
|||||
Revenues: |
|||||||||
Domestic Company-owned restaurant sales |
$ |
|
$ |
|
$ |
|
|||
North America franchise royalties and fees |
|
|
|
|
|
|
|||
North America commissary revenues |
|
|
|
|
|
|
|||
International revenues |
|
|
|
|
|||||
Other revenues |
|
|
|
||||||
Total revenues |
|
|
|
|
|
|
|||
Costs and expenses: |
|||||||||
Operating costs (excluding depreciation and amortization shown separately below): |
|||||||||
Domestic Company-owned restaurant expenses |
|
|
|
||||||
North America commissary expenses |
|
|
|
||||||
International expenses |
|
|
|
||||||
Other expenses |
|
|
|
||||||
General and administrative expenses |
|
|
|
|
|
|
|||
Depreciation and amortization |
|
|
|
|
|
|
|||
Total costs and expenses |
|
|
|
|
|
|
|||
Refranchising gains |
|
— |
|
— |
|
|
|||
Operating income |
|
|
|
|
|
|
|||
Investment income |
|
|
|
||||||
Interest expense |
|
( |
( |
( |
|||||
Income before income taxes |
|
|
|
|
|
|
|||
Income tax expense (benefit) |
|
|
|
|
|
( |
|||
Net income before attribution to noncontrolling interests |
|
|
|
|
|
|
|||
Net income attributable to noncontrolling interests |
|
( |
|
( |
|
( |
|||
Net income attributable to the Company |
$ |
|
$ |
|
$ |
|
|||
Calculation of net income (loss) for earnings (loss) per share: |
|||||||||
Net income attributable to the Company |
$ |
|
$ |
|
$ |
|
|||
Dividends on redemption of Series B Convertible Preferred Stock |
( |
— |
— |
||||||
Dividends paid to participating securities |
|
( |
|
( |
|
( |
|||
Net income attributable to participating securities |
|
— |
|
( |
|
— |
|||
Net income (loss) attributable to common shareholders |
$ |
|
$ |
|
$ |
( |
|||
Basic earnings (loss) per common share |
$ |
|
$ |
|
$ |
( |
|||
Diluted earnings (loss) per common share |
$ |
|
$ |
|
$ |
( |
|||
Basic weighted average common shares outstanding |
|
|
|
|
|
|
|||
Diluted weighted average common shares outstanding |
|
|
|
|
|
|
|||
Dividends declared per common share |
$ |
|
$ |
|
$ |
|
|||
See accompanying notes.
49
Papa John’s International, Inc. and Subsidiaries
Consolidated Statements of Comprehensive Income (Loss)
Year Ended |
|||||||||
December 26, |
|
December 27, |
|
December 29, |
|||||
(In thousands) |
|
2021 |
2020 |
2019 |
|||||
Net income before attribution to noncontrolling interests |
$ |
|
$ |
|
$ |
|
|||
Other comprehensive income (loss), before tax: |
|||||||||
Foreign currency translation adjustments |
|
( |
|
|
|
|
|||
Interest rate swaps (1) |
|
|
|
( |
|
( |
|||
Other comprehensive income (loss), before tax |
|
|
|
( |
|
( |
|||
Income tax effect: |
|||||||||
Foreign currency translation adjustments |
|
|
|
( |
|
( |
|||
Interest rate swaps (2) |
|
( |
|
|
|
|
|||
Income tax effect |
|
( |
|
|
|
|
|||
Other comprehensive income (loss), net of tax |
|
|
|
( |
|
( |
|||
Comprehensive income (loss) before attribution to noncontrolling interests |
|
|
|
|
|
( |
|||
Less: comprehensive (income) loss, redeemable noncontrolling interests |
|
( |
|
( |
|
|
|||
Less: comprehensive (income), nonredeemable noncontrolling interests |
|
( |
|
( |
|
( |
|||
Comprehensive income (loss) attributable to the Company |
$ |
|
$ |
|
$ |
( |
|||
See accompanying notes.
50
Papa John’s International, Inc. and Subsidiaries
Consolidated Balance Sheets
|
December 26, |
|
December 27, |
|||
(In thousands, except per share amounts) |
2021 |
2020 |
||||
Assets |
||||||
Current assets: |
||||||
Cash and cash equivalents |
$ |
|
$ |
|
||
Accounts receivable (less allowance for credit losses of $ |
|
|
||||
Notes receivable, current portion |
|
|
|
|
||
Income tax receivable |
|
|
||||
Inventories |
|
|
|
|
||
Prepaid expenses and other current assets |
|
|
|
|
||
Total current assets |
|
|
|
|
||
Property and equipment, net |
|
|
|
|
||
Finance lease right-of-use assets, net |
|
|
||||
Operating lease right-of-use assets |
|
|
||||
Notes receivable, less current portion (less allowance for credit losses of $ |
|
|
|
|
||
Goodwill |
|
|
|
|
||
Deferred income taxes |
|
|
||||
Other assets |
|
|
|
|
||
Total assets |
$ |
|
$ |
|
||
Liabilities, Series B Convertible Preferred Stock, Redeemable noncontrolling interests and Stockholders’ deficit |
||||||
Current liabilities: |
||||||
Accounts payable |
$ |
|
$ |
|
||
Income and other taxes payable |
|
|
|
|
||
Accrued expenses and other current liabilities |
|
|
|
|
||
Current deferred revenue |
|
|
||||
Current finance lease liabilities |
|
|
||||
Current operating lease liabilities |
|
|
||||
Current portion of long-term debt |
— |
|
||||
Total current liabilities |
|
|
|
|
||
Deferred revenue |
|
|
|
|
||
Long-term finance lease liabilities |
|
|
||||
Long-term operating lease liabilities |
|
|
||||
Long-term debt, less current portion, net |
|
|
|
|
||
Deferred income taxes |
|
|
|
|
||
Other long-term liabilities |
|
|
|
|
||
Total liabilities |
|
|
|
|
||
Series B Convertible Preferred Stock; $ |
— |
|
||||
Redeemable noncontrolling interests |
|
|
|
|
||
Stockholders’ deficit: |
||||||
Common stock ($ |
|
|
||||
Additional paid-in capital |
|
|
|
|
||
Accumulated other comprehensive loss |
|
( |
|
( |
||
Retained earnings |
|
|
|
|
||
Treasury stock ( |
|
( |
|
( |
||
Total stockholders’ deficit |
|
( |
|
( |
||
Noncontrolling interests in subsidiaries |
|
|
|
|
||
Total Stockholders’ deficit |
|
( |
|
( |
||
Total liabilities, Series B Convertible Preferred Stock, Redeemable noncontrolling interests and |
$ |
|
$ |
|
||
See accompanying notes.
51
Papa John’s International, Inc. and Subsidiaries
Consolidated Statements of Stockholders’ Deficit
Papa John’s International, Inc. |
|||||||||||||||||||||||
|
Common |
|
|
|
|
|
Accumulated |
|
|
|
|
|
|
|
|||||||||
Stock |
Additional |
Other |
Noncontrolling |
Total |
|||||||||||||||||||
Shares |
Common |
Paid-In |
Comprehensive |
Retained |
Treasury |
Interests in |
Stockholders’ |
||||||||||||||||
(In thousands) |
Outstanding |
Stock |
Capital |
Loss |
Earnings |
Stock |
Subsidiaries |
Deficit |
|||||||||||||||
Balance at December 30, 2018 |
|
|
$ |
|
$ |
|
$ |
( |
$ |
|
$ |
( |
$ |
|
$ |
( |
|||||||
Net income (1) |
|
— |
|
— |
|
— |
|
— |
|
|
|
— |
|
|
|
|
|||||||
Other comprehensive loss, net of tax |
|
— |
|
— |
|
— |
|
( |
|
— |
|
— |
|
— |
|
( |
|||||||
Cash dividends on common stock |
— |
|
— |
|
|
|
— |
|
( |
|
— |
|
— |
|
( |
||||||||
Cash dividends on preferred stock |
— |
— |
— |
— |
( |
— |
— |
( |
|||||||||||||||
Dividends declared on preferred stock |
— |
— |
— |
— |
( |
— |
— |
( |
|||||||||||||||
Exercise of stock options |
|
|
|
|
|
|
|
— |
|
— |
|
— |
|
— |
|
|
|||||||
Stock-based compensation expense |
— |
|
— |
|
|
|
— |
|
— |
|
— |
|
— |
|
|
||||||||
Issuance of restricted stock |
|
|
|
— |
|
( |
|
— |
|
— |
|
|
|
— |
|
— |
|||||||
Tax effect of restricted stock awards |
|
— |
|
— |
|
( |
|
— |
|
— |
|
— |
|
— |
|
( |
|||||||
Distributions to noncontrolling interests |
— |
— |
— |
— |
— |
— |
( |
|
( |
||||||||||||||
Other |
|
|
|
— |
|
( |
|
— |
|
( |
|
|
|
— |
|
|
|||||||
Balance at December 29, 2019 |
|
|
$ |
|
$ |
|
$ |
( |
$ |
|
$ |
( |
$ |
|
$ |
( |
|||||||
Cumulative effect of adoption of ASU 2016-13 (2) |
|
— |
|
— |
|
— |
|
— |
|
( |
|
— |
|
— |
|
( |
|||||||
Adjusted balance at December 30, 2019 |
|
|
|
|
|
|
|
( |
|
|
|
( |
|
|
|
( |
|||||||
Net income (1) |
|
— |
|
— |
|
— |
|
— |
|
|
|
— |
|
|
|
|
|||||||
Other comprehensive loss, net of tax |
|
— |
|
— |
|
— |
|
( |
|
— |
|
— |
|
— |
|
( |
|||||||
Cash dividends on common stock |
|
— |
|
— |
|
|
|
— |
|
( |
|
— |
|
— |
|
( |
|||||||
Cash dividends on preferred stock |
— |
— |
— |
— |
( |
— |
— |
( |
|||||||||||||||
Exercise of stock options |
|
|
|
|
|
|
|
— |
|
— |
|
— |
|
— |
|
|
|||||||
Acquisition of Company common stock |
( |
— |
— |
— |
— |
( |
— |
( |
|||||||||||||||
Stock-based compensation expense |
|
— |
|
— |
|
|
|
— |
|
— |
|
— |
|
— |
|
|
|||||||
Issuance of restricted stock |
|
|
|
— |
|
( |
|
— |
|
— |
|
|
|
— |
|
— |
|||||||
Tax effect of restricted stock awards |
|
— |
|
— |
|
( |
|
— |
|
— |
|
— |
|
— |
|
( |
|||||||
Distributions to noncontrolling interests |
— |
— |
— |
— |
— |
— |
( |
( |
|||||||||||||||
Other |
|
|
|
— |
|
( |
|
— |
|
( |
|
|
|
— |
|
|
|||||||
Balance at December 27, 2020 |
|
|
$ |
|
$ |
|
$ |
( |
$ |
|
$ |
( |
$ |
|
$ |
( |
|||||||
52
Papa John’s International, Inc. and Subsidiaries
Consolidated Statements of Stockholders’ Deficit (continued)
Papa John’s International, Inc. |
|||||||||||||||||||||||
|
Common |
|
|
|
|
|
Accumulated |
|
|
|
|
|
|
|
|||||||||
Stock |
Additional |
Other |
Noncontrolling |
Total |
|||||||||||||||||||
Shares |
Common |
Paid-In |
Comprehensive |
Retained |
Treasury |
Interests in |
Stockholders’ |
||||||||||||||||
(In thousands) |
Outstanding |
Stock |
Capital |
Loss |
Earnings |
Stock |
Subsidiaries |
Deficit |
|||||||||||||||
Balance at December 27, 2020 |
|
|
$ |
|
$ |
|
$ |
( |
$ |
|
$ |
( |
$ |
|
$ |
( |
|||||||
Net income (1) |
|
— |
|
— |
|
— |
|
— |
|
|
|
— |
|
|
|
|
|||||||
Other comprehensive income, net of tax |
|
— |
|
— |
|
— |
|
|
|
— |
|
— |
|
— |
|
|
|||||||
Repurchase and conversion of Series B Convertible Preferred Stock |
|
|
|
— |
( |
— |
— |
|
|||||||||||||||
Cash dividends on common stock |
— |
— |
|
— |
( |
— |
— |
( |
|||||||||||||||
Cash dividends on preferred stock |
|
— |
|
— |
|
— |
|
— |
|
( |
|
— |
|
— |
|
( |
|||||||
Exercise of stock options |
|
|
|
|
|
|
|
— |
|
— |
|
— |
|
— |
|
|
|||||||
Acquisition of Company common stock |
( |
— |
— |
— |
— |
( |
— |
( |
|||||||||||||||
Stock-based compensation expense |
|
— |
|
— |
|
|
|
— |
|
— |
|
— |
|
— |
|
|
|||||||
Issuance of restricted stock |
|
|
|
— |
|
( |
|
— |
|
— |
|
|
|
— |
|
— |
|||||||
Tax effect of restricted stock awards |
|
— |
|
— |
|
( |
|
— |
|
— |
|
— |
|
— |
|
( |
|||||||
Distributions to noncontrolling interests |
|
— |
|
— |
|
— |
|
— |
|
— |
|
— |
|
( |
|
( |
|||||||
Other |
|
|
|
— |
|
|
|
— |
|
( |
|
|
|
— |
|
|
|||||||
Balance at December 26, 2021 |
|
|
$ |
|
$ |
|
$ |
( |
$ |
|
$ |
( |
$ |
|
$ |
( |
|||||||
| (1) |
Net income to the Company at December 26, 2021, December 27, 2020 and December 29, 2019 excludes $ |
| (2) | As of December 30, 2019, the Company adopted ASU 2016-13, “Financial Instruments – Credit Losses (Topic 326): Measurement of Credit Losses on Financial Instruments”. See “Note 10” of “Notes to Consolidated Financial Statements” for additional information. |
At December 26, 2021, the accumulated other comprehensive loss of $
At December 27, 2020, the accumulated other comprehensive loss of $
At December 29, 2019, the accumulated other comprehensive loss of $
See accompanying notes.
53
Papa John’s International, Inc. and Subsidiaries
Consolidated Statements of Cash Flows
Year ended |
|||||||||
December 26, |
|
December 27, |
|
December 29, |
|||||
(In thousands) |
2021 |
2020 |
2019 |
||||||
Operating activities |
|||||||||
Net income before attribution to noncontrolling interests |
$ |
|
$ |
|
$ |
|
|||
Adjustments to reconcile net income to net cash provided by operating activities: |
|||||||||
(Benefit) provision for allowance for credit losses on accounts and notes receivable |
|
( |
|
( |
|
|
|||
Depreciation and amortization |
|
|
|
|
|
|
|||
Deferred income taxes |
|
|
|
( |
|
( |
|||
Preferred stock option mark-to-market adjustment |
— |
— |
|
||||||
Stock-based compensation expense |
|
|
|
|
|
|
|||
(Gain) on refranchising |
— |
— |
( |
||||||
Other |
|
|
|
|
|
|
|||
Changes in operating assets and liabilities, net of acquisitions: |
|||||||||
Accounts receivable |
|
|
|
( |
|
( |
|||
Income tax receivable |
( |
|
|
||||||
Inventories |
|
( |
|
( |
|
( |
|||
Prepaid expenses and other current assets |
|
|
|
|
|
|
|||
Other assets and liabilities |
|
( |
|
|
|
( |
|||
Accounts payable |
|
( |
|
|
|
|
|||
Income and other taxes payable |
|
|
|
|
|
|
|||
Accrued expenses and other current liabilities |
|
|
|
|
|
( |
|||
Deferred revenue |
|
|
|
( |
|
( |
|||
Net cash provided by operating activities |
|
|
|
|
|
|
|||
Investing activities |
|||||||||
Purchases of property and equipment |
|
( |
|
( |
|
( |
|||
Notes issued |
|
( |
|
( |
|
( |
|||
Repayments of notes issued |
|
|
|
|
|
|
|||
Acquisitions, net of cash acquired |
|
( |
|
— |
|
— |
|||
Proceeds from divestitures of restaurants |
|
— |
|
— |
|
|
|||
Other |
|
|
|
|
|
|
|||
Net cash used in investing activities |
|
( |
|
( |
|
( |
|||
Financing activities |
|||||||||
Proceeds from issuance of senior notes |
|
— |
— |
||||||
Repayments of term loan |
( |
( |
( |
||||||
Net proceeds (repayments) of revolving credit facilities |
|
|
|
— |
|
( |
|||
Debt issuance costs |
( |
— |
— |
||||||
Repurchase of Series B Convertible Preferred Stock |
( |
— |
— |
||||||
Proceeds from issuance of Series B Convertible Preferred Stock |
— |
— |
|
||||||
Issuance costs associated with Series B Convertible Preferred Stock |
— |
— |
( |
||||||
Acquisition of Company common stock |
|
( |
|
( |
|
— |
|||
Proceeds from exercise of stock options |
|
|
|
|
|
|
|||
Dividends paid to common stockholders |
( |
( |
( |
||||||
Dividends paid to preferred stockholders |
|
( |
|
( |
|
( |
|||
Tax payments for equity award issuances |
|
( |
|
( |
|
( |
|||
Contributions from noncontrolling interests |
— |
— |
|
||||||
Distributions to noncontrolling interests |
|
( |
|
( |
|
( |
|||
Other |
|
( |
|
( |
|
( |
|||
Net cash used in financing activities |
|
( |
|
( |
|
( |
|||
Effect of exchange rate changes on cash and cash equivalents |
|
( |
|
|
|
|
|||
Change in cash and cash equivalents |
|
( |
|
|
|
( |
|||
Cash and cash equivalents at beginning of period |
|
|
|
|
|
|
|||
Cash and cash equivalents at end of period |
$ |
|
$ |
|
$ |
|
|||
See accompanying notes.
54
Papa John’s International, Inc. and Subsidiaries
Notes to Consolidated Financial Statements
1. Description of Business
Papa John’s International, Inc. (referred to as the “Company,” “Papa John’s” or in the first person notations of “we,” “us” and “our”), operates and franchises pizza delivery and carryout restaurants under the trademark “Papa John’s,” in
2. Significant Accounting Policies
Principles of Consolidation
The accompanying Consolidated Financial Statements include the accounts of Papa John’s International, Inc. and its subsidiaries. All intercompany balances and transactions have been eliminated.
Fiscal Year
Our fiscal year ends on the last Sunday in December of each year. All fiscal years presented consist of
Use of Estimates
The preparation of Consolidated Financial Statements in conformity with accounting principles generally accepted in the United States requires management to make estimates and assumptions that affect the amounts reported in the Consolidated Financial Statements and accompanying notes. Significant items that are subject to such estimates and assumptions include the allowance for credit losses on accounts and notes receivable, intangible assets, contract assets and contract liabilities including the customer loyalty program obligation, right-of-use assets and lease liabilities, gift card breakage, insurance reserves and tax reserves. Although management bases its estimates on historical experience and assumptions that are believed to be reasonable under the circumstances, actual results could significantly differ from these estimates.
Revenue Recognition
Revenue is measured based on consideration specified in contracts with customers and excludes waivers or incentives and amounts collected on behalf of third parties, primarily sales tax. The Company recognizes revenue when it satisfies a performance obligation by transferring control over a product or service to a customer. Taxes assessed by a governmental authority that are both imposed on and concurrent with a specific revenue-producing transaction, that are collected by the Company from a customer, are excluded from revenue. Delivery costs, including freight associated with our domestic commissary and other sales, are accounted for as fulfillment costs and are included in operating costs.
The following describes principal activities, separated by major product or service, from which the Company generates its revenues:
Domestic Company-owned Restaurant Sales
The domestic Company-owned restaurants principally generate revenue from retail sales of high-quality pizza, Papadias, which are flatbread-style sandwiches, and side items including breadsticks, cheesesticks, chicken poppers and wings, dessert items and canned or bottled beverages. Revenues from Company-owned restaurants are recognized when the products are delivered to or carried out by customers.
55
Our North American customer loyalty program, Papa Rewards, is a spend-based program that rewards customers with points for each purchase. Papa Rewards points are accumulated and redeemed for dollar off discounts (“Papa Dough”) to be used on future purchases within a
Franchise Royalties and Fees
Franchise royalties, which are based on a percentage of franchise restaurant sales, are recognized as sales occur. Any royalty reductions, including waivers or those offered as part of a new store development incentive or as incentive for other behaviors, including acceleration of restaurant remodels or equipment upgrades, are recognized at the same time as the related royalty, as they are not separately distinguishable from the full royalty rate. Our current standard franchise agreement requires the franchisee to pay a royalty fee of
The majority of initial franchise license fees and area development exclusivity fees are from international locations. Initial franchise license fees are billed at the store opening date. Area development exclusivity fees are billed upon execution of the development agreements which grant the right to develop franchised restaurants in future periods in specific geographic areas. Area development exclusivity fees are included in Deferred revenue in the Consolidated Balance Sheets and allocated on a pro rata basis to all stores opened under that specific development agreement. The pre-opening services provided to franchisees do not contain separate and distinct performance obligations from the franchise right; thus, the fees collected will be amortized on a straight-line basis beginning at the store opening date through the term of the franchise agreement, which is typically
The Company offers various incentive programs for franchisees including royalty incentives, new restaurant opening incentives (i.e. development incentives) and other support initiatives. Royalties and franchise fees sales are reduced to reflect any royalty incentives earned or granted under these programs that are in the form of discounts.
Commissary Revenues
Commissary revenues are comprised of food and supplies sold to franchised restaurants and are recognized as revenue upon shipment of the related products to the franchisees. Payments are generally due within 30 days.
As noted above, there are various incentive programs available to franchisees related to new restaurant openings including discounts on initial commissary orders and new store equipment incentives, at substantially no cost to franchisees. Commissary revenues are reduced to reflect incentives in the form of direct discounts on initial commissary orders. The new store equipment incentive is also recorded as a reduction of commissary sales over the term of the incentive agreement, which is generally to
Other Revenues
Franchise Marketing Fund revenues represent a required established percentage of monthly restaurant sales collected by Papa John’s Marketing Fund, Inc. (“PJMF”), which is our national marketing fund, and various other international and domestic marketing funds (“Co-op” or “Co-operative” Funds) where we have determined for purposes of accounting that we have control over the significant activities of the funds. PJMF funds its operations with ongoing financial support and contributions from domestic Papa John’s restaurants, of which approximately
56
Consolidated Statements of Operations. Our obligation related to these funds is to develop and conduct advertising activities in a specific country, region, or market, including the placement of electronic and print materials.
There are no expiration dates and we do not deduct non-usage fees from outstanding gift cards. While the Company and the franchisees continue to honor all gift cards presented for payment, the likelihood of redemption may be determined to be remote for certain cards due to long periods of inactivity. In these circumstances, the Company recognizes breakage revenue for amounts not subject to unclaimed property laws. Based upon our analysis of historical gift card redemption patterns, we can reasonably estimate the amount of gift cards for which redemption is remote. Breakage revenue is recognized over time in proportion to estimated redemption patterns as Other revenues. Commissions on gift cards sold by third parties are recorded as a reduction to Deferred revenue and a reduction to Other revenues based upon estimated redemption patterns.
Fees for information services, including software maintenance fees, help desk fees, centralized call center fees, and online ordering fees are recognized as revenue as such services are provided and are included in Other revenues.
Revenues for printing, promotional items, and direct mail marketing services are recognized upon shipment of the related products to franchisees and other customers. Direct mail advertising discounts are also periodically offered by our Preferred Marketing Solutions subsidiary. Other revenues are reduced to reflect these advertising discounts.
Rental income, primarily derived from properties leased by the Company and subleased to franchisees in the United Kingdom, is recognized on a straight-line basis over the respective operating lease terms.
Advertising and Related Costs
Domestic Company-owned advertising and related costs of $
Leases
Lease expense is recognized on a straight-line basis over the expected life of the lease term for operating leases, whereas lease expense follows an accelerated expense recognition for finance leases. A lease term often includes option periods, available at the inception of the lease. Lease expense is comprised of operating and finance lease costs, short-term lease costs, and variable lease costs, which primarily include common area maintenance, real estate taxes, and insurance for the Company’s real estate leases. Lease costs also include variable rent, which is primarily related to the Company’s supply chain tractor and trailer leases that are based on a rate per mile.
Stock-Based Compensation
Compensation expense for equity grants is estimated on the grant date, net of projected forfeitures, and is recognized over the vesting period (graded vesting over
57
Cash Equivalents
Cash equivalents consist of highly liquid investments with maturity of three months or less at date of purchase. These investments are carried at cost, which approximates fair value.
Accounts Receivable
Substantially all accounts receivable is due from franchisees for purchases of food, paper products, point of sale equipment, printing and promotional items, information systems and related services, marketing and royalties. Credit is extended based on an evaluation of the franchisee’s financial condition and collateral is generally not required. An allowance for credit losses is an estimate, even if remote, based upon historical account write-off trends, facts about the current financial condition of the debtor, forecasts of future operating results based upon current trends of select operating metrics and macroeconomic factors. Account balances are charged off against the allowance after recovery efforts have ceased.
Notes Receivable
The Company has provided financing to select domestic and international franchisees principally for use in the construction and development of their restaurants and for the purchase of restaurants from the Company or other franchisees. Most notes receivable bear interest at fixed or floating rates and are generally secured by the assets of each restaurant and the ownership interests in the franchise. The Company has provided long-term financing to certain franchisees with royalty payment plans. We establish an allowance for credit losses for franchisee notes receivables to reduce the outstanding notes receivable to their net realizable values based on a review of each franchisee’s economic performance and market conditions after consideration of the fair value of our underlying collateral rights (e.g., underlying franchisee business, property and equipment) and any guarantees. Note balances are charged off against the allowance after recovery efforts have ceased.
Interest income recorded on franchisee loans was approximately $
Inventories
Inventories, which consist of food products, paper goods and supplies, smallwares, and printing and promotional items, are stated at the lower of cost, determined under the first-in, first-out (FIFO) method, or net realizable value.
Property and Equipment
Property and equipment are stated at cost. Depreciation is recorded using the straight-line method over the estimated useful lives of the assets (generally to
Depreciation expense was $
Deferred Costs
We capitalize certain information systems development and related costs that meet established criteria. Amounts capitalized, which are included in property and equipment, are amortized principally over periods not exceeding
58
Intangible Assets — Goodwill
We evaluate goodwill annually in the fourth quarter or whenever we identify certain triggering events or circumstances that would more-likely-than-not reduce the fair value of a reporting unit below its carrying amount. Such tests are completed separately with respect to the goodwill of each of our reporting units, which includes our domestic Company-owned restaurants, United Kingdom (“PJUK”), China, and Preferred Marketing Solutions operations. We may perform a qualitative assessment or move directly to the quantitative assessment for any reporting unit in any period if we believe that it is more efficient or if impairment indicators exist.
We elected to perform a qualitative assessment for all reporting units in the fourth quarter of 2021. As a result of our qualitative analyses, we determined that it was more-likely-than-not that the fair values of our reporting units were greater than their carrying amounts. Subsequent to completing our goodwill impairment tests, no indicators of impairment were identified. See Note 11 for additional information.
Deferred Income Tax Accounts and Tax Reserves
We are subject to income taxes in the United States and several foreign jurisdictions. Significant judgment is required in determining the provision for income taxes and the related assets and liabilities. The provision for income taxes includes income taxes paid, currently payable or receivable and those deferred.
Deferred tax assets and liabilities are determined based on differences between financial reporting and tax basis of assets and liabilities and are measured using enacted tax rates and laws that are expected to be in effect when the differences reverse. Deferred tax assets are also recognized for the estimated future effects of tax attribute carryforwards (e.g., net operating losses, capital losses, and foreign tax credits). The effect on deferred taxes of changes in tax rates is recognized in the period in which the new tax rate is enacted. Valuation allowances are established when necessary on a jurisdictional basis to reduce deferred tax assets to the amounts we expect to realize.
Tax authorities periodically audit the Company. We record reserves and related interest and penalties for identified exposures as income tax expense. We evaluate these issues and adjust for events, such as statute of limitations expirations, court rulings or audit settlements, which may impact our ultimate payment for such exposures. See Note 17 for additional information.
Insurance Reserves
Our insurance programs for workers’ compensation, owned and non-owned automobiles, general liability and property insurance coverage provided to our employees are funded by the Company up to certain retention limits which range up to $
Losses are accrued based upon undiscounted estimates of the liability for claims incurred and for events that have occurred but have not been reported using certain third-party actuarial projections and our claims loss experience. The determination of the recorded insurance reserves is highly judgmental and complex due to the significant uncertainty in the potential value of reported claims and the number and potential value of incurred but not reported claims, the application of significant judgment in making those estimates and the use of various actuarial valuation methods. The estimated insurance claims losses could be significantly affected should the frequency or ultimate cost of claims differ significantly from historical trends used to estimate the insurance reserves recorded by the Company. The Company records estimated losses above retention within its reserve with a corresponding receivable for expected amounts due from insurance carriers.
As of December 26, 2021, our insurance reserve was $
59
Derivative Financial Instruments
We recognize all derivatives on the balance sheet at fair value. At inception and on an ongoing basis, we assess whether each derivative that qualifies for hedge accounting continues to be highly effective in offsetting changes in the cash flows of the hedged item. If the derivative meets the hedge criteria as defined by certain accounting standards, depending on the nature of the hedge, changes in the fair value of the derivative are either offset against the change in fair value of assets, liabilities or firm commitments through earnings or recognized in accumulated other comprehensive income/(loss) until the hedged item is recognized in earnings. During 2021, our interest rate swaps were de-designated as cash flow hedges following the issuance of our
We recognized income (loss) of $
Noncontrolling Interests
At December 26, 2021, the Company had
The following summarizes the redemption feature, location and related accounting within the Consolidated Balance Sheets for these
|
|
|||
Type of Joint Venture Arrangement |
|
Location within the Consolidated Balance Sheets |
|
Recorded Value |
Joint ventures with no redemption feature |
|
Permanent equity |
|
Carrying value |
Joint ventures with option to require the Company to purchase the noncontrolling interest - not currently redeemable or redemption not probable |
|
Temporary equity |
|
Carrying value |
See Note 9 for additional information regarding noncontrolling interests.
Foreign Currency Translation
The local currency is the functional currency for each of our foreign subsidiaries. Revenues and expenses are translated into U.S. dollars using monthly average exchange rates, while assets and liabilities are translated using year-end exchange rates and historical rates. The resulting translation adjustments are included as a component of accumulated other comprehensive loss, net of income taxes.
60
Recent Accounting Pronouncements
Reference Rate Reform – Hedging
In March 2020, the FASB issued ASU 2020-04, “Facilitation of the Effects of Reference Rate Reform on Financial Reporting.” The ASU provides optional expedients and exceptions for applying guidance on contract modifications and hedge accounting related to the expected market transition from LIBOR and other interbank offered rates to alternative reference rates if certain criteria are met. This guidance was effective beginning on March 12, 2020, and the Company may elect to apply the amendments prospectively through December 31, 2022. The hedge accounting expedients may be applied, on an individual hedging relationship basis, to eligible hedge accounting relationships that existed as of the beginning of the effective date of this guidance, and to new eligible hedging relationships entered into after the effective date of this guidance; however, those expedients generally cannot be applied to hedging relationships for periods after December 31, 2022. The Company adopted certain optional hedge accounting expedients provided by ASU 2020-04 during fiscal 2020. The adoption of this guidance did not have a material impact on the Company’s consolidated financial position, results of operations, or cash flows.
61
3. Leases
The Company has significant leases that include most domestic Company-owned restaurant and commissary locations. Other domestic leases include tractor and trailer leases used by our distribution subsidiary as well as commissary equipment. Additionally, the Company leases a significant number of restaurants within the United Kingdom; these restaurants are then subleased to the franchisees. The Company’s leases have terms as follows:
Average lease term |
|
Domestic Company-owned restaurants |
|
United Kingdom franchise-owned restaurants |
|
Domestic commissary locations |
|
Domestic and international tractors and trailers |
to |
Domestic and international commissary and office equipment |
to |
The Company determines if an arrangement is or contains a lease at contract inception and recognizes a right-of-use asset and a lease liability at the lease commencement date. Leases with an initial term of 12 months or less but greater than one month are not recorded on the balance sheet for select asset classes. The lease liability is measured at the present value of future lease payments as of the lease commencement date. The right-of-use asset recognized is based on the lease liability adjusted for prepaid and deferred rent and unamortized lease incentives. An operating lease right-of-use asset is amortized on a straight-line basis over the lease term and is recognized as a single lease cost against the operating lease liability. A finance lease right-of-use asset is amortized on a straight-line basis, with interest costs reported separately, over the lesser of the useful life of the leased asset or lease term. Operating lease expense is recognized on a straight-line basis over the lease term and is included in Operating costs or General and administrative expenses. Variable lease payments are expensed as incurred.
The Company uses its incremental borrowing rates as the discount rate for its leases, which is equal to the rate of interest the Company would have to pay on a collateralized basis to borrow an amount equal to the lease payments under similar terms. The lease terms for all the Company’s leases include the contractually obligated period of the leases, plus any additional periods covered by Company options to extend the leases that the Company is reasonably certain to exercise.
Certain leases provide that the lease payments may be increased annually based on the fixed rate terms or adjustable terms such as the Consumer Price Index. Future base rent escalations that are not contractually quantifiable as of the lease commencement date are not included in our lease liability.
The following schedule details the total right-of-use assets and lease liabilities on the Consolidated Balance Sheets as of December 26, 2021 and December 27, 2020 (in thousands):
December 26, |
December 27, |
|||||||
Leases |
Classification |
2021 |
2020 |
|||||
Assets |
||||||||
Finance lease assets, net |
Finance lease right-of-use assets, net |
$ |
|
$ |
|
|||
Operating lease assets, net |
Operating lease right-of-use assets |
|
|
|||||
Total lease assets |
$ |
|
$ |
|
||||
Liabilities |
||||||||
Current finance lease liabilities |
Current finance lease liabilities |
$ |
|
$ |
|
|||
Current operating lease liabilities |
Current operating lease liabilities |
|
|
|||||
Noncurrent finance lease liabilities |
Long-term finance lease liabilities |
|
|
|||||
Noncurrent operating lease liabilities |
Long-term operating lease liabilities |
|
|
|||||
Total lease liabilities |
$ |
|
$ |
|
62
Lease expense for lease payments is recognized on a straight-line basis over the lease term. Lease expense is comprised of operating and finance lease costs, short-term lease costs, and variable lease costs, which primarily include common area maintenance, real estate taxes, and insurance for the Company’s real estate leases. Lease costs also include variable rent, which is primarily related to the Company’s supply chain tractor and trailer leases that are based on a rate per mile. Lease expense for the years ended December 26, 2021 and December 27, 2020 are as follows:
Year Ended |
Year Ended |
|||||
(in thousands) |
December 26, 2021 |
December 27, 2020 |
||||
Finance lease: |
||||||
Amortization of right-of-use assets |
$ |
|
$ |
|
||
Interest on lease liabilities |
|
|
||||
Operating lease: |
||||||
Operating lease cost |
|
|
||||
Short-term lease cost |
|
|
||||
Variable lease cost |
|
|
||||
Total lease costs |
$ |
|
$ |
|
||
Sublease income |
( |
( |
||||
Total lease costs, net of sublease income |
$ |
|
$ |
|
Future minimum lease payments under contractually-obligated leases and associated sublease income as of December 26, 2021 are as follows (in thousands):
Fiscal Year |
Finance |
Operating |
Expected |
||||||
2022 |
$ |
|
$ |
|
$ |
|
|||
2023 |
|
|
|
||||||
2024 |
|
|
|
||||||
2025 |
|
|
|
||||||
2026 |
|
|
|
||||||
Thereafter |
|
|
|
||||||
Total future minimum lease payments |
$ |
|
$ |
|
$ |
|
|||
Less imputed interest |
( |
( |
— |
||||||
Total present value of lease liabilities |
$ |
|
$ |
|
$ |
|
|||
Lessor Operating Leases
We sublease certain retail space to our franchisees in the United Kingdom which are primarily operating leases. At December 26, 2021, we leased and subleased approximately
63
Lease Guarantees
As a result of assigning our interest in obligations under property leases as a condition of the refranchising of certain restaurants, we are contingently liable for payment of approximately
There were no leases recorded between related parties.
Supplemental Cash Flow & Other Information
Supplemental cash flow information related to leases for the years ended December 26, 2021 and December 27, 2020 are as follows:
Year Ended |
|||||||||
(in thousands) |
December 26, 2021 |
December 27, 2020 |
December 29, 2019 |
||||||
Cash paid for amounts included in the measurement of lease liabilities: |
|||||||||
Operating cash flows from finance leases |
$ |
|
$ |
|
$ |
|
|||
Financing cash flows from finance leases |
|
|
|
||||||
Operating cash flows from operating leases (a) |
|
|
|
||||||
Right-of-use assets obtained in exchange for new finance lease liabilities |
|
|
|
||||||
Right-of-use assets obtained in exchange for new operating lease liabilities (b) |
|
|
|
||||||
Cash received from sublease income |
|
|
|
||||||
Weighted-average remaining lease term (in years): |
|||||||||
Finance leases |
|||||||||
Operating leases |
|||||||||
Weighted-average discount rate: |
|||||||||
Finance leases |
|||||||||
Operating leases |
|||||||||
(a) Included within the change in Other assets and liabilities within the Consolidated Statements of Cash Flows offset by non-cash operating lease right-of-use asset amortization and lease liability accretion. | |||||||||
(b) Includes right-of-use assets of approximately $ | |||||||||
64
4. Papa John’s Marketing Fund, Inc.
PJMF, which is a consolidated variable interest entity where the Company has been identified as the primary beneficiary, collects a percentage of revenues from Company-owned and franchised restaurants in the United States, for the purpose of designing and administering advertising and promotional programs for all participating domestic restaurants. Contributions and expenditures are reported on a gross basis in the Consolidated Statements of Operations within Other revenues and Other expenses. PJMF also has a wholly-owned subsidiary, Papa Card, Inc., which administers the Company’s gift card programs.
Assets and liabilities of PJMF, which are utilized solely for the Company’s advertising and promotional programs, were as follows in the Consolidated Balance Sheets (in thousands):
December 26, |
December 27, |
|||||
2021 |
2020 |
|||||
Assets |
||||||
Current assets: |
||||||
Cash and cash equivalents |
$ |
|
$ |
|
||
Accounts receivable, net |
|
|
||||
Income tax receivable |
|
|
||||
Prepaid expenses and other current assets |
|
|
||||
Total current assets |
|
|
||||
Deferred income taxes |
|
|
||||
Total assets |
$ |
|
$ |
|
||
Liabilities |
||||||
Current liabilities: |
||||||
Accounts payable |
$ |
|
$ |
|
||
Income and other taxes payable |
|
|
||||
Accrued expenses and other current liabilities |
|
|
||||
Current deferred revenue |
|
|
||||
Total current liabilities |
|
|
||||
Deferred revenue |
|
|
||||
Total liabilities |
$ |
|
$ |
|
||
5. Revenue Recognition
Contract Balances
Our contract liabilities primarily relate to franchise fees, unredeemed gift card liabilities, and loyalty program obligations, which we classify as Deferred revenue on the Consolidated Balance Sheets. During the years ended December 26, 2021 and December 27, 2020, the Company recognized $
The following table includes a breakout of contract liability balances (in thousands):
|
Contract Liabilities |
||||||||
|
December 26, 2021 |
December 27, 2020 |
Change |
||||||
Franchise fees and unredeemed gift card liabilities |
$ |
|
$ |
|
$ |
|
|||
Customer loyalty program obligations |
|
|
|
||||||
Total contract liabilities |
$ |
|
$ |
|
$ |
|
|||
Our contract assets consist primarily of equipment incentives provided to franchisees. Equipment incentives are related to the future value of commissary revenue the Company will receive over the term of the incentive agreement. As of
65
December 26, 2021 and December 27, 2020, the contract assets were approximately $
Transaction Price Allocated to the Remaining Performance Obligations
The following table (in thousands) includes estimated revenue expected to be recognized in the future related to performance obligations that are unsatisfied at the end of the reporting period.
Performance Obligations by Period |
|||||||||||||||||||||
Less than 1 Year |
1-2 Years |
2-3 Years |
3-4 Years |
4-5 Years |
Thereafter |
Total |
|||||||||||||||
Franchise fees |
$ |
|
$ |
|
$ |
|
$ |
|
$ |
|
$ |
|
$ |
|
|||||||
Approximately $
The Company applies the practical expedient in ASC 606-10-50-14 and does not disclose information about remaining performance obligations that have original expected durations of one year or less.
6. |
Stockholders’ Deficit |
Shares Authorized and Outstanding
The Company has authorized
On May 11, 2021, the Company entered into a Share Repurchase Agreement with certain funds affiliated with, or managed by, Starboard Value LP (collectively, “Starboard”), pursuant to which (i) the Company repurchased from Starboard
On August 3, 2021, the Company filed a Certificate of Elimination (the “Certificate of Elimination”) with the Secretary of State of the State of Delaware to eliminate the Series B Preferred Stock. Effective upon filing, the Certificate of Elimination eliminated from the Company’s Amended and Restated Certificate of Incorporation all matters set forth in the Certificate of Designation with respect to the Series B Preferred Stock. The shares that were designated to such series were returned to the status of authorized but unissued shares of preferred stock, par value $
66
Stock authorized and outstanding, respectively, at December 27, 2020. The Series B Preferred Stock was classified as temporary equity on the Consolidated Balance Sheet as of December 27, 2020.
The following table summarizes changes to our Series B Preferred Stock (in thousands):
Balance at December 29, 2019 |
$ |
|
|
Tax deduction on issuance costs |
|
||
Accretion |
|
||
Balance at December 27, 2020 |
$ |
|
|
Accretion |
|
||
Redemption |
( |
||
Balance at December 26, 2021 |
$ |
|
Share Repurchase Program
On October 28, 2021, our Board of Directors approved a share repurchase program with an indefinite duration for up to $
The following table summarizes our repurchase activity for the years ended December 26, 2021 and December 27, 2020, respectively (none in 2019):
Maximum Dollar |
|||||||||||
Total |
Average |
Aggregate |
Value of Shares |
||||||||
Number |
Price |
Cost of |
that May Yet Be |
||||||||
(in thousands, except average price per share) |
of Shares |
Paid per |
Shares |
Purchased Under the |
|||||||
Year Ended |
Purchased |
|
Share |
Purchased |
Plans or Programs |
||||||
December 26, 2021 |
$ |
$ |
|
$ |
|
||||||
December 27, 2020 |
$ |
$ |
|
$ |
|
Subsequent to year-end, we acquired an additional
The timing and volume of share repurchases under the Company’s share repurchase programs may be executed at the discretion of management on an opportunistic basis, subject to market and business conditions, regulatory requirements and other factors, or pursuant to trading plans or other arrangements. Repurchases under the programs may be made through open market, block, and privately negotiated transactions, including Rule 10b5-1 plans, at times and in such amounts as management deems appropriate. Repurchases under the Company’s share repurchase programs may be commenced or suspended from time to time at the Company’s discretion without prior notice. Funding for the share repurchase programs will be provided through our credit facility, operating cash flow, stock option exercises and cash and cash equivalents.
Dividends
The Company recorded dividends of approximately $
| ● |
$ |
| ● |
$ |
| ● |
$ |
| ● |
$ |
67
The Company paid aggregate common stock dividends of $
On
68
7. Earnings (Loss) per Share
We compute earnings (loss) per share using the two-class method. The two-class method requires an earnings allocation formula that determines earnings (loss) per share for common shareholders and participating security holders according to dividends declared and participating rights in undistributed earnings. The shares of Series B Preferred Stock, which were repurchased by the Company or converted into shares of common stock during the second quarter of 2021, and time-based restricted stock awards are participating securities because holders of such shares have non-forfeitable dividend rights and participate in undistributed earnings with common stock. Under the two-class method, total dividends provided to the holders of participating securities and undistributed earnings allocated to participating securities, are subtracted from net income attributable to the Company in determining net income (loss) attributable to common shareholders. Additionally, any accretion to the redemption value for the Series B Preferred Stock or cash payments in excess of their respective carrying values upon redemption was treated as a deemed dividend in the two-class earnings per share calculation.
Basic earnings (loss) per common share are computed by dividing net income (loss) attributable to common shareholders by the weighted-average common shares outstanding. Diluted earnings (loss) per common share are computed by dividing the net income (loss) attributable to common shareholders by the diluted weighted average common shares outstanding. Diluted weighted average common shares outstanding consist of basic weighted average common shares outstanding plus weighted average awards outstanding under our equity compensation plans, which are dilutive securities.
The calculations of basic earnings (loss) per common share and diluted earnings (loss) per common share for the years ended December 26, 2021, December 27, 2020 and December 29, 2019 are as follows (in thousands, except per share data):
2021 |
2020 |
|
2019 |
||||||
Basic earnings (loss) per common share |
|||||||||
Net income attributable to the Company |
$ |
|
$ |
|
$ |
|
|||
Dividends on redemption of Series B Convertible Preferred Stock |
( |
— |
— |
||||||
Dividends paid to participating securities |
( |
( |
( |
||||||
Net income attributable to participating securities |
|
— |
|
( |
|
— |
|||
Net income (loss) attributable to common shareholders |
$ |
|
$ |
|
$ |
( |
|||
Basic weighted average common shares outstanding |
|
|
|
|
|
|
|||
Basic earnings (loss) per common share |
$ |
|
$ |
|
$ |
( |
|||
Diluted earnings (loss) per common share |
|||||||||
Net income (loss) attributable to common shareholders |
$ |
|
$ |
|
$ |
( |
|||
Weighted average common shares outstanding |
|
|
|
|
|
|
|||
Dilutive effect of outstanding equity awards (a) |
|
|
|
|
|
— |
|||
Diluted weighted average common shares outstanding (b) |
|
|
|
|
|
|
|||
Diluted earnings (loss) per common share |
$ |
|
$ |
|
$ |
( |
|||
| (a) |
Shares subject to options to purchase common stock with an exercise price greater than the average market price for the year were not included in the computation of diluted earnings per common share because the effect would have been antidilutive. The weighted average number of shares subject to antidilutive options was |
| (b) |
The Company had |
See Note 20 for additional information regarding our equity awards, including restricted stock.
69
8. Fair Value Measurements and Disclosures
The Company determines the fair value of financial assets and liabilities based on the price that would be received to sell the asset or paid to transfer the liability to a market participant. Certain assets and liabilities are measured at fair value on a recurring basis and are required to be classified and disclosed in one of the following three categories:
| ● | Level 1: Quoted market prices in active markets for identical assets or liabilities. |
| ● | Level 2: Observable market-based inputs or unobservable inputs that are corroborated by market data. |
| ● | Level 3: Unobservable inputs that are not corroborated by market data. |
Fair value is a market-based measurement, not an entity specific measurement. Considerable judgment is required to interpret market data to estimate fair value; accordingly, the fair values presented do not necessarily indicate what the Company or its debtholders could realize in a current market exchange.
Our financial assets and liabilities that were measured at fair value on a recurring basis as of December 26, 2021 and December 27, 2020 are as follows:
Carrying |
Fair Value Measurements |
|
|||||||||||
(in thousands) |
|
Value |
|
Level 1 |
|
Level 2 |
|
Level 3 |
|
||||
December 26, 2021 |
|||||||||||||
Financial assets: |
|||||||||||||
Cash surrender value of life insurance policies (a) |
$ |
|
$ |
|
$ |
— |
$ |
— |
|||||
Financial liabilities: |
|||||||||||||
Interest rate swaps (b) |
$ |
|
$ |
— |
$ |
|
$ |
— |
|||||
December 27, 2020 |
|||||||||||||
Financial assets: |
|||||||||||||
Cash surrender value of life insurance policies (a) |
$ |
|
$ |
|
$ |
— |
$ |
— |
|||||
Financial liabilities: |
|||||||||||||
Interest rate swaps (b) |
$ |
|
$ |
— |
$ |
|
$ |
— |
|||||
| (a) | Represents life insurance policies held in our non-qualified deferred compensation plan. |
| (b) | The fair value of our interest rate swaps is based on the sum of all future net present value cash flows. The future cash flows are derived based on the terms of our interest rate swaps, as well as considering published discount factors, and projected London Interbank Offered Rates (“LIBOR”). |
There were
The fair value of certain assets and liabilities approximates carrying value because of the short-term nature of the accounts, including cash and cash equivalents, accounts receivable, net of allowances, and accounts payable. The carrying value of notes receivable, net of allowances, also approximates fair value. The Company’s revolving credit facilities and term debt under the Company’s credit agreement approximate carrying value due to their variable market-based interest rate. The Company’s
December 26, 2021 |
||||||
Carrying |
Fair |
|||||
(in thousands) |
Value |
Value |
||||
$ |
|
$ |
|
|||
70
9. Noncontrolling Interests
Papa John’s has
|
2021 |
|
2020 |
|
2019 |
||||
Papa John’s International, Inc. |
$ |
|
$ |
|
$ |
|
|||
Noncontrolling interests |
|
|
|
|
|
|
|||
Total net income |
$ |
|
$ |
|
$ |
|
|||
As of December 26, 2021, the noncontrolling interest holder of
The following summarizes changes in our redeemable noncontrolling interests in 2021 and 2020 (in thousands):
Balance at December 29, 2019 |
|
$ |
|
Net income |
|
|
|
Distributions |
( |
||
Balance at December 27, 2020 |
|
$ |
|
Net income |
|
||
Distributions |
|
( |
|
Balance at December 26, 2021 |
$ |
|
10. Allowance for Credit Losses
The Company adopted ASU 2016-13, “Financial Instruments – Credit Losses (Topic 326): Measurement of Credit Losses on Financial Instruments,” (“ASU 2016-13”) as of December 30, 2019 (the first day of fiscal 2020) under the modified retrospective transition method. Topic 326 requires measurement and recognition of expected versus incurred losses for financial assets held. Financial instruments subject to Topic 326 include trade accounts receivable, notes receivable and interest receivable (classified as Other assets in the Consolidated Balance Sheets) from franchisees. The impact of the adoption was not material to our consolidated financial statements.
Estimates of expected credit losses, even if remote, are based upon historical account write-off trends, facts about the current financial condition of the debtor, forecasts of future operating results based upon current trends of select operating metrics, and macroeconomic factors. Credit quality is monitored through the timing of payments compared to the prescribed payment terms and known facts regarding the financial condition of the franchisee or customer. Account and note balances are charged off against the allowance after recovery efforts have ceased.
71
The following table summarizes changes in our allowances for credit losses for accounts receivable, notes receivable and interest receivable:
(in thousands) |
Accounts Receivable |
Notes Receivable |
Interest Receivable |
||||||
Balance at December 29, 2019 |
$ |
|
$ |
|
$ |
|
|||
Cumulative effect of adoption of ASU 2016-13 |
|
|
— |
||||||
Balance at December 30, 2019 |
$ |
|
$ |
|
$ |
|
|||
Current period (benefit) provision for expected credit losses |
( |
( |
|
||||||
Write-offs charged against the allowance |
( |
( |
— |
||||||
Recoveries collected |
— |
( |
— |
||||||
Transfers |
— |
|
( |
||||||
Balance at December 27, 2020 |
$ |
|
$ |
|
$ |
— |
|||
Current period (benefit) provision for expected credit losses |
|
( |
— |
||||||
Write-offs charged against the allowance |
( |
( |
— |
||||||
Recoveries collected |
— |
( |
— |
||||||
Balance at December 26, 2021 |
$ |
|
$ |
|
$ |
— |
|||
11. Goodwill
The following summarizes changes in the Company’s goodwill, by reportable segment (in thousands):
Domestic Company- owned Restaurants |
International (a) |
All Others |
Total |
|||||||||
Balance as of December 29, 2019 |
$ |
|
$ |
|
$ |
|
$ |
|
||||
Foreign currency adjustments |
|
— |
|
|
|
— |
|
|
||||
Balance as of December 27, 2020 |
$ |
|
$ |
|
$ |
|
$ |
|
||||
Foreign currency adjustments |
|
— |
|
( |
— |
|
( |
|||||
Balance as of December 26, 2021 |
$ |
|
$ |
|
$ |
|
$ |
|
||||
| (a) |
The international goodwill balances for all years presented are net of accumulated impairment of $ |
72
12. Debt
Long-term debt, net consists of the following (in thousands):
December 26, |
December 27, |
||||||
2021 |
2020 |
||||||
Senior notes |
$ |
|
$ |
— |
|||
Revolving facilities |
|
|
|||||
Term loan facility |
— |
|
|||||
Outstanding debt |
$ |
|
$ |
|
|||
Unamortized debt issuance costs |
( |
( |
|||||
Current portion of long-term debt |
— |
( |
|||||
Total long-term debt, net |
$ |
|
$ |
|
Senior Notes
On September 14, 2021, the Company issued $
The net proceeds from the Notes, together with borrowings under the Amended Credit Agreement (as defined below), were used to repay outstanding revolver and term loan borrowings under the Company’s Previous Credit Agreement (as defined below).
The Company may redeem the Notes, in whole or in part, at any time on or after September 15, 2024 at established redemption prices ranging from
The Indenture governing the Notes contains customary events of default, including, among other things, payment default, failure to comply with covenants or agreements contained in the Indenture or the Notes and certain provisions related to bankruptcy events. The Indenture also contains customary negative covenants.
Amended Credit Agreement
Concurrently with the issuance of the Notes, the Company entered into an amended and restated credit agreement (the “Amended Credit Agreement”) replacing the previous credit agreement (“Previous Credit Agreement”). The Amended Credit Agreement provides for a senior secured revolving credit facility in an aggregate available principal amount of $
73
Up to $
Loans under the PJI Revolving Facility accrue interest at a per annum rate equal to, at the Company’s election, either a LIBOR rate plus a margin ranging from
The Amended Credit Agreement contains customary affirmative and negative covenants that, among other things, require customary reporting obligations, and restrict, subject to certain exceptions, the incurrence of additional indebtedness and liens, the consummation of certain mergers, consolidations, sales of assets and similar transactions, the making of investments, equity distributions and other restricted payments, and transactions with affiliates. In addition, the Company will be subject to the following financial covenants: (1) a maximum Leverage Ratio of
Obligations under the Amended Credit Agreement are guaranteed by certain direct and indirect material domestic subsidiaries of the Company (the “Guarantors”) and are secured by a security interest in substantially all of the capital stock and equity interests of the Company’s and the Guarantors’ domestic and first tier material foreign subsidiaries. The Amended Credit Agreement contains customary events of default including, among other things, payment defaults, breach of covenants, cross acceleration to material indebtedness, bankruptcy-related defaults, judgment defaults, and the occurrence of certain change of control events. The occurrence of an event of default may result in the termination of the PJI Revolving Facility, acceleration of repayment obligations and the exercise of remedies by the Lenders with respect to the subsidiary guarantors.
PJMF Revolving Facility
PJMF has a $
74
Derivative Financial Instruments
As of December 26, 2021, we have the following interest rate swap agreements with a total notional value of $
Effective Dates |
|
Floating Rate Debt |
|
Fixed Rates |
|
||
April 30, 2018 through April 30, 2023 |
$ |
|
million |
|
% |
||
April 30, 2018 through April 30, 2023 |
$ |
|
million |
|
% |
||
April 30, 2018 through April 30, 2023 |
$ |
|
million |
|
% |
||
January 30, 2018 through August 30, 2022 |
$ |
million |
|
% |
|||
January 30, 2018 through August 30, 2022 |
$ |
|
million |
|
% |
||
January 30, 2018 through August 30, 2022 |
$ |
|
million |
|
% |
||
Our interest rate swaps were de-designated as cash flow hedges during 2021 following the issuance of the Notes. For these de-designated hedges, the portion of gains or losses on the derivative instruments previously recognized in accumulated other comprehensive loss (“AOCL”) will be reclassified into earnings as adjustments to interest expense on a straight-line basis over the remaining life of the originally hedged transactions.
The following table provides information on the location and amounts of our swaps in the accompanying Consolidated Financial Statements (in thousands):
Interest Rate Swap Derivatives |
||||||
Fair Value |
Fair Value |
|||||
December 26, |
December 27, |
|||||
Balance Sheet Location |
2021 |
2020 |
||||
Other current and long-term liabilities |
$ |
|
$ |
|
||
As of December 26, 2021, the portion of the aggregate $
The effect of derivative instruments on the accompanying Consolidated Financial Statements is as follows (in thousands):
Location of (Loss) |
Amount of (Loss) |
|||||||||||
Derivatives - |
Amount of Gain or |
or Gain |
or Gain |
Total Interest Expense |
||||||||
Cash Flow |
(Loss) Recognized |
Reclassified from |
Reclassified from |
on Consolidated |
||||||||
Hedging |
in AOCL |
AOCL into |
AOCL into |
Statements of |
||||||||
Relationships |
on Derivative |
Income |
Income |
Operations |
||||||||
Interest rate swaps: |
||||||||||||
2021 |
$ |
|
Interest expense |
$ |
( |
$ |
( |
|||||
2020 |
$ |
( |
Interest expense |
$ |
( |
$ |
( |
|||||
2019 |
$ |
( |
Interest expense |
$ |
|
$ |
( |
|||||
Interest paid, including payments made or received under the swaps, was $
75
13. Property and Equipment, Net
Property and equipment, net consists of the following (in thousands):
|
December 26, |
|
December 27, |
|||
2021 |
|
2020 |
||||
Land |
$ |
|
$ |
|
||
Buildings and improvements |
|
|
|
|
||
Leasehold improvements |
|
|
|
|
||
Equipment and other |
|
|
|
|
||
Construction in progress |
|
|
|
|
||
Total property and equipment |
|
|
|
|
||
Accumulated depreciation and amortization |
|
( |
|
( |
||
Property and equipment, net |
$ |
|
$ |
|
||
14. Accrued Expenses and Other Current Liabilities
Accrued expenses and other current liabilities consist of the following (in thousands):
|
December 26, |
|
December 27, |
|||
2021 |
2020 |
|||||
Marketing |
$ |
|
$ |
|
||
Salaries, benefits and bonuses |
|
|
|
|
||
Insurance reserves, current |
|
|
||||
Purchases |
|
|
|
|
||
Other |
|
|
|
|
||
Total |
$ |
|
$ |
|
||
15. Other Long-term Liabilities
Other long-term liabilities consist of the following (in thousands):
|
|
|||||
December 26, |
|
December 27, |
||||
2021 |
2020 |
|||||
Insurance reserves |
$ |
|
$ |
|
||
Deferred compensation plan |
|
|
|
|
||
Employer payroll taxes (1) |
— |
|
||||
Other |
|
|
|
|
||
Total |
$ |
|
$ |
|
||
| (1) |
Represents deferred employer payroll taxes under the Coronavirus Aid, Relief, and Economic Security Act. Approximately half of the deferral was paid in 2021, with the remaining $ |
76
16. Strategic Corporate Reorganization for Long-term Growth
On September 17, 2020, we announced plans to open an office in Atlanta, Georgia located in Three Ballpark Center at The Battery Atlanta, which opened in October 2021. The space is designed to drive continued menu innovation and optimize integration across marketing, communications, customer experience, operations, human resources, diversity, equity and inclusion, financial planning and analysis, investor relations and development functions. Our information technology, finance, supply chain, and legal teams continue to operate in our Louisville, Kentucky office, which remains critical to our success. We also maintain an office outside of London, United Kingdom, where our international operations are managed. Employees whose positions were relocated to the new Atlanta office were either offered an opportunity to continue with the organization or were offered a severance package. As a result, we incurred one-time corporate reorganization costs of approximately $
We record severance as a one-time termination benefit and recognize the expense ratably over the employees’ required future service period. All other costs, including employee transition costs, recruitment and relocation costs, and third-party costs, are recognized in the period incurred. All strategic corporate reorganization costs have been recorded in General and administrative expenses on the Consolidated Statement of Operations.
Strategic corporate reorganization costs recorded for the years ended December 26, 2021 and December 27, 2020, respectively, are as follows:
Year Ended |
Year Ended |
|||||
Dec. 26, |
Dec. 27, |
|||||
(in thousands) |
2021 |
2020 |
||||
Employee severance and other employee transition costs |
$ |
|
$ |
|
||
Recruiting and professional fees |
|
|
||||
Relocation costs |
|
|
||||
Other costs |
|
|
||||
Total strategic corporate reorganization costs |
$ |
|
$ |
|
||
Stock-based compensation forfeitures on unvested awards |
— |
( |
||||
Total strategic corporate reorganization costs, net of stock forfeitures |
$ |
|
$ |
|
||
As of December 26, 2021 and December 27, 2020, the estimate of unpaid strategic corporate reorganization costs are included in Accrued expenses and other current liabilities on the Consolidated Balance Sheets. The following tables summarizes the activity for the years ended December 26, 2021 and December 27, 2020, respectively:
Balance at |
Balance at |
|||||||||||
Dec. 27 |
Dec. 26, |
|||||||||||
(in thousands) |
2020 |
Charges |
Payments |
2021 |
||||||||
Employee severance and other employee transition costs |
$ |
|
$ |
|
$ |
( |
$ |
|
||||
Recruiting and professional fees |
|
|
( |
|
||||||||
Relocation costs |
|
|
( |
|
||||||||
Other costs |
— |
|
( |
— |
||||||||
Total strategic corporate reorganization liability |
$ |
|
$ |
|
$ |
( |
$ |
|
||||
Balance at |
Balance at |
|||||||||||
Dec. 29 |
Dec. 27 |
|||||||||||
(in thousands) |
2019 |
Charges |
Payments |
2020 |
||||||||
Employee severance and other employee transition costs |
$ |
— |
$ |
|
$ |
( |
$ |
|
||||
Recruiting and professional fees |
— |
|
( |
|
||||||||
Relocation costs |
— |
|
( |
|
||||||||
Other costs |
— |
|
( |
— |
||||||||
Total strategic corporate reorganization liability |
$ |
— |
$ |
|
$ |
( |
$ |
|
||||
77
17. Income Taxes
The following table presents the domestic and foreign components of income (loss) before income taxes for 2021, 2020 and 2019 (in thousands):
2021 |
|
2020 |
|
2019 |
|||||
Domestic income (loss) |
$ |
|
$ |
|
$ |
( |
|||
Foreign income |
|
|
|
||||||
Total income |
$ |
|
$ |
|
$ |
|
|||
Included within the foreign income before income taxes above is $
A summary of the expense (benefit) for income tax follows (in thousands):
|
2021 |
|
2020 |
|
2019 |
|
||||
Current: |
||||||||||
Federal |
$ |
|
$ |
|
$ |
( |
||||
Foreign |
|
|
|
|
|
|
||||
State and local |
|
|
|
|
|
|
||||
Deferred: |
||||||||||
Federal |
|
( |
( |
|||||||
Foreign |
|
|
( |
|||||||
State and local |
|
( |
( |
|||||||
Total income tax expense (benefit) |
$ |
|
$ |
|
$ |
( |
||||
The reconciliation of income tax computed at the U.S. federal statutory rate to income tax expense (benefit) for the years ended December 26, 2021, December 27, 2020 and December 29, 2019 is as follows in both dollars and as a percentage of income before income taxes ($ in thousands):
2021 |
2020 |
2019 |
||||||||||||||||
|
Income Tax |
Income |
Income Tax |
Income |
Income Tax |
Income |
||||||||||||
Expense |
Tax Rate |
Expense |
Tax Rate |
(Benefit) |
Tax Rate |
|||||||||||||
Tax at U.S. federal statutory rate |
$ |
|
|
% |
$ |
|
|
% |
$ |
|
|
|
% |
|||||
State and local income taxes |
|
|
|
% |
|
|
|
% |
|
|
|
|
% |
|||||
Foreign income taxes |
|
|
|
% |
|
|
|
% |
|
|
|
|
% |
|||||
Income of consolidated partnerships |
||||||||||||||||||
attributable to noncontrolling interests |
|
( |
( |
% |
|
( |
( |
% |
|
( |
|
( |
% |
|||||
Non-qualified deferred compensation plan |
||||||||||||||||||
(income) |
|
( |
( |
% |
|
( |
( |
% |
|
( |
|
( |
% |
|||||
Excess tax (benefits) on equity awards |
( |
( |
% |
( |
( |
% |
( |
( |
% |
|||||||||
Preferred stock option mark-to-market adjustment |
— |
— |
% |
— |
— |
% |
|
|
% |
|||||||||
Tax credits |
|
( |
( |
% |
|
( |
( |
% |
|
( |
|
( |
% |
|||||
Other |
( |
( |
% |
|
|
% |
( |
( |
% |
|||||||||
Total |
$ |
|
|
|
% |
$ |
|
|
|
% |
$ |
( |
|
( |
% |
|||
78
Significant deferred tax assets (liabilities) follow (in thousands):
|
December 26, |
|
December 27, |
|||
2021 |
|
2020 |
||||
Accrued liabilities |
$ |
|
$ |
|
||
Accrued bonuses |
|
|
|
|
||
Other liabilities and asset reserves |
|
|
|
|
||
Equity awards |
|
|
|
|
||
Lease liabilities |
|
|
||||
Other |
|
|
|
|
||
Net operating losses |
|
|
|
|
||
Foreign tax credit carryforwards |
|
|
||||
Total deferred tax assets |
|
|
||||
Valuation allowances |
|
( |
|
( |
||
Total deferred tax assets, net of valuation allowances |
$ |
|
$ |
|
||
Deferred expenses |
$ |
( |
$ |
( |
||
Accelerated depreciation |
|
( |
|
( |
||
Goodwill |
|
( |
|
( |
||
Right-of-use assets |
( |
( |
||||
Other |
|
( |
|
( |
||
Total deferred tax liabilities |
|
( |
|
( |
||
Net deferred tax assets |
$ |
|
$ |
|
||
The following table summarizes changes in the Company’s valuation allowance on deferred tax:
Balance as of December 29, 2019 |
$ |
|
|
Charged to costs and expenses |
|
||
Other |
|
||
Balance as of December 27, 2020 |
$ |
|
|
Charged to costs and expenses |
|
||
Other |
( |
||
Balance as of December 26, 2021 |
$ |
|
The Company had approximately $
The Company had approximately $
In addition, the Company had approximately $
79
Cash for income taxes paid (received) were $
The Company files income tax returns in the U.S. federal jurisdiction and various state and foreign jurisdictions. The Company, with few exceptions, is no longer subject to U.S. federal, state and local, or non-U.S. income tax examinations by tax authorities for years before 2017. The Company is currently undergoing examinations by various tax authorities. The Company anticipates that the finalization of these current examinations and other issues could result in a decrease in the liability for unrecognized tax benefits (and a decrease of income tax expense) of approximately $
The Company had $
Balance at December 29, 2019 |
|
$ |
|
Additions for tax positions of prior years |
|
|
|
Reductions for tax positions of prior years |
( |
||
Reductions for lapse of statute of limitations |
|
( |
|
Balance at December 27, 2020 |
$ |
|
|
Additions for tax positions of prior years |
|
||
Reductions for tax positions of prior years |
( |
||
Balance at December 26, 2021 |
$ |
|
The Company recognizes accrued interest and penalties related to unrecognized tax benefits as part of income tax expense. The Company has accrued approximately $
18. Related Party Transactions
On March 21, 2019, Shaquille O’Neal was appointed to our Board of Directors. On June 11, 2019, PJMF entered into an Endorsement Agreement (the “Endorsement Agreement”), effective March 15, 2019, with ABG-Shaq, LLC (“ABG-Shaq”), an entity affiliated with Mr. O’Neal, for the personal services of Mr. O’Neal. Pursuant to the Endorsement Agreement, the Company received the right and license to use Mr. O’Neal’s name, nickname, initials, autograph, voice, video or film portrayals, photograph, likeness and certain other intellectual property rights (individually and collectively, the “Personality Rights”), in each case, solely as approved by ABG-Shaq, in connection with the advertising, promotion and sale of Papa John’s-branded products. Mr. O’Neal also agreed to provide brand ambassador services related to appearances, social media and public relations matters, and to collaborate with us to develop one or more co-branded products using the Personality Rights. Mr. O’Neal and the Company developed a co-branded extra-large pizza product using the Personality Rights under an amendment to the Endorsement Agreement signed July 27, 2020 (the “First Amendment”).
As consideration for the rights and services granted under the Endorsement Agreement, the Company agreed to pay to ABG-Shaq aggregate cash payments of $
On July 29, 2021, the Company and PJFM entered into Amendment No. 2 (the “ Second Amendment”) to the Endorsement Agreement with ABG-Shaq. Pursuant to the Second Amendment, the Company was granted the ability to use the Personality Rights for a limited time to promote, advertise, and sell our co-branded extra-large pizza developed under the First Amendment. ABG-Shaq did not receive any additional royalty fees from the Company beyond the cash payment already contemplated under his Endorsement Agreement under the Amendment. In addition, the Company donated
80
U.S. dollar for each unit of the pizza sold in the United States and
19. Litigation, Commitments and Contingencies
Litigation
The Company is involved in a number of lawsuits, claims, investigations and proceedings, including those specifically identified below, consisting of intellectual property, employment, consumer, commercial and other matters arising in the ordinary course of business. In accordance with ASC 450, “Contingencies” the Company has made accruals with respect to these matters where appropriate, which are reflected in the Company’s consolidated financial statements. We review these provisions at least quarterly and adjust them to reflect the impact of negotiations, settlements, rulings, advice of legal counsel and other information and events pertaining to a particular case.
Durling et al v. Papa John’s International, Inc., is a conditionally certified collective action filed in May 2016 in the United States District Court for the Southern District of New York, alleging that corporate restaurant delivery drivers were not properly reimbursed for vehicle mileage and expenses in accordance with the Fair Labor Standards Act. In July 2018, the District Court granted a motion to certify a conditional corporate collective class and the opt-in notice process has been completed. As of the close of the opt-in period on October 29, 2018,
In re Papa John’s Employee & Franchise Employee Antitrust Litigation is a putative class action filed in December 2018 in the United States District Court for the Western District of Kentucky. The suit alleges that the “no-poaching” provision previously contained in the Company’s franchise agreement constituted an unlawful agreement or conspiracy in restraint of trade and commerce in violation of Section 1 of the Sherman Antitrust Act. The case is currently in discovery and to date no class has been certified or conditionally certified. The Company continues to deny any liability or wrongdoing in this matter and is vigorously defending this action. The Company has not recorded any liability related to this lawsuit as of December 26, 2021 as it does not believe a loss is probable or reasonably estimable.
20. Equity Compensation
We award stock options, time-based restricted stock and performance-based restricted stock units from time to time under the Papa John’s International, Inc. 2018 Omnibus Incentive Plan. There are approximately
We recorded stock-based employee compensation expense of $
Stock Options
Options exercised, which were issued from authorized shares, included
81
Information pertaining to option activity during 2021 is as follows (number of options and aggregate intrinsic value in thousands):
|
|
|
|
|
Weighted |
|
|
|
|||
Average |
|
||||||||||
Weighted |
Remaining |
|
|||||||||
Number |
Average |
Contractual |
Aggregate |
|
|||||||
of |
Exercise |
Term |
Intrinsic |
|
|||||||
Options |
Price |
(In Years) |
Value |
|
|||||||
Outstanding at December 27, 2020 |
|
$ |
|||||||||
Exercised |
|
( |
|
||||||||
Cancelled |
|
( |
|
||||||||
Outstanding at December 26, 2021 |
|
$ |
|
$ |
|||||||
Exercisable at December 26, 2021 |
|
$ |
|
$ |
|||||||
The following is a summary of the significant assumptions used in estimating the fair value of options granted in 2019 (none granted in 2021 or 2020, respectively):
|
2019 |
|
|
Assumptions (weighted average): |
|||
Risk-free interest rate |
|
% |
|
Expected dividend yield |
|
% |
|
Expected volatility |
|
% |
|
Expected term (in years) |
|
The risk-free interest rate for the periods within the contractual life of an option is based on the U.S. Treasury yield curve in effect at the time of grant. The expected dividend yield was estimated as the annual dividend divided by the market price of the Company’s shares on the date of grant. Expected volatility was estimated using the Company’s historical share price volatility for a period similar to the expected life of the option.
Option awards are granted with an exercise price equal to the market price of the Company’s stock at the date of grant. Options granted generally vest in equal installments over
The weighted average grant-date fair values of options granted during 2019 was $
Restricted Stock
We granted shares of restricted stock that are time-based and generally vest in equal installments over
We granted
Additionally, we granted stock settled performance-based restricted stock units to executive management (
82
The 2021 and 2020 performance-based restricted stock units require the achievement of certain performance and market factors, which consist of the Company’s Total Shareholder Return (“TSR”) relative to a predetermined peer group. The grant-date fair value of the performance-based restricted stock units was determined through the use of a Monte Carlo simulation model.
The following is a summary of the significant assumptions used in estimating the fair value of the performance-based restricted stock units granted in 2021, 2020 and 2019:
|
2021 |
2020 |
2019 |
||||
Assumptions: |
|||||||
Risk-free interest rate |
|
% |
% |
% |
|||
Expected volatility |
|
% |
% |
% |
The risk-free interest rate for the periods within the contractual life of the performance-based restricted stock unit is based on the U.S. Treasury yield curve in effect at the time of grant. Expected volatility was estimated using the Company’s historical share price volatility for a period similar to the expected life of the performance-based restricted stock unit.
The performance-based restricted stock units granted vest over
The fair value of time-based restricted stock and performance-based restricted stock units is based on the market price of the Company’s shares on the grant date. Information pertaining to these awards during 2021 is as follows (shares in thousands):
|
|
|
Weighted |
||
Average |
|||||
Grant-Date |
|||||
Shares |
Fair Value |
||||
Total as of December 27, 2020 |
|
|
$ |
|
|
Granted |
|
|
|
||
Forfeited |
|
( |
|
||
Vested |
|
( |
|
||
Total as of December 26, 2021 |
|
|
$ |
|
|
21. Employee Benefit Plans
We have established the Papa John’s International, Inc. 401(k) Plan (the “401(k) Plan”), as a defined contribution benefit plan, in accordance with Section 401(k) of the Internal Revenue Code. The 401(k) Plan is open to employees who meet certain eligibility requirements and allows participating employees to defer receipt of a portion of their compensation and contribute such amount to one or more investment funds. At our discretion, we may make matching contribution payments, which are subject to vesting based on an employee’s length of service with us.
In addition, we maintain a non-qualified deferred compensation plan available to certain employees and directors. Under this plan, the participants may defer a certain amount of their compensation, which is credited to the participants’ accounts. The participant-directed investments associated with this plan are included in Other assets ($
At our discretion, we contributed a matching payment of
83
22. Segment Information
We have
Generally, we evaluate performance and allocate resources based on operating income and intercompany eliminations. Certain administrative and capital costs are allocated to segments based upon predetermined rates or estimated resource usage. We account for intercompany sales and transfers as if the sales or transfers were to third parties and eliminate the activity in consolidation.
Our reportable segments are business units that provide different products or services. Separate management of each segment is required because each business unit is subject to different operational issues and strategies.
84
Our segment information is as follows:
(In thousands) |
|
2021 |
2020 |
2019 |
||||||
Revenues: |
||||||||||
Domestic Company-owned restaurants |
$ |
|
$ |
|
$ |
|
||||
North America franchising |
|
|
|
|
|
|
||||
North America commissaries |
|
|
|
|
|
|
||||
International |
|
|
|
|
|
|
||||
All others |
|
|
|
|
|
|
||||
Total revenues |
$ |
|
$ |
|
$ |
|
||||
Intersegment revenues: |
||||||||||
North America franchising |
$ |
|
$ |
|
$ |
|
||||
North America commissaries |
|
|
|
|||||||
International |
|
- |
|
- |
|
|
||||
All others |
|
|
|
|
|
|
||||
Total intersegment revenues |
$ |
|
$ |
|
$ |
|
||||
Depreciation and amortization: |
||||||||||
Domestic Company-owned restaurants |
$ |
|
$ |
|
$ |
|
||||
North America commissaries |
|
|
|
|
|
|
||||
International |
|
|
|
|
|
|
||||
All others |
|
|
|
|
|
|
||||
Unallocated corporate expenses |
|
|
|
|
|
|
||||
Total depreciation and amortization |
$ |
|
$ |
|
$ |
|
||||
Operating income: |
||||||||||
Domestic Company-owned restaurants (1) |
$ |
|
$ |
|
$ |
|
||||
North America franchising |
|
|
|
|
|
|
||||
North America commissaries |
|
|
|
|
|
|
||||
International |
|
|
|
|
|
|
||||
All others |
|
|
|
|
|
( |
||||
Unallocated corporate expenses |
|
( |
|
( |
|
( |
||||
Elimination of intersegment (profits) |
|
( |
|
( |
|
( |
||||
Total operating income |
$ |
|
$ |
|
$ |
|
||||
| (1) |
Includes $ |
(In thousands) |
|
2021 |
|
2020 |
|
2019 |
|||
Property and equipment, net: |
|||||||||
Domestic Company-owned restaurants |
$ |
|
$ |
|
$ |
|
|||
North America commissaries |
|
|
|
|
|
|
|||
International |
|
|
|
|
|
|
|||
All others |
|
|
|
|
|
|
|||
Unallocated corporate assets |
|
|
|
|
|
|
|||
Accumulated depreciation and amortization |
|
( |
|
( |
|
( |
|||
Property and equipment, net |
$ |
|
$ |
|
$ |
|
|||
Expenditures for property and equipment: |
|||||||||
Domestic Company-owned restaurants |
$ |
|
$ |
|
$ |
|
|||
North America commissaries |
|
|
|
|
|
|
|||
International |
|
|
|
|
|
|
|||
All others |
|
|
|
|
|
|
|||
Unallocated corporate |
|
|
|
|
|
|
|||
Total expenditures for property and equipment (1) |
$ |
|
$ |
|
$ |
|
|||
| (1) |
Increase of $ |
85
Disaggregation of Revenue
In the following tables, revenues are disaggregated by major product line. The tables also include a reconciliation of the disaggregated revenues by the reportable segment (in thousands):
Reportable Segments |
||||||||||||||||||
Year Ended December 26,2021 |
||||||||||||||||||
Major Products/Services Lines |
Domestic Company-owned restaurants |
North America franchising |
North America commissaries |
International |
All others |
Total |
||||||||||||
Company-owned restaurant sales |
$ |
|
$ |
- |
$ |
- |
$ |
- |
$ |
- |
$ |
|
||||||
Franchise royalties and fees |
- |
|
- |
|
- |
|
||||||||||||
Commissary sales |
- |
- |
|
|
- |
|
||||||||||||
Other revenues |
- |
- |
- |
|
|
|
||||||||||||
Eliminations |
- |
( |
( |
- |
( |
( |
||||||||||||
Total segment revenues |
$ |
|
$ |
|
$ |
|
$ |
|
$ |
|
$ |
|
||||||
International other revenues (1) |
- |
- |
- |
( |
|
- |
||||||||||||
Total revenues |
$ |
|
$ |
|
$ |
|
$ |
|
$ |
|
$ |
|
||||||
Reportable Segments |
||||||||||||||||||
Year Ended December 27, 2020 |
||||||||||||||||||
Major Products/Services Lines |
Domestic Company-owned restaurants |
North America franchising |
North America commissaries |
International |
All others |
Total |
||||||||||||
Company-owned restaurant sales |
$ |
|
$ |
- |
$ |
- |
$ |
- |
$ |
- |
$ |
|
||||||
Franchise royalties and fees |
- |
|
- |
|
- |
|
||||||||||||
Commissary sales |
- |
- |
|
|
- |
|
||||||||||||
Other revenues |
- |
- |
- |
|
|
|
||||||||||||
Eliminations |
- |
( |
( |
- |
( |
( |
||||||||||||
Total segment revenues |
$ |
|
$ |
|
$ |
|
$ |
|
$ |
|
$ |
|
||||||
International other revenues (1) |
- |
- |
- |
( |
|
- |
||||||||||||
Total revenues |
$ |
|
$ |
|
$ |
|
$ |
|
$ |
|
$ |
|
||||||
Reportable Segments |
||||||||||||||||||
Year Ended December 29, 2019 |
||||||||||||||||||
Major Products/Services Lines |
Domestic Company-owned restaurants |
North America franchising |
North America commissaries |
International |
All others |
Total |
||||||||||||
Company-owned restaurant sales |
$ |
|
$ |
- |
$ |
- |
$ |
- |
$ |
- |
$ |
|
||||||
Franchise royalties and fees |
- |
|
- |
|
- |
|
||||||||||||
Commissary sales |
- |
- |
|
|
- |
|
||||||||||||
Other revenues |
- |
- |
- |
|
|
|
||||||||||||
Eliminations |
- |
( |
( |
( |
( |
( |
||||||||||||
Total segment revenues |
$ |
|
$ |
|
$ |
|
$ |
|
$ |
|
$ |
|
||||||
International other revenues (1) |
- |
- |
- |
( |
|
- |
||||||||||||
International eliminations (1) |
- |
- |
- |
|
( |
- |
||||||||||||
Total revenues |
$ |
|
$ |
|
$ |
|
$ |
|
$ |
|
$ |
|
||||||
| (1) |
Other revenues as reported in the Consolidated Statements of Operations include $ |
86
Item 9. Changes in and Disagreements with Accountants on Accounting and Financial Disclosure
None.
Item 9A. Controls and Procedures
| (a) | Evaluation of Disclosure Controls and Procedures |
As of the end of the period covered by this report, we carried out an evaluation, under the supervision and with the participation of our management, including our Chief Executive Officer (“CEO”) and Chief Financial Officer (“CFO”), of the effectiveness of our disclosure controls and procedures (as defined in Rules 13a-15(e) and 15d-15(e) of the Exchange Act). Based upon this evaluation, the CEO and CFO concluded that the Company’s disclosure controls and procedures are effective.
| (b) | Management’s Report on our Internal Control over Financial Reporting |
Our management is responsible for establishing and maintaining adequate internal control over financial reporting, as such term is defined in Rule 13a-15(f) promulgated under the Exchange Act. Our internal control system is designed to provide reasonable assurance to our management and the board of directors regarding the preparation and fair presentation of published financial statements. All internal control systems, no matter how well designed, have inherent limitations. Therefore, even those systems determined to be effective can provide only reasonable assurance with respect to financial statement preparation and presentation.
Under the supervision and with the participation of our management, including our CEO and CFO, we conducted an evaluation of the effectiveness of our internal control over financial reporting based on the criteria established in Internal Control — Integrated Framework issued by the Committee of Sponsoring Organizations (“COSO”) of the Treadway Commission (“2013 Framework”). Based on our evaluation under the COSO 2013 Framework, our management concluded that our internal control over financial reporting was effective as of December 26, 2021.
Ernst & Young LLP, an independent registered public accounting firm, has audited the 2021 Consolidated Financial Statements included in this Annual Report on Form 10-K and, as part of its audit, has issued an attestation report, included herein, on the effectiveness of our internal control over financial reporting.
| (c) | Changes in Internal Control over Financial Reporting |
There were no changes in our internal control over financial reporting during the quarter ended December 26, 2021 that have materially affected, or are likely to materially affect, the Company’s internal control over financial reporting.
87
Report of Independent Registered Public Accounting Firm
To the Stockholders and the Board of Directors of Papa John’s International, Inc. and Subsidiaries
Opinion on Internal Control over Financial Reporting
We have audited Papa John’s International, Inc. and Subsidiaries’ internal control over financial reporting as of December 26, 2021, based on criteria established in Internal Control— Integrated Framework issued by the Committee of Sponsoring Organizations of the Treadway Commission (2013 Framework) (the COSO criteria). In our opinion, Papa John’s International, Inc. and Subsidiaries (the Company) maintained, in all material respects, effective internal control over financial reporting as of December 26, 2021, based on the COSO criteria.
We also have audited, in accordance with the standards of the Public Company Accounting Oversight Board (United States) (PCAOB), the 2021 consolidated financial statements of the Company, and our report dated February 24, 2022 expressed an unqualified opinion thereon.
Basis for Opinion
The Company’s management is responsible for maintaining effective internal control over financial reporting and for its assessment of the effectiveness of internal control over financial reporting included in the accompanying “Management’s Report on our Internal Control Over Financial Reporting.” Our responsibility is to express an opinion on the Company’s internal control over financial reporting based on our audit. We are a public accounting firm registered with the PCAOB and are required to be independent with respect to the Company in accordance with the U.S. federal securities laws and the applicable rules and regulations of the Securities and Exchange Commission and the PCAOB.
We conducted our audit in accordance with the standards of the PCAOB. Those standards require that we plan and perform the audit to obtain reasonable assurance about whether effective internal control over financial reporting was maintained in all material respects.
Our audit included obtaining an understanding of internal control over financial reporting, assessing the risk that a material weakness exists, testing and evaluating the design and operating effectiveness of internal control based on the assessed risk, and performing such other procedures as we considered necessary in the circumstances. We believe that our audit provides a reasonable basis for our opinion.
Definition and Limitations of Internal Control Over Financial Reporting
A company’s internal control over financial reporting is a process designed to provide reasonable assurance regarding the reliability of financial reporting and the preparation of financial statements for external purposes in accordance with generally accepted accounting principles. A company’s internal control over financial reporting includes those policies and procedures that (1) pertain to the maintenance of records that, in reasonable detail, accurately and fairly reflect the transactions and dispositions of the assets of the company; (2) provide reasonable assurance that transactions are recorded as necessary to permit preparation of financial statements in accordance with generally accepted accounting principles, and that receipts and expenditures of the company are being made only in accordance with authorizations of management and directors of the company; and (3) provide reasonable assurance regarding prevention or timely detection of unauthorized acquisition, use, or disposition of the company’s assets that could have a material effect on the financial statements.
Because of its inherent limitations, internal control over financial reporting may not prevent or detect misstatements. Also, projections of any evaluation of effectiveness to future periods are subject to the risk that controls may become inadequate because of changes in conditions, or that the degree of compliance with the policies or procedures may deteriorate.
/s/ Ernst & Young LLP
Louisville, Kentucky
February 24, 2022
88
Item 9B. Other Information
None.
Item 9C. Disclosure Regarding Foreign Jurisdictions that Prevent Inspections
None.
PART III
Item 10. Directors, Executive Officers and Corporate Governance
Information regarding executive officers is included above under the caption “Information about our Executive Officers” at the end of Part I of this Report. Other information regarding directors, executive officers and corporate governance appearing under the captions “Corporate Governance,” “Item 1. Election of Directors,” “Delinquent Section 16(a) Reports” and “Executive Compensation / Compensation Discussion and Analysis” is incorporated by reference from the Company’s definitive proxy statement, which will be filed with the Securities and Exchange Commission no later than 120 days after the end of the fiscal year covered by this Report.
We have adopted a written code of ethics that applies to our directors, officers and employees. We intend to post all required disclosures concerning any amendments to or waivers from, our code of ethics on our website to the extent permitted by Nasdaq. Our code of ethics can be found on our website, which is located at www.papajohns.com.
Item 11. Executive Compensation
Information regarding executive compensation appearing under the captions “Executive Compensation / Compensation Discussion and Analysis,” “Compensation Committee Report” and “Certain Relationships and Related Transactions — Compensation Committee Interlocks and Insider Participation” is incorporated by reference from the Company’s definitive proxy statement, which will be filed with the Securities and Exchange Commission no later than 120 days after the end of the fiscal year covered by this Report.
Item 12. Security Ownership of Certain Beneficial Owners and Management and Related Stockholder Matters
The following table provides information as of December 26, 2021 regarding the number of shares of the Company’s common stock that may be issued under the Company’s equity compensation plans.
|
|
|
(c) |
||||
(a) |
(b) |
Number of securities |
|||||
Number of |
Weighted |
remaining available |
|||||
securities to be |
average |
for future issuance |
|||||
issued upon exercise |
exercise price |
under equity |
|||||
of outstanding |
of outstanding |
compensation plans, |
|||||
options, warrants |
options, warrants |
excluding securities |
|||||
Plan Category |
and rights |
and rights |
reflected in column (a) |
||||
Equity compensation plans approved by security holders |
|
319,045 |
$ |
54.65 |
|
4,264,031 |
|
Equity compensation plans not approved by security holders * |
|
138,060 |
|||||
Total |
|
457,105 |
$ |
54.65 |
|
4,264,031 |
|
* |
Represents shares of common stock issuable pursuant to the non-qualified deferred compensation plan. The weighted average exercise price (column b) does not include any assumed price for issuance of shares pursuant to the non-qualified deferred compensation plan. |
Information regarding security ownership of certain beneficial owners and management and related stockholder matters appearing under the caption “Security Ownership of Certain Beneficial Owners and Management” is incorporated by
89
reference from the Company’s definitive proxy statement, which will be filed with the Securities and Exchange Commission no later than 120 days after the end of the fiscal year covered by this Report.
Item 13. Certain Relationships and Related Transactions, and Director Independence
Information regarding certain relationships and related transactions, and director independence appearing under the captions “Corporate Governance” and “Certain Relationships and Related Transactions” is incorporated by reference from the Company’s definitive proxy statement, which will be filed with the Securities and Exchange Commission no later than 120 days after the end of the fiscal year covered by this Report.
Item 14. Principal Accounting Fees and Services
Information regarding principal accounting fees and services appearing under the caption “Ratification of the Selection of Independent Auditors” is incorporated by reference from the Company’s definitive proxy statement, which will be filed with the Securities and Exchange Commission no later than 120 days after the end of the fiscal year covered by this Report.
PART IV
Item 15. Exhibits, Financial Statement Schedules
(a)(1)Financial Statements:
The following Consolidated Financial Statements, notes related thereto and reports of independent auditors are included in Item 8 of this Report:
| ● | Report of Independent Registered Public Accounting Firm |
| ● | Consolidated Statements of Operations for the years ended December 26, 2021, December 27, 2020 and December 29, 2019 |
| ● | Consolidated Statements of Comprehensive Income (Loss) for the years ended December 26, 2021, December 27, 2020 and December 29, 2019 |
| ● | Consolidated Balance Sheets as of December 26, 2021 and December 27, 2020 |
| ● | Consolidated Statements of Stockholders’ Deficit for the years ended December 26, 2021, December 27, 2020 and December 29, 2019 |
| ● | Consolidated Statements of Cash Flows for the years ended December 26, 2021, December 27, 2020 and December 29, 2019 |
| ● | Notes to Consolidated Financial Statements |
(a)(2)Financial Statement Schedules:
All other schedules for which provision is made in the applicable accounting regulation of the Securities and Exchange Commission are not required under the related instructions or are inapplicable and, therefore, have been omitted.
(a)(3)Exhibits:
The exhibits listed in the accompanying index to Exhibits are filed as part of this Form 10-K.
Item 16. Summary
None.
90
91
Exhibit |
|
|
|
|---|---|---|---|
Number |
Description of Exhibit |
||
4.9 |
|
||
10.1 |
|||
10.2 |
|||
10.3 |
|||
10.4 |
|||
10.5* |
|||
10.6* |
|||
10.7 |
|||
10.8 |
|||
92
Exhibit |
|
|
|
|---|---|---|---|
Number |
Description of Exhibit |
||
10.9 |
|||
10.10* |
|||
10.11* |
|||
10.12* |
|||
10.13* |
|||
10.14* |
|||
10.15* |
|||
10.16* |
|||
10.17* |
|||
10.18 |
|||
21** |
|||
23.1** |
|||
31.1** |
Section 302 Certification of Chief Executive Officer Pursuant to Exchange Act Rule 13a-15(e). |
||
31.2** |
Section 302 Certification of Chief Financial Officer Pursuant to Exchange Act Rule 13a-15(e). |
||
93
Exhibit |
|
|
|
|---|---|---|---|
Number |
Description of Exhibit |
||
32.1** |
|||
32.2** |
|||
101 |
Financial statements from the Annual Report on Form 10-K of Papa John’s International, Inc. for the year ended December 26, 2021, filed on February 24, 2022 formatted in inline XBRL: (i) the Consolidated Statements of Operations, (ii) the Consolidated Statements of Comprehensive Income (Loss), (iii) the Consolidated Balance Sheets, (iv) the Consolidated Statements of Stockholders’ Deficit, (v) the Consolidated Statements of Cash Flows and (vi) the Notes to Consolidated Financial Statements. |
||
104 |
Cover Page Interactive Data File (formatted as Inline XBRL and contained in Exhibit 101). |
* Compensatory plan required to be filed as an exhibit pursuant to Item 15(c) of Form 10-K.
**Filed herewith.
94
SIGNATURES
Pursuant to the requirements of Section 13 or 15(d) of the Securities Exchange Act of 1934, the Registrant has duly caused this report to be signed on its behalf by the undersigned, thereunto duly authorized.
Date: February 24, 2022 |
|
|
PAPA JOHN’S INTERNATIONAL, INC. |
|
By: |
/s/ Robert M. Lynch |
|||
Robert M. Lynch |
||||
|
President and Chief Executive Officer
|
95
Pursuant to the requirements of the Securities Exchange Act of 1934, this report has been signed below by the following persons on behalf of the Registrant and in the capacities and on the dates indicated.
Signature |
|
Title |
|
Date |
|
/s/ Jeffrey C. Smith |
Chairman |
February 24, 2022 |
|||
Jeffrey C. Smith |
|||||
/s/ Robert M. Lynch |
President and Chief Executive Officer |
February 24, 2022 |
|||
Robert M. Lynch |
(Principal Executive Officer and Director) |
||||
/s/ Ann B. Gugino |
Chief Financial Officer |
February 24, 2022 |
|||
Ann B. Gugino |
(Principal Financial Officer and |
||||
Principal Accounting Officer) |
|||||
/s/ Christopher L. Coleman |
Director |
February 24, 2022 |
|||
Christopher L. Coleman |
|||||
/s/ Olivia F. Kirtley |
Director |
February 24, 2022 |
|||
Olivia F. Kirtley |
|||||
/s/ Laurette T. Koellner |
Director |
February 24, 2022 |
|||
Laurette T. Koellner |
|||||
/s/ Jocelyn C. Mangan |
Director |
February 24, 2022 |
|||
Jocelyn C. Mangan |
|||||
/s/ Sonya E. Medina |
Director |
February 24, 2022 |
|||
Sonya E. Medina |
|||||
/s/ Shaquille R. O’Neal |
Director |
February 24, 2022 |
|||
Shaquille R. O’Neal |
|||||
/s/ Anthony M. Sanfilippo |
Director |
February 24, 2022 |
|||
Anthony M. Sanfilippo |
96