10-K: Annual report pursuant to Section 13 and 15(d)
Published on February 24, 2015
UNITED STATES
SECURITIES AND EXCHANGE COMMISSION
Washington, D.C. 20549
FORM 10-K
(Mark One)
|
x |
Annual Report pursuant to Section 13 or 15(d) of the Securities Exchange Act of 1934 |
For the fiscal year ended December 28, 2014
or
|
o |
Transition report pursuant to Section 13 or 15(d) of the Securities Exchange Act of 1934 |
For the transition period from to
Commission File Number: 0-21660
PAPA JOHNS INTERNATIONAL, INC.
(Exact name of registrant as specified in its charter)
|
Delaware |
|
61-1203323 |
|
(State or other jurisdiction of |
|
(I.R.S. Employer |
|
incorporation or organization) |
|
Identification No.) |
|
2002 Papa Johns Boulevard |
|
|
|
Louisville, Kentucky |
|
40299-2367 |
|
(Address of principal executive offices) |
|
(Zip Code) |
(502) 261-7272
(Registrants telephone number, including area code)
Securities registered pursuant to Section 12(b) of the Act:
|
(Title of Each Class) |
|
(Name of each exchange on which registered) |
|
Common Stock, $0.01 par value |
|
The NASDAQ Stock Market LLC |
Securities registered pursuant to Section 12(g) of the Act: None
Indicate by check mark if the registrant is a well-known seasoned issuer, as defined in Rule 405 of the Securities Act. Yes x No o
Indicate by check mark if the registrant is not required to file reports pursuant to Section 13 or Section 15(d) of the Act. Yes o No x
Indicate by check mark whether the registrant (1) has filed all reports required to be filed by Section 13 or 15(d) of the Securities Exchange Act of 1934 during the preceding 12 months (or for such shorter period that the registrant was required to file such reports), and (2) has been subject to such filing requirements for the past 90 days. Yes x No o
Indicate by check mark whether the registrant has submitted electronically and posted on its corporate Website, if any, every Interactive Data File required to be submitted and posted pursuant to Rule 405 of Regulation S-T (§232.405 of this chapter) during the preceding 12 months (or for such shorter period that the registrant was required to submit and post such files). Yes x No o
Indicate by check mark if disclosure of delinquent filers pursuant to Item 405 of Regulation S-K (§229.405 of this chapter) is not contained herein, and will not be contained, to the best of registrants knowledge, in definitive proxy or information statements incorporated by reference in Part III of this Form 10-K or any amendment to this Form 10-K. x
Indicate by check mark whether the registrant is a large accelerated filer, an accelerated filer, a non-accelerated filer or a smaller reporting company. See the definitions of large accelerated filer, accelerated filer and smaller reporting company in Rule 12b-2 of the Exchange Act.
|
Large accelerated filer x |
|
Accelerated filer o |
|
Non-accelerated filer o |
|
Smaller reporting company o |
Indicate by check mark whether the registrant is a shell company (as defined in Rule 12b-2 of the Act). Yes o No x
The aggregate market value of the common stock held by non-affiliates of the Registrant, computed by reference to the closing sale price on The NASDAQ Stock Market as of the last business day of the Registrants most recently completed second fiscal quarter, June 29, 2014, was $1,289,380,885.
As of February 17, 2015, there were 39,779,082 shares of the Registrants common stock outstanding.
DOCUMENTS INCORPORATED BY REFERENCE
Portions of Part III of this annual report are incorporated by reference to the Registrants Proxy Statement for the Annual Meeting of Stockholders to be held April 29, 2015.
General
Papa Johns International, Inc., a Delaware corporation (referred to as the Company, Papa Johns or in the first person notations of we, us and our) operates and franchises pizza delivery and carryout restaurants and, in certain international markets, dine-in and delivery restaurants under the trademark Papa Johns. Papa Johns began operations in 1984. At December 28, 2014, there were 4,663 Papa Johns restaurants in operation, consisting of 735 Company-owned and 3,928 franchised restaurants operating domestically in all 50 states and in 36 countries and territories. Our Company-owned restaurants include 200 restaurants operated under four joint venture arrangements and 49 units in Beijing and North China.
Papa Johns has defined five reportable segments: domestic Company-owned restaurants, domestic commissaries (Quality Control Centers), North America franchising, international operations, and all other business units. North America is defined as the United States and Canada. Domestic is defined as the contiguous United States. International franchisees are defined as all franchise operations outside of the United States and Canada. See Managements Discussion and Analysis of Financial Condition and Results of Operations and Note 20 of Notes to Consolidated Financial Statements for financial information about our segments.
All of our periodic and current reports filed with the Securities and Exchange Commission (the SEC) pursuant to Section 13(a) or 15(d) of the Securities and Exchange Act of 1934, as amended (the Exchange Act), are available, free of charge, through our website located at www.papajohns.com, including our annual reports on Form 10-K, quarterly reports on Form 10-Q, current reports on Form 8-K and any amendments to those reports. Those documents are available through our website as soon as reasonably practicable after we electronically file them with the SEC. We also make available free of charge on our website our Corporate Governance Guidelines, Board Committee Charters, and our Code of Ethics, which applies to Papa Johns directors, officers and employees. Printed copies of such documents are also available free of charge upon written request to Investor Relations, Papa Johns International, Inc., P.O. Box 99900, Louisville, KY 40269-0900. You may read and copy any materials filed with the SEC at the SECs Public Reference Room at 100 F Street, NE, Washington, DC 20549. You may obtain information on the operation of the Public Reference Room by calling the SEC at 1-800-SEC-0330. This information is also available at www.sec.gov. The references to these website addresses do not constitute incorporation by reference of the information contained on the websites, which should not be considered part of this document.
Strategy
Our goal is to build the strongest brand loyalty in the pizza industry. Recognized as a trusted brand and quality leader in the domestic pizza category, we endeavor to build our brand on a global basis. The key elements of our strategy include:
High-Quality Menu Offerings. Our menu strategy focuses on the quality of our ingredients. Domestic Papa Johns restaurants offer high-quality pizza along with side items, including breadsticks, cheesesticks, chicken poppers and wings, dessert items and canned or bottled beverages. Papa Johns traditional crust pizza is prepared using fresh dough (never frozen). Papa Johns pizzas are made from a proprietary blend of wheat flour, 100% real cheese made from mozzarella, fresh-packed pizza sauce made from vine-ripened tomatoes (not from concentrate) and a proprietary mix of savory spices, and a choice of high-quality meat (100% beef and pork with no fillers) and vegetable
toppings. Our traditional crust pizza offers a container of our special garlic sauce and a pepperoncini pepper. In addition to our fresh dough traditional crust pizza, we offer a thin crust pizza, which is a par-baked product produced by a third-party vendor. Each thin crust pizza is served with a packet of special seasonings and a pepperoncini pepper.
Domestically, all ingredients and toppings can be purchased by our restaurants from our Quality Control Center (QC Center) system, which delivers to individual restaurants twice weekly. To ensure consistent food quality, each domestic franchisee is required to purchase dough and tomato sauce from our QC Centers and to purchase all other supplies from our QC Centers or other approved suppliers. Internationally, the menu may be more diverse than in our domestic operations to meet local tastes and customs. QC Centers outside the U.S. may be operated by franchisees pursuant to license agreements or by other third parties. International QC Centers are required to meet food safety and quality standards and to be in compliance with all applicable laws. We provide significant assistance to licensed international QC Centers in sourcing approved quality suppliers.
We continue to test new product offerings both domestically and internationally, including limited time offering pizzas. The new products can become a part of the permanent menu if they meet certain established guidelines.
Efficient Operating System. We believe our operating and distribution systems, restaurant layout and designated delivery areas result in lower restaurant operating costs and improved food quality, and promote superior customer service. Our QC Center system takes advantage of volume purchasing of food and supplies and provides consistency and efficiencies of scale in fresh dough production. This eliminates the need for each restaurant to order food from multiple vendors and commit substantial labor and other resources to dough preparation.
Commitment to Team Member Training and Development. We are committed to the development and motivation of our team members through training programs, incentive and recognition programs and opportunities for advancement. Team member training programs are conducted for corporate restaurant team members, and operational training is offered to our franchisees. We offer performance-based financial incentives to corporate and restaurant team members at various levels.
Marketing. Our domestic marketing strategy consists of both national and local components. Our national strategy includes national advertising via television, print, direct mail, digital, mobile marketing and social media channels. Our online and digital marketing activities have increased significantly over the past several years in response to increasing consumer use of online and mobile web technology. Local advertising programs include television, radio, and print materials. We strive to efficiently allocate resources among television, print, digital, social and other media, and integrate social media into marketing campaigns.
In international markets, our marketing focuses on reaching customers who live or work within a small radius of a Papa Johns restaurant. Our international markets use a combination of advertising strategies, including television, radio, digital, and print depending on the size of the local market.
Strong Franchise System. We are committed to developing and maintaining a strong franchise system by attracting experienced operators, supporting them to expand and grow their business and monitoring their compliance with our high standards. We seek to attract franchisees with experience in restaurant or retail operations and with the financial resources and management capability to open single or multiple locations. We devote significant resources to provide Papa Johns franchisees with assistance in restaurant operations, management training, team member training, marketing, site selection and restaurant design.
Our strategy for global unit growth focuses on our strong unit economics model. We strive to eliminate barriers to expansion in existing international markets, and identify new expansion opportunities. Our growth depends on the maturity of the market and other factors in specific domestic and international markets, with overall unit growth expected to come increasingly from international markets.
Restaurant Sales and Investment Costs
We are committed to maintaining strong restaurant unit economics. In 2014, the 646 domestic Company-owned restaurants included in the full years comparable restaurant base generated average annual unit sales of $1.06 million. Our North American franchise restaurants, which included 2,307 restaurants in 2014, generated average annual unit sales of $834,000. North American franchise restaurant sales are lower than Company-owned restaurants as a higher percentage of our Company-owned restaurants are located in more heavily penetrated markets.
The average cash investment for the 11 domestic traditional Company-owned restaurants opened during 2014, exclusive of land, was approximately $283,000 per unit, excluding tenant allowances that we received. With few exceptions, domestic restaurants do not offer a dine-in area, which reduces our restaurant capital investment.
We define a traditional domestic Papa Johns restaurant as a delivery and carryout unit that services a defined trade area. We consider the location of a traditional restaurant to be important and therefore devote significant resources to the investigation and evaluation of potential sites. The site selection process includes a review of trade area demographics, target population density and competitive factors. A member of our development team inspects each potential domestic Company-owned restaurant location and substantially all franchised restaurant locations before a site is approved. Our restaurants are typically located in strip shopping centers or freestanding buildings that provide visibility, curb appeal and accessibility. Our restaurant design can be configured to fit a wide variety of building shapes and sizes, which increases the number of suitable locations for our restaurants. A typical traditional domestic Papa Johns restaurant averages 1,100 to 1,500 square feet with visible exterior signage.
Non-traditional Papa Johns restaurants generally do not provide delivery service but rather provide walk-up or carry out service to a captive customer group within a designated facility, such as a food court at an airport, university or military base or an event-driven service at facilities such as sports stadiums or entertainment venues. Non-traditional units are designed to fit the unique requirements of the venue.
All of our international restaurants are franchised, except for 49 Company-owned restaurants in Beijing and North China. In 2014, we opened two Company-owned restaurants in China with an average investment cost of approximately $290,000. Most of our international Papa Johns restaurants are slightly smaller and average between 900 and 1,400 square feet; however, in order to meet certain local customer preferences, some international restaurants have been opened in larger spaces to accommodate both dine-in and restaurant-based delivery service, typically with 35 to 140 seats.
Development
A total of 388 Papa Johns restaurants were opened during 2014, consisting of 14 Company-owned (12 in North America and two in Beijing and North China) and 374 franchised restaurants (132 in North America and 242 international), while 153 Papa Johns restaurants closed during 2014, consisting of 11 Company-owned (four in North America and seven in Beijing) and 142 franchised restaurants (86 in North America and 56 international), representing net global unit growth of 235 restaurants.
During 2015, we expect net unit growth of approximately 220 to 250 units, approximately 75% of which will open in international markets. International franchised unit expansion includes an emphasis on existing markets in the Americas, the United Kingdom and Asia.
Although most of our domestic Company-owned markets are well-penetrated, our Company-owned growth strategy is to continue to open domestic restaurants in existing markets as appropriate, thereby increasing consumer awareness and enabling us to take advantage of operational and marketing efficiencies. Our experience in developing markets indicates that market penetration through the opening of multiple restaurants in a particular market results in increased average restaurant sales in that market over time. We have co-developed domestic markets with some franchisees or divided markets among franchisees and will continue to utilize market co-development in the future, where appropriate.
Of the total 3,340 North American restaurants open as of December 28, 2014, 686 or 21% were Company-owned (including 200 units owned in joint venture arrangements with franchisees in which the Company has a majority ownership position). The Company expects the percentage of domestic Company-owned units to decline over the next several years because future net openings will be more heavily weighted toward franchise units. However, from time to time the Company evaluates the purchase or sale of units in significant markets, which could change the percentage of Company-owned units.
Of the 1,323 international restaurants open as of December 28, 2014, 49 or 4% were Company-owned (all of which are located in Beijing and North China). We plan to continue to grow our international units during the next several years, substantially all of which will be franchised.
QC Center System and Supply Chain Management
Our domestic QC Centers, comprised of ten full-service regional production and distribution centers, supply pizza dough, food products, paper products, smallwares and cleaning supplies twice weekly to each restaurant throughout the contiguous United States. This system enables us to monitor and control product quality and consistency, while lowering food and other costs. We evaluate the QC Center system capacity in relation to planned restaurant growth, and facilities are developed or upgraded as operational or economic conditions warrant.
We own full-service international QC Centers in the United Kingdom, Mexico City, Mexico and Beijing, China. Other international QC Centers are licensed to franchisees or non-franchisee third parties and are generally located in the markets where our franchisees have restaurants.
We set quality standards for all products used in our restaurants and designate approved outside suppliers of food and paper products that meet our quality standards. In order to ensure product quality and consistency, all Papa Johns restaurants are required to purchase tomato sauce and dough from QC Centers. Franchisees may purchase other goods directly from our QC Centers or other approved suppliers. National purchasing agreements with most of our suppliers generally result in volume discounts to us, allowing us to sell products to our restaurants at prices we believe are below those generally available to restaurants in the marketplace. Within our domestic QC Center system, products are distributed to restaurants by refrigerated trucks leased and primarily operated by us or transported by a dedicated logistics company.
Marketing Programs
Our local restaurant-level marketing programs target consumers within the delivery area of each restaurant through the use of local television, radio, print materials, targeted direct mail, store-to-door flyers, digital display advertising, email marketing, text messages and local social media. Local marketing
efforts also include a variety of community-oriented activities within schools, sports venues and other organizations supported with some of the same advertising vehicles mentioned above.
Domestic Company-owned and franchised Papa Johns restaurants within a defined market are required to join an area advertising cooperative (Co-op). Each member restaurant contributes a percentage of sales to the Co-op for market-wide programs, such as television, radio, digital and print advertising, and sports sponsorships. The rate of contribution and uses of the monies collected are determined by a majority vote of the Co-ops members. The contribution rate for Co-ops generally may not be below 2% of sales without approval from Papa Johns.
The restaurant-level and Co-op marketing efforts are supported by media, print, digital and electronic advertising materials that are produced by Papa Johns Marketing Fund, Inc. (PJMF). PJMF is an unconsolidated nonstock corporation designed to operate at break-even for the purpose of designing and administering advertising and promotional programs for all participating domestic restaurants. PJMF produces and buys air time for Papa Johns national television commercials, buys digital media such as banner advertising, paid search-engine advertising, mobile marketing, social media advertising and marketing, and SMS text and email, in addition to other brand-building activities, such as consumer research and public relations activities. Domestic Company-owned and franchised Papa Johns restaurants are required to contribute a certain minimum percentage of sales to PJMF. The contribution rate to PJMF can be increased above the required minimum contribution rate if approved by the governing board of PJMF up to 4% of sales, and beyond those levels if approved by a supermajority of domestic restaurants. The contribution rate has been 4% since 2011.
We provide both Company-owned and franchised restaurants with pre-approved marketing materials and catalogs for the purchase of uniforms and promotional items. We also provide direct marketing services to Company-owned and franchised restaurants using customer information gathered by our proprietary point-of-sale technology (see Company Operations Domestic Point-of-Sale Technology). In addition, we provide database tools, templates and training for operators to facilitate local email marketing and text messaging through our approved tools.
Our proprietary digital ordering platform allows customers to order online. Our eCommerce platforms include plan ahead ordering, Spanish-language ordering capability, Google Wallet® alternative payment and enhanced mobile web ordering for our customers, including Papa Johns iPhone® and Android® applications. Our Papa Rewards® program is an eCommerce customer loyalty program designed to increase loyalty and frequency of consumer use of our eCommerce ordering platform. We receive a percentage-based fee from U.S. franchisees for online sales, in addition to royalties, to defray development and operating costs associated with our eCommerce ordering platform.
Our domestic restaurants offer customers the opportunity to purchase a reloadable gift card referred to as the Papa Card. The Papa Card is sold as either a plastic gift card purchased in our restaurants, or an online digital card. We sell Papa Cards to consumers on our website and through third-party retailers. We also sell cards in bulk to business entities and organizations. We continue to explore other Papa Card distribution opportunities. The Papa Card may be redeemed for delivery, carryout, and eCommerce orders and is accepted at all Papa Johns traditional domestic restaurants.
In international markets, our marketing focuses on customers who live or work within a small radius of a Papa Johns restaurant. Certain markets can effectively use television and radio as part of their marketing strategies. The majority of the marketing efforts include using print materials such as flyers, newspaper inserts, in-store marketing materials, and to a growing extent, digital marketing such as display, search engine marketing, social media, mobile marketing, email, and SMS text. Local marketing efforts, such as sponsoring or participating in community events, sporting events and school programs, are also used to build customer awareness.
Company Operations
Domestic Restaurant Personnel. A typical Papa Johns Company-owned domestic restaurant employs a restaurant manager and approximately 20 to 25 hourly team members, many of whom work part-time. The manager is responsible for the day-to-day operation of the restaurant and maintaining Company-established operating standards. We seek to hire experienced restaurant managers and staff and provide comprehensive training programs in areas such as operations and managerial skills. We also employ directors of operations who are responsible for overseeing an average of seven Company-owned restaurants. Senior management and corporate staff also support the field teams in many areas, including, but not limited to, quality assurance, food safety, training, marketing and technology. We seek to motivate and retain personnel by providing opportunities for advancement and performance-based financial incentives.
Training and Education. The Global Operations Support and Training department is responsible for creating tools and materials for the operational training and development of both corporate and franchise team members. We believe training is very important to delivering consistent operational execution. Operations personnel complete our management training program and ongoing development programs, including multi-unit training, in which instruction is given on all aspects of our systems and operations.
Domestic Point-of-Sale Technology. During 2014, we began the roll out of our next-generation point-of-sale system, which we refer to as FOCUS, to the majority of our corporate and franchised restaurants. Approximately 75% of our restaurants were on FOCUS as of the end of the year, with the Company-owned restaurants completed. Substantial completion of the remaining franchisees is expected to occur by the end of the first quarter of 2015.
Our new FOCUS system facilitates faster and more accurate order-taking and pricing, and allows the restaurant manager to better monitor and control food and labor costs, including food inventory management and order placement from the domestic QC Centers. The system allows us to obtain restaurant operating information, providing us with timely access to sales and customer information. The FOCUS system is also integrated with our digital ordering solutions in all domestic traditional Papa Johns restaurants, enabling Papa Johns to offer nationwide digital ordering to our customers.
Domestic Hours of Operation. Our domestic restaurants are open seven days a week, typically from 11:00 a.m. to 12:30 a.m. Monday through Thursday, 11:00 a.m. to 1:30 a.m. on Friday and Saturday and 12:00 noon to 11:30 p.m. on Sunday. Carry out hours are generally more limited for late night, for security purposes.
Franchise Program
General. We continue to attract franchisees with significant restaurant and retail experience. We consider our franchisees to be a vital part of our systems continued growth and believe our relationship with our franchisees is good. As of December 28, 2014, there were 3,928 franchised Papa Johns restaurants operating in all 50 states and 36 countries and territories. During 2014, 374 (132 North America and 242 international) franchised Papa Johns restaurants were opened. As of December 28, 2014, we have development agreements with our franchisees for approximately 240 additional North America restaurants, the majority of which are committed to open over the next two to three years, and agreements for approximately 1,000 additional international franchised restaurants, the majority of which are scheduled to open over the next six years. There can be no assurance that all of these restaurants will be opened or that the development schedule set forth in the development agreements will be achieved.
Approval. Franchisees are approved on the basis of the applicants business background, restaurant operating experience and financial resources. We seek franchisees to enter into development agreements
for single or multiple restaurants. We require each franchisee to complete our training program or to hire a full-time operator who completes the training and has either an equity interest or the right to acquire an equity interest in the franchise operation. For most non-traditional operations and for operations outside the United States, we will allow an approved operator bonus plan to substitute for the equity interest.
North America Development and Franchise Agreements. We enter into development agreements with our franchisees in North America for the opening of a specified number of restaurants within a defined period of time and specified geographic area. Under our standard domestic development agreement, the franchisee is required to pay, at the time of signing the agreement, a non-refundable fee of $25,000 for the first restaurant and $5,000 for any additional restaurants. The non-refundable fee is credited against the standard $25,000 franchise fee payable to us upon signing the franchise agreement for a specific location. The franchise agreement is generally executed once a franchisee secures a location. Our current standard franchise agreement requires the franchisee to pay a royalty fee of 5% of sales, and the majority of our existing franchised restaurants also have a 5% royalty rate in effect.
Substantially all existing franchise agreements have an initial 10-year term with a 10-year renewal option. We have the right to terminate a franchise agreement for a variety of reasons, including a franchisees failure to make payments when due or failure to adhere to our policies and standards. Many state franchise laws limit our ability as a franchisor, to terminate or refuse to renew a franchise.
We provide assistance to Papa Johns franchisees in selecting sites, developing restaurants and evaluating the physical specifications for typical restaurants. We provide layout and design services and recommendations for subcontractors, signage installers and telephone systems to Papa Johns franchisees. Our franchisees can purchase complete new store equipment packages through an approved third-party supplier. In addition, we sell replacement smallwares and related items to our franchisees. Each franchisee is responsible for selecting the location for its restaurants but must obtain our approval of restaurant design and location based on accessibility and visibility of the site and targeted demographic factors, including population density, income, age and traffic.
Domestic Franchise Development Incentives. Over the past few years, we have offered various development incentive programs for domestic franchisees to accelerate unit openings. Such incentives included the following for 2014 traditional openings: (1) waiver of the standard one-time $25,000 franchise fee if the unit opens on time in accordance with the agreed-upon development schedule, or a reduced fee of $5,000 if the unit opens late; (2) the waiver of some or all of the 5% royalty fee for a period of time; (3) a credit for a portion of the purchase of certain equipment; and (4) a credit to be applied toward a future food purchase, under certain circumstances. We believe the development incentive programs have accelerated unit openings and expect they will continue to do so in 2015.
Domestic Franchise Support Initiatives. From time to time, we offer discretionary support initiatives to our domestic franchisees, including:
· Performance-based incentives;
· FOCUS installation incentive program;
· Targeted royalty relief and local marketing support to assist certain identified franchisees or markets;
· Restaurant opening incentives; and
· Reduced-cost direct mail campaigns from Preferred Marketing Solutions (Preferred, our wholly owned print and promotions subsidiary).
In 2015, we plan to offer some or all of these domestic franchise support initiatives.
International Development and Franchise Agreements. We opened our first franchised restaurant outside the United States in 1998. We define international as all markets outside the United States and Canada. In international markets, we have either a development agreement or a master franchise agreement with a franchisee for the opening of a specified number of restaurants within a defined period of time and specified geographic area. Under a master franchise agreement, the franchisee has the right to sub franchise a portion of the development to one or more sub franchisees approved by us. Under our current standard international development agreement, the franchisee is required to pay total fees of $25,000 per restaurant: $5,000 at the time of signing the agreement and $20,000 when the restaurant opens or on the agreed-upon development date, whichever comes first. Under our current standard master franchise agreement, the master franchisee is required to pay total fees of $25,000 per restaurant owned and operated by the master franchisee, under the same terms as the standard development agreement, and $15,000 for each sub franchised restaurant $5,000 at the time of signing the agreement and $10,000 when the restaurant opens or on the agreed-upon development date, whichever comes first.
Our current standard international master franchise and development agreements provide for payment to us of a royalty fee of 5% of sales. For international markets with sub franchise agreements, the effective sub franchise royalty received by the Company is generally 3%. The remaining terms applicable to the operation of individual restaurants are substantially equivalent to the terms of our domestic franchise agreement. From time to time, development agreements will be negotiated at other-than-standard terms for fees and royalties, and we may offer various development and royalty incentives to help drive net unit growth and results.
Non-traditional Restaurant Development. We had 213 non-traditional domestic restaurants at December 28, 2014. Non-traditional restaurants generally cover venues or areas not originally targeted for traditional unit development, and our franchised non-traditional restaurants have terms differing from the standard agreements.
Franchisee Loans. Selected franchisees have borrowed funds from us, principally for the purchase of restaurants from us or other franchisees or for construction and development of new restaurants. Loans made to franchisees typically bear interest at fixed or floating rates and in most cases are secured by the fixtures, equipment and signage of the restaurant and/or are guaranteed by the franchise owners. At December 28, 2014, net loans outstanding totaled $18.9 million. See Note 11 of Notes to Consolidated Financial Statements for additional information.
Domestic Franchise Insurance Program. Our franchisees may elect to purchase various insurance policies, such as health insurance, non-owned automobile and workers compensation, through our wholly-owned insurance agency. Various third-party commercial insurance companies provide fully-insured coverage for these lines of business to franchisees participating in the franchise insurance program offered by our wholly-owned insurance agency.
Domestic Franchise Training and Support. Our domestic field support structure consists of franchise business directors, each of whom is responsible for serving an average of 130 franchised units. Our franchise business directors maintain open communication with the franchise community, relaying operating and marketing information and new initiatives between franchisees and us. Franchise business directors report to division vice presidents, who report to the Vice President North America Franchise Operations.
Every franchisee is required to have a principal operator approved by us who satisfactorily completes our required training program. Principal operators for traditional restaurants are required to devote their full business time and efforts to the operation of the franchisees traditional restaurants. Each franchised restaurant manager is also required to complete our Company-certified management training program. Ongoing supervision of training is monitored by the Global Operations Support and Training team. Multi-
unit franchisees are encouraged to appoint training store general managers or hire a full-time training coordinator certified to deliver Company-approved operational training programs.
International Franchise Operations Support. We employ or contract with international business directors who are responsible for supporting one or more franchisees. The international business directors report to regional vice presidents. Senior management and corporate staff also support the international field teams in many areas, including but not limited to food safety, quality assurance, training, marketing and technology.
Franchise Operations. All franchisees are required to operate their Papa Johns restaurants in compliance with our policies, standards and specifications, including matters such as menu items, ingredients, and restaurant design. Franchisees generally have full discretion to determine the prices to be charged to customers, but we have the authority to set maximum price points for nationally advertised promotions.
Franchise Advisory Council. We have a Franchise Advisory Council (FAC) that consists of Company and franchisee representatives of domestic restaurants. We also have a franchise advisory council in the United Kingdom (UK FAC). The FAC and UK FAC and subcommittees hold regular meetings to discuss new product and marketing ideas, operations, growth and other business issues. From time to time, certain domestic franchisees have also formed a separate franchise association for the purpose of communicating and addressing issues, needs and opportunities among its members.
We currently communicate with, and receive input from, our franchisees in several forms, including through the FAC, UK FAC, annual operations conferences, system communications, national conference calls, various regional meetings conducted with franchisees throughout the year and ongoing communications from franchise business directors and international business directors in the field. Monthly webcasts are also conducted by the Company to discuss current operational, marketing or other issues affecting the franchisees business. We are committed to communicating with our franchisees and receiving input from them.
Industry and Competition
The United States Quick Service Restaurant pizza industry (QSR Pizza) is mature and highly competitive with respect to price, service, location, food quality and variety. There are well-established competitors with substantially greater financial and other resources than Papa Johns. The category is largely fragmented and competitors include international, national and regional chains, as well as a large number of local independent pizza operators. Some of our competitors have been in existence for substantially longer periods than Papa Johns and can have higher levels of restaurant penetration and stronger, more developed brand awareness in markets where we compete. According to industry sources, domestic QSR Pizza category sales, which includes dine-in, carry out and delivery, totaled approximately $32.9 billion in 2014, or an increase of 1% from the prior year.
With respect to the sale of franchises, we compete with many franchisors of restaurants and other business concepts. There is also active competition for management personnel and attractive commercial real estate sites suitable for our restaurants.
Government Regulation
We, along with our franchisees, are subject to various federal, state, local and international laws affecting the operation of our respective businesses. Each Papa Johns restaurant is subject to licensing and regulation by a number of governmental authorities, which include zoning, health, safety, sanitation, building and fire agencies in the state or municipality in which the restaurant is located. Difficulties in obtaining, or the failure to obtain, required licenses or approvals could delay or prevent the opening of a
new restaurant in a particular area. Our QC Centers are licensed and subject to regulation by state and local health and fire codes, and the operation of our trucks is subject to federal and state transportation regulations. We are also subject to federal and state environmental regulations. In addition, our domestic system-wide restaurant operations are subject to various federal and state laws governing such matters as minimum wage requirements, benefits, working conditions, citizenship requirements, and overtime.
We are subject to Federal Trade Commission (FTC) regulation and various state laws regulating the offer and sale of franchises. The laws of several states also regulate substantive aspects of the franchisor-franchisee relationship. The FTC requires us to furnish to prospective franchisees a franchise disclosure document containing prescribed information. State laws that regulate the franchisor-franchisee relationship presently exist in a significant number of states and bills have been introduced in Congress from time to time that would provide for federal regulation of the U.S. franchisor-franchisee relationship in certain respects if such bills were enacted. The state laws often limit, among other things, the duration and scope of non-competition provisions and the ability of a franchisor to terminate or refuse to renew a franchise. Some foreign countries also have disclosure requirements and other laws regulating franchising and the franchisor-franchisee relationship. National, state and local government regulations or initiatives, including health care legislation, living wage, menu labeling, legislation imposing joint employer liability or other current or proposed regulations and increases in minimum wage rates affect Papa Johns as well as others within the restaurant industry. As we expand internationally, we are subject to applicable laws in each jurisdiction where franchised units are established.
Trademarks, Copyrights and Domain Names
Our intellectual property rights are a significant part of our business. We have registered and continue to maintain federal registrations through the United States Patent and Trademark Office (the USPTO) for the marks PAPA JOHNS, PIZZA PAPA JOHNS & Design (our logo), BETTER INGREDIENTS. BETTER PIZZA., PIZZA PAPA JOHNS BETTER INGREDIENTS. BETTER PIZZA. & Design, and PAPA REWARDS. We also own federal registrations through the USPTO for several ancillary marks, principally advertising slogans. Moreover, we have registrations for and/or have applied for PIZZA PAPA JOHNS & Design in more than 100 foreign countries and the European Community, in addition to international registrations for PAPA JOHNS and PIZZA PAPA JOHNS BETTER INGREDIENTS. BETTER PIZZA. & Design in various foreign countries. From time to time, we are made aware of the use by other persons in certain geographical areas of names and marks that are the same as or substantially similar to our marks. It is our policy to pursue registration of our marks whenever possible and to vigorously oppose any infringement of our marks.
We hold copyrights in authored works used in our business, including advertisements, packaging, training, and promotional materials. In addition, we have registered and maintain Internet domain names, including papajohns.com.
Employees
As of December 28, 2014, we employed approximately 21,700 persons, of whom approximately 18,900 were restaurant team members, approximately 900 were restaurant management personnel, approximately 700 were corporate personnel and approximately 1,200 were QC Center and Preferred personnel. Most restaurant team members work part-time and are paid on an hourly basis. None of our team members are covered by a collective bargaining agreement. We consider our team member relations to be good.
We are subject to various risks that could have a negative effect on our business, financial condition and results of operations. These risks could cause actual operating results to differ from those expressed in certain forward looking statements contained in this Form 10-K as well as in other Company communications. Before you invest in our securities you should carefully consider these risk factors together with all other information included in this Form 10-K and our other publicly filed documents.
We face competition from other food industry competitors, and our results of operations can be negatively impacted by the actions of one or more of our competitors.
The QSR Pizza category and the restaurant industry in general are intensely competitive, and there are many well-established competitors with substantially greater financial and other resources than the Papa Johns system. Some of these competitors have been in existence for a substantially longer period than Papa Johns and may be better established in the markets where restaurants operated by us or our franchisees are, or may be, located. Demographic trends, traffic patterns, the type, number and location of competing restaurants, and changes in pricing or other marketing initiatives or promotional strategies, including new product and concept developments, by one or more of our major competitors, can have a rapid and adverse impact on our sales and earnings and our system-wide restaurant operations. Such an adverse impact could also be caused or exacerbated if our marketing incentives or new product offerings are not effective.
In addition to more established competitors, we also face competition from new competitors and concepts such as fast casual pizza concepts. The emergence or growth of new competitors may negatively impact our sales and our system-wide restaurant operations.
Changes in consumer preferences or discretionary consumer spending could adversely impact our results.
Changes in consumer preferences and trends (for example, changes in dietary preferences that could cause consumers to avoid pizza in favor of foods that are perceived as more healthful, lower-calorie or otherwise based on their nutritional content) or preferences for a dining experience such as fast casual pizza concepts, could adversely affect our restaurant business. Also, our success depends to a significant extent on numerous factors affecting consumer confidence and discretionary consumer income and spending and adverse economic conditions such as high levels of unemployment, high fuel and energy costs and reduced access to credit. Such factors could cause consumers to spend less on food or shift to lower-priced products, and adverse changes in these factors could reduce sales or inhibit our ability to increase pricing, either of which could materially adversely affect our results of operations.
Food safety and quality concerns may negatively impact our business and profitability.
Incidents or reports of food- or water-borne illness, or other food safety issues, food contamination or tampering, employee hygiene and cleanliness failures, improper employee conduct, or presence of communicable disease at our restaurants, QC Centers, or suppliers could lead to product liability or other claims. Such incidents or reports could negatively affect our brand and reputation and a decrease in customer traffic resulting from these reports could negatively impact our revenues and profits. Similar incidents or reports occurring at quick service restaurants unrelated to us could likewise create negative publicity, which could negatively impact consumer behavior towards us.
We rely on our domestic and international suppliers, as do our franchisees, to provide quality ingredients and to comply with applicable laws and industry standards. A failure of one of our domestic or international suppliers to meet our quality standards, or meet domestic or international food industry
standards, could result in a disruption in our supply chain and negatively impact our brand and our business and profitability. Our inability to manage an event such as a product recall or product related litigation could also cause our results to suffer.
Our success depends on the differentiation of our brand and maintaining the value and quality reputation of our brand, and any damage to consumers perception of our brand may negatively impact our business and profitability.
Our results depend upon our ability to differentiate our brand and our reputation for quality. Our brand has been highly rated in U.S. surveys, and we strive to build the value of our brand as we develop international markets. The value of our brand and demand for our products could be damaged by incidents that harm consumer perceptions of the Company and our brand, such as product recalls, food safety issues, privacy breaches, or negative publicity. Any actions that persons endorsing our products may take, whether or not associated with our products, which harm their or our reputations could also harm our brand image and our reputation. Social media can be used to promote adverse consumer perceptions with significantly greater speed and scope than traditional media outlets. As a result, the value of our brand and the demand for our products could be damaged and have an adverse effect on our financial results.
We may not be able to execute our strategy or achieve our planned growth targets, which could negatively impact our business and our financial results.
Our growth strategy depends on the Companys and our franchisees ability to open new restaurants and to operate them on a profitable basis. We may fail to attract new qualified franchisees or existing franchisees may close underperforming locations. Planned growth targets and the ability to operate new and existing restaurants profitably are affected by economic, regulatory and competitive conditions and consumer buying habits. Increased commodity or operating costs, including, but not limited to, employee compensation and benefits or insurance costs, could slow the rate of new store openings or increase the number of store closings. Our business is susceptible to adverse changes in local, national and global economic conditions, which could make it difficult for us to meet our growth targets. Additionally, we or our franchisees may face challenges securing financing, finding suitable store locations at acceptable terms or securing required domestic or foreign government permits and approvals.
Our franchisees remain dependent on the availability of financing to remodel or renovate existing locations, upgrade systems, or construct and open new restaurants. From time to time, the Company may be required to provide financing to certain franchisees and prospective franchisees in order to mitigate store closings, allow new units to open, or complete required upgrades. If we are unable or unwilling to provide such financing, we may experience slower than expected new restaurant openings and our results of operations may be adversely impacted. To the extent we provide financing to franchisees in domestic and international markets, our results could be negatively impacted by the credit performance of our franchisee loans.
If we do not meet our growth targets or the expectations of the market for net restaurant openings or our other strategic objectives, our stock price could decline.
Our results of operations and the operating results of our franchisees may be adversely impacted by increases in the cost of food ingredients and other commodities.
We are exposed to ongoing commodity volatility, and an increase in the cost, or sustained high levels of the cost, of cheese or other commodities could adversely affect the profitability of our system-wide restaurant operations, particularly if we are unable to increase the selling price of our products to offset increased costs. Cheese, historically representing 35% to 40% of our food cost, and other commodities
can be subject to significant cost fluctuations due to weather, availability, global demand and other factors that are beyond our control. Additionally, increases in fuel, utility, and insurance costs could adversely affect the profitability of our restaurant and QC Center businesses. Most of the factors affecting costs are beyond our control, and we may not be able to pass along these costs to our customers or franchisees. Our domestic franchisees buy substantially all of their food products from our QC Center business.
Our dependence on a sole supplier or a limited number of suppliers for some ingredients could result in disruptions to our business.
Domestic restaurants purchase substantially all food and related products from our QC Centers. We are dependent on Leprino Foods Dairy Products Company (Leprino) as our sole supplier for cheese, one of our key ingredients. Leprino, one of the major pizza category suppliers of cheese in the United States, currently supplies all of our cheese domestically and substantially all of our cheese internationally. While we have no other sole sources of supply, we do source other key ingredients from a limited number of suppliers. Alternative sources of supply of cheese or other key ingredients may not be available on a timely basis or be available on terms as favorable to us as under our current arrangements. Our corporate and franchised restaurants could also be harmed by a prolonged disruption in the supply of products from or to our QC Centers due to weather, crop disease, labor dispute, interruption of service by carriers and other events beyond our control. Insolvency of key suppliers could also cause similar business interruptions and negatively impact our business.
Changes in purchasing practices by our domestic franchisees could harm our commissary business.
Although our domestic franchisees currently purchase substantially all food products from our QC Centers, they are only required to purchase from our QC Centers tomato sauce, dough and other items we may designate as proprietary or integral to our system. Any changes in purchasing practices by domestic franchisees, such as seeking alternative approved suppliers of ingredients or other food products, could adversely affect the financial results of our QC Centers and the Company.
Our international operations are subject to increased risks and other factors that may make it more difficult to achieve or maintain profitability or meet planned growth rates.
Our international operations could be negatively impacted by changes in international economic, political and health conditions in the countries in which the Company or our franchisees operate. In addition, there are risks associated with differing business and social cultures and consumer preferences, diverse and sometimes uncertain or unstable government regulations and structures, limited availability and high cost of suitable restaurant locations, and difficulties in sourcing and importing high-quality ingredients and other commodities in a cost-effective manner. In addition, our international operations are subject to additional factors, including import and export controls, compliance with anti-corruption and other foreign laws, volatility in foreign currency rates, changes in tax laws, difficulties enforcing intellectual property and contract rights in foreign jurisdictions, and the imposition of increased or new tariffs or trade barriers. We intend to continue to expand internationally, which would make the risks related to our international operations more significant over time.
We are subject to numerous laws and regulations governing our workforce and our operations. Changes in these laws, including health care legislation and minimum wage increases or additional laws and regulations could increase costs for our system-wide operations.
We operate in an increasingly complex regulatory environment, and the cost of regulatory compliance is increasing. Failure to comply with applicable U.S. and international labor, health care, food, safety, anti-bribery and corruption, consumer and other laws, may result in civil and criminal liability, damages, fines
and penalties. This could harm our reputation, limit our ability to grow and adversely affect our financial performance.
Domestic system-wide restaurant and QC Center operations are subject to federal and state laws governing such matters as wages, benefits, working conditions, citizenship requirements and overtime. A significant number of hourly personnel are paid at rates closely related to the federal and state minimum wage requirements. Accordingly, further increases in the federal minimum wage or the enactment of additional state or local minimum wage increases above federal wage rates would increase labor costs for our domestic system-wide operations. Additionally, social media may be used to foster negative perceptions of employment in our industry and promote strikes or boycotts. Local government agencies have also implemented ordinances that restrict the sale of certain food or drink products. Compliance with additional government mandates, including menu labeling requirements, or activist or union activity, could increase costs and be harmful to system-wide restaurant sales.
The Affordable Care Act, enacted in 2010, requires employers such as us to provide health insurance for all qualifying employees or pay penalties for not providing coverage. We, like other industry competitors, are complying with the law and are providing more extensive health benefits to employees than we had previously provided, and are subsidizing a larger portion of their insurance premiums. These additional costs could negatively impact our operational results.
Our expansion into emerging or under-penetrated domestic and international markets may present increased risks.
Any or all of the risks listed above could be even more harmful to the financial viability of our franchisees or could significantly impact the operating results of the Company in markets where we have a Company-owned presence, such as China. A decline in or failure to improve financial performance could lead to reduced new restaurant openings or unit closings at greater than anticipated levels and therefore adversely impact our ability to achieve our targets for growth and results of operations as well as have a negative impact on market share.
Our business and brand may be harmed should the services of our Founder, John Schnatter, as Chief Executive Officer, President, Chairman or brand spokesman terminate for any reason. Failure to effectively execute succession planning could harm our Company and brand.
John H. Schnatter, our Founder, Chairman, President and Chief Executive Officer, does not serve under an employment agreement, and we do not maintain key man life insurance on Mr. Schnatter. We also depend on the continued availability of Mr. Schnatters image and his services as spokesman in our advertising and promotion materials. While we have entered into a license agreement with Mr. Schnatter related to the use of certain intellectual property related to his name, likeness and image, our business and brand may be harmed if Mr. Schnatters services were not available to the Company for any reason or the reputation of Mr. Schnatter were negatively impacted. In addition, failure to effectively execute succession planning could harm our Company and brand.
We may be required to resort to litigation to protect our intellectual property rights, which could negatively affect our results of operations.
We depend on the Papa Johns brand name and rely on a combination of trademarks, service marks, copyrights, and similar intellectual property rights to protect and promote our brand. We believe the success of our business depends on our continued ability to exclusively use our existing marks to increase brand awareness and further develop our brand, both domestically and abroad. If we are not able to adequately protect our intellectual property rights, we may be required to resort to litigation to prevent consumer confusion and preserve our brands high-quality reputation. Litigation could result in high
costs and diversion of resources, which could negatively affect our results of operations, regardless of the outcome.
Disruptions of our critical business or information technology systems could harm our ability to conduct normal business.
We rely heavily on information systems, including digital ordering solutions, through which approximately half of our domestic sales originate. We also rely heavily on point-of-sale processing in our restaurants for data collection and payment systems for the collection of cash, credit and debit card transactions, and other processes and procedures. Our ability to efficiently and effectively manage our business depends on the reliability and capacity of these technology systems. In addition, we anticipate that consumers will continue to have more options to place orders digitally, both domestically and internationally. Our failure to adequately invest in new technology, particularly our digital ordering capabilities, could cause us to lose our competitive advantage and have an adverse effect on our results.
Our systems could be damaged or interrupted by power loss through various technological failures or acts of God. In particular, we may experience occasional interruptions of our digital ordering solutions, which make online ordering unavailable or slow to respond, negatively impacting sales and the experience of our customers. If our digital ordering solutions do not perform with adequate speed, our customers may be less inclined to return to our digital ordering solutions, as frequently or at all. If our systems do not operate properly, we may not be able to fully realize the significant investment we have made in these systems, and we may need to upgrade or replace these systems, which could require additional material capital investment from us and our franchisees. Part of our technology infrastructure, such as our FOCUS point of sale system, is specifically designed for us and our operational systems, which could cause unexpected costs, delays or inefficiencies when infrastructure upgrades are needed or prolonged and widespread technological difficulties occur. Significant portions of our technology infrastructure are provided by third parties, and the performance of these systems is largely beyond our control. Failure of our third-party systems, and backup systems, to adequately perform, particularly as our online sales grow, could harm our business and the satisfaction of our customers. In addition, we may not have or be able to obtain adequate protection or insurance to mitigate the risks of these events or compensate for losses related to these events, which could damage our business and reputation and be expensive and difficult to remedy or repair.
We may incur significant costs or loss of sales and consumer confidence resulting from a security breach of our critical systems, network sites or service providers, including a breach of confidential customer information from our digital ordering business.
We are subject to a number of privacy and data protection laws and regulations. Our business requires the collection and retention of large volumes of internal and customer data, including credit card data and other personally identifiable information of our employees and customers housed in the various information systems we use. Constantly changing cyber security threats pose risks to the security of our systems and networks, and the confidentiality of our data. As techniques used in cyber attacks evolve, we may not be able to timely detect threats or anticipate and implement security measures. The integrity and protection of that customer, employee and Company data is critical to us. The failure to prevent fraud or security breaches or to adequately invest in data security could harm our business and revenues due to the reputational damage to our brand. Such a breach could also result in litigation, regulatory actions, penalties, and other significant costs to us and have a material adverse effect on our financial results.
Changes in privacy law could adversely affect our ability to market our products effectively.
We rely on a variety of direct marketing techniques, including email, text messages and postal mailings. Any future restrictions in federal, state or foreign laws regarding marketing and solicitation or
international data protection laws that govern these activities could adversely affect the continuing effectiveness of email, text messages and postal mailing techniques and could force changes in our marketing strategies. If this occurs, we may need to develop alternative marketing strategies, which could impact the amount and timing of our revenues.
We have been and will continue to be subject to various types of litigation, including collective and class action litigation, which could subject us to significant damages or other remedies.
We and our restaurant industry competitors are subject to the risk of litigation from various parties, including vendors, customers, franchisees, state and federal agencies, and employees. We are involved in a number of lawsuits, claims, investigations, and proceedings consisting of intellectual property, employment, consumer, commercial and other matters arising in the ordinary course of business. We are currently a defendant in cases containing collective and class action allegations. Plaintiffs in these types of lawsuits often seek recovery of very large or indeterminate amounts, and the magnitude of the potential loss and defense costs relating to such lawsuits may not be accurately estimated. Litigation trends involving the relationship between franchisors and franchisees, personal injury claims, employment law and intellectual property may increase our cost of doing business. We evaluate all of the claims and proceedings involving us to assess the expected outcome, and where possible, we estimate the amount of potential losses to us. In many cases, particularly collective and class action cases, we may not be able to estimate the amount of potential losses and/or our estimates may prove to be insufficient. These assessments are made by management based on the information available at the time made and require the use of a significant amount of judgment, and actual outcomes or losses may materially differ. Regardless of whether any claims against us are valid, or whether we are ultimately held liable, such litigation may be expensive to defend and may divert resources away from our operations and negatively impact earnings. Further, we may not be able to obtain adequate insurance to protect us from these types of litigation matters or extraordinary business losses.
If pending legal matters, including the class action litigation described in Note 17 of Notes to Consolidated Financial Statements, result in costs in excess of amounts we have accrued, our results of operations could be materially impacted.
We may be subject to impairment charges.
Impairment charges are possible due to the nature and timing of decisions we make about underperforming assets or markets, or if previously opened or acquired restaurants perform below our expectations, particularly in our Company-owned China market. This could result in a decrease in our reported asset value and reduction in our net income.
Item 1B. Unresolved Staff Comments
None.
As of December 28, 2014, there were 4,663 Papa Johns restaurants system-wide. The following tables provide the locations of our restaurants. We define North America as the United States and Canada and domestic as the contiguous United States.
North America Restaurants:
|
|
|
Company |
|
Franchised |
|
Total |
|
|
Alabama |
|
|
|
82 |
|
82 |
|
|
Alaska |
|
|
|
9 |
|
9 |
|
|
Arizona |
|
39 |
|
40 |
|
79 |
|
|
Arkansas |
|
|
|
25 |
|
25 |
|
|
California |
|
|
|
214 |
|
214 |
|
|
Colorado |
|
25 |
|
25 |
|
50 |
|
|
Connecticut |
|
|
|
17 |
|
17 |
|
|
Delaware |
|
|
|
15 |
|
15 |
|
|
District of Columbia |
|
|
|
10 |
|
10 |
|
|
Florida |
|
47 |
|
229 |
|
276 |
|
|
Georgia |
|
94 |
|
62 |
|
156 |
|
|
Hawaii |
|
|
|
14 |
|
14 |
|
|
Idaho |
|
|
|
12 |
|
12 |
|
|
Illinois |
|
8 |
|
107 |
|
115 |
|
|
Indiana |
|
41 |
|
89 |
|
130 |
|
|
Iowa |
|
|
|
25 |
|
25 |
|
|
Kansas |
|
13 |
|
22 |
|
35 |
|
|
Kentucky |
|
43 |
|
69 |
|
112 |
|
|
Louisiana |
|
|
|
61 |
|
61 |
|
|
Maine |
|
|
|
7 |
|
7 |
|
|
Maryland |
|
60 |
|
41 |
|
101 |
|
|
Massachusetts |
|
|
|
24 |
|
24 |
|
|
Michigan |
|
|
|
50 |
|
50 |
|
|
Minnesota |
|
35 |
|
17 |
|
52 |
|
|
Mississippi |
|
|
|
32 |
|
32 |
|
|
Missouri |
|
42 |
|
30 |
|
72 |
|
|
Montana |
|
|
|
9 |
|
9 |
|
|
Nebraska |
|
|
|
16 |
|
16 |
|
|
Nevada |
|
|
|
21 |
|
21 |
|
|
New Hampshire |
|
|
|
3 |
|
3 |
|
|
New Jersey |
|
|
|
72 |
|
72 |
|
|
New Mexico |
|
|
|
17 |
|
17 |
|
|
New York |
|
|
|
108 |
|
108 |
|
|
North Carolina |
|
91 |
|
78 |
|
169 |
|
|
North Dakota |
|
|
|
5 |
|
5 |
|
|
Ohio |
|
|
|
160 |
|
160 |
|
|
Oklahoma |
|
|
|
31 |
|
31 |
|
|
Oregon |
|
|
|
15 |
|
15 |
|
|
Pennsylvania |
|
|
|
95 |
|
95 |
|
|
Rhode Island |
|
|
|
5 |
|
5 |
|
|
South Carolina |
|
7 |
|
62 |
|
69 |
|
|
South Dakota |
|
|
|
11 |
|
11 |
|
|
Tennessee |
|
31 |
|
82 |
|
113 |
|
|
Texas |
|
84 |
|
184 |
|
268 |
|
North America Restaurants (continued):
|
|
|
Company |
|
Franchised |
|
Total |
|
|
Utah |
|
|
|
32 |
|
32 |
|
|
Vermont |
|
|
|
1 |
|
1 |
|
|
Virginia |
|
26 |
|
116 |
|
142 |
|
|
Washington |
|
|
|
56 |
|
56 |
|
|
West Virginia |
|
|
|
21 |
|
21 |
|
|
Wisconsin |
|
|
|
27 |
|
27 |
|
|
Wyoming |
|
|
|
9 |
|
9 |
|
|
Total U.S. Papa Johns Restaurants |
|
686 |
|
2,564 |
|
3,250 |
|
|
Canada |
|
|
|
90 |
|
90 |
|
|
Total North America Papa Johns Restaurants |
|
686 |
|
2,654 |
|
3,340 |
|
|
|
|
|
|
|
|
|
|
|
International Restaurants: |
|
|
|
|
|
|
|
|
|
|
|
|
|
|
|
|
|
Azerbaijan |
|
|
|
3 |
|
3 |
|
|
Bahrain |
|
|
|
20 |
|
20 |
|
|
Cayman Islands |
|
|
|
2 |
|
2 |
|
|
Chile |
|
|
|
32 |
|
32 |
|
|
China |
|
49 |
|
183 |
|
232 |
|
|
Colombia |
|
|
|
21 |
|
21 |
|
|
Costa Rica |
|
|
|
20 |
|
20 |
|
|
Cyprus |
|
|
|
7 |
|
7 |
|
|
Dominican Republic |
|
|
|
12 |
|
12 |
|
|
Ecuador |
|
|
|
15 |
|
15 |
|
|
Egypt |
|
|
|
25 |
|
25 |
|
|
El Salvador |
|
|
|
16 |
|
16 |
|
|
Guam |
|
|
|
3 |
|
3 |
|
|
Guatemala |
|
|
|
7 |
|
7 |
|
|
India |
|
|
|
46 |
|
46 |
|
|
Ireland |
|
|
|
56 |
|
56 |
|
|
Jordan |
|
|
|
8 |
|
8 |
|
|
Kuwait |
|
|
|
29 |
|
29 |
|
|
Malaysia |
|
|
|
32 |
|
32 |
|
|
Mexico |
|
|
|
80 |
|
80 |
|
|
Nicaragua |
|
|
|
3 |
|
3 |
|
|
Oman |
|
|
|
9 |
|
9 |
|
|
Panama |
|
|
|
7 |
|
7 |
|
|
Peru |
|
|
|
28 |
|
28 |
|
|
Philippines |
|
|
|
16 |
|
16 |
|
|
Puerto Rico |
|
|
|
19 |
|
19 |
|
|
Qatar |
|
|
|
17 |
|
17 |
|
|
Russia |
|
|
|
65 |
|
65 |
|
|
Saudi Arabia |
|
|
|
22 |
|
22 |
|
|
South Korea |
|
|
|
91 |
|
91 |
|
|
Trinidad |
|
|
|
6 |
|
6 |
|
|
Turkey |
|
|
|
17 |
|
17 |
|
|
United Arab Emirates |
|
|
|
38 |
|
38 |
|
|
United Kingdom |
|
|
|
282 |
|
282 |
|
|
Venezuela |
|
|
|
37 |
|
37 |
|
|
Total International Papa Johns Restaurants |
|
49 |
|
1,274 |
|
1,323 |
|
Note: Company-owned Papa Johns restaurants include restaurants owned by majority-owned subsidiaries. There were 200 such restaurants at December 28, 2014 (25 in Colorado, 30 in Maryland, 35 in Minnesota, 84 in Texas, and 26 in Virginia).
Most Papa Johns Company-owned restaurants are located in leased space. The initial term of most domestic restaurant leases is generally five years with most leases providing for one or more options to renew for at least one additional term. Generally, the leases are triple net leases, which require us to pay all or a portion of the cost of insurance, taxes and utilities. Additionally, we lease our Company-owned restaurant sites in Beijing and North China. At December 28, 2014, we leased and subleased to franchisees in the United Kingdom 204 of the 282 franchised Papa Johns restaurant sites. The initial lease terms on the franchised sites in the United Kingdom are generally 10 to 15 years. The initial lease terms of the franchisee subleases are generally five to ten years. In connection with the 2006 sale of our former Perfect Pizza operations in the United Kingdom, we remain contingently liable for payment under 25 lease arrangements, primarily associated with Perfect Pizza restaurant sites.
Seven of our ten domestic QC Centers are located in leased space, including the following locations: Raleigh, NC; Denver, CO; Phoenix, AZ; Des Moines, IA; Portland, OR; Pittsburgh, PA; and Cranbury, NJ. Our remaining three locations are in buildings we own, located in: Orlando, FL; Dallas, TX; and Louisville, KY. Additionally, our corporate headquarters and our printing operations are located in Louisville, KY in buildings owned by us. Internationally, we own a full-service QC Center in the United Kingdom and lease office space near London. We also lease our QC Centers and office space in Beijing, China and Mexico City, Mexico.
The Company is involved in a number of lawsuits, claims, investigations and proceedings, including those specifically identified below, consisting of intellectual property, employment, consumer, commercial and other matters arising in the ordinary course of business. In accordance with Accounting Standards Codification (ASC) 450, Contingencies, the Company has made accruals with respect to these matters, where appropriate, which are reflected in the Companys financial statements. We review these provisions at least quarterly and adjust these provisions to reflect the impact of negotiations, settlements, rulings, advice of legal counsel and other information and events pertaining to a particular case.
Perrin v. Papa Johns International, Inc. and Papa Johns USA, Inc. is a conditionally certified collective action filed in August 2009 in the United States District Court, Eastern District of Missouri, alleging that delivery drivers were not reimbursed for mileage and expenses in accordance with the Fair Labor Standards Act. Approximately 3,900 drivers out of a potential class size of 28,800 have opted into the action. In late December 2013, the District Court granted a motion for class certification in five additional states, which added approximately 15,000 plaintiffs to the case. The trial is scheduled for August 2015.
We intend to vigorously defend against all claims in this lawsuit. However, given the inherent uncertainties of litigation, the outcome of this case cannot be predicted and the amount of any potential loss cannot be reasonably estimated. A negative outcome in this case could have a material adverse effect on the Company.
Item 4. Mine Safety Disclosures
None.
EXECUTIVE OFFICERS OF THE REGISTRANT
Set forth below are the current executive officers of Papa Johns:
|
Name |
|
Age (a) |
|
Position |
|
First Elected |
|
|
|
|
|
|
|
|
|
John H. Schnatter |
|
53 |
|
Founder, Chairman, President and Chief Executive Officer |
|
1985 |
|
|
|
|
|
|
|
|
|
Robert C. Kraut |
|
55 |
|
Senior Vice President and Chief Marketing Officer |
|
2013 |
|
|
|
|
|
|
|
|
|
Timothy C. OHern |
|
51 |
|
Senior Vice President and Chief Development Officer |
|
2005 |
|
|
|
|
|
|
|
|
|
Steve M. Ritchie |
|
40 |
|
Senior Vice President and Chief Operating Officer |
|
2012 |
|
|
|
|
|
|
|
|
|
Lance F. Tucker |
|
45 |
|
Senior Vice President, Chief Financial Officer, Chief Administrative Officer and Treasurer |
|
2011 |
(a) Ages are as of January 1, 2015.
John H. Schnatter created the Papa Johns concept and started operations in 1984. He currently serves as Founder, Chairman, President and Chief Executive Officer. He previously served as Interim Chief Executive Officer from December 2008 to April 2009, Executive Chairman of the Company from 2005 until May 2007, as Chairman of the Board and Chief Executive Officer from 1990 until 2005, and as President from 1985 to 1990, from 2001 until 2005 and from 2014 to present.
Robert C. Kraut was appointed Senior Vice President and Chief Marketing Officer in October 2013. From 2010 until June 2013, Mr. Kraut served as Senior Vice President of Brand Marketing and Advertising at Arbys Restaurant Group. From 2006 until 2009, Mr. Kraut served as Vice President of Marketing Communications for Pizza Hut, Inc. Before joining Pizza Hut, Mr. Kraut held various marketing and advertising positions at General Motors.
Timothy C. OHern was appointed Senior Vice President and Chief Development Officer in July 2012. He previously served as Senior Vice President, Development since June 2009, a position he previously held from 2005 until 2007. From 2002 until 2005 and from 2007 until 2009, he managed the operations of a Papa Johns franchisee in which he has an ownership interest. Prior to his departure from Papa Johns in 2002, Mr. OHern held various positions, including Vice President of Global Development from February 2001 to 2002, Vice President of U.S. Development from March 1997 to February 2001, Director of Franchise Development from December 1996 to March 1997 and Construction Manager from November 1995 to December 1996. He has been a franchisee since 1993.
Steve M. Ritchie was appointed Senior Vice President and Chief Operating Officer in May 2014 and has served as a Senior Vice President since May 2013. Mr. Ritchie has served in various capacities of increasing responsibility over Global Operations & Global Operations Support and Training since July 2010. Since 2006, he also has served as a franchise owner and operator of multiple units in the Companys Midwest Division.
Lance F. Tucker was appointed Chief Administrative Officer in July 2012 and Chief Financial Officer and Treasurer in February 2011. Mr. Tucker previously held the positions of Chief of Staff and Senior Vice President, Strategic Planning from June 2010 to February 2011, after serving as Chief of Staff and Vice President, Strategic Planning since June 2009. Mr. Tucker was previously employed by the Company from 1994 to 1999 working in its finance department. From 2003 to 2009, Mr. Tucker served as Chief Financial Officer of Evergreen Real Estate, a company owned by John Schnatter. Mr. Tucker is a licensed Certified Public Accountant.
There are no family relationships among our executive officers and other key personnel.
Item 5. Market for Registrants Common Equity, Related Stockholder Matters and Issuer Purchases of Equity Securities
Our common stock trades on The NASDAQ Global Select Market tier of The NASDAQ Stock Market under the symbol PZZA. As of February 17, 2015, there were 804 record holders of common stock. However, there are significantly more beneficial owners of our common stock than there are record holders. The following table sets forth, for the quarters indicated, the high and low sales prices of our common stock, as reported by The NASDAQ Stock Market, and dividends declared per common share. The 2013 sales prices have been adjusted to reflect a two-for-one split of the Companys outstanding shares of stock. The stock split was effected in the form of a stock dividend and entitled each shareholder of record at the close of business on December 12, 2013 to receive one additional share for every outstanding share of stock held on the record date. The stock dividend of approximately 21.0 million shares of stock was distributed on December 27, 2013.
|
2014 |
|
High |
|
Low |
|
Dividends |
| |||
|
First Quarter |
|
$ |
55.00 |
|
$ |
44.95 |
|
$ |
0.125 |
|
|
Second Quarter |
|
52.72 |
|
40.00 |
|
0.125 |
| |||
|
Third Quarter |
|
45.50 |
|
37.32 |
|
0.140 |
| |||
|
Fourth Quarter |
|
57.00 |
|
39.49 |
|
0.140 |
| |||
|
|
|
|
|
|
|
|
| |||
|
2013 |
|
High |
|
Low |
|
Dividends |
| |||
|
First Quarter |
|
$ |
31.16 |
|
$ |
24.94 |
|
$ |
|
|
|
Second Quarter |
|
33.61 |
|
29.50 |
|
|
| |||
|
Third Quarter |
|
36.20 |
|
32.78 |
|
0.125 |
| |||
|
Fourth Quarter |
|
46.12 |
|
33.88 |
|
0.125 |
| |||
Our Board of Directors declared a quarterly dividend of $0.14 per share on January 28, 2015 that was payable on February 20, 2015 to shareholders of record at the close of business on February 9, 2015.
We anticipate continuing the payment of quarterly cash dividends. The actual amount of such dividends is subject to declaration by our Board of Directors and will depend upon future earnings, results of operations, capital requirements, our financial condition and other relevant factors. There can be no assurance that the Company will continue to pay quarterly cash dividends.
Our Board of Directors has authorized the repurchase of up to $1.325 billion of common stock under a share repurchase program that began December 9, 1999, and expires December 31, 2015. Through December 28, 2014, a total of 105.6 million shares with an aggregate cost of $1.2 billion and an average price of $11.32 per share have been repurchased under this program. Subsequent to year-end, we acquired an additional 224,000 shares at an aggregate cost of $13.6 million. Approximately $115.9 million remained available under the Companys share repurchase program as of February 17, 2015.
The following table summarizes our repurchase activity by fiscal period during the fourth quarter ended December 28, 2014 (in thousands, except per share amounts):
|
|
|
|
|
|
|
Total Number |
|
Maximum Dollar |
| ||
|
|
|
Total |
|
Average |
|
of Shares Purchased |
|
Value of Shares |
| ||
|
|
|
Number |
|
Price |
|
as Part of Publicly |
|
that May Yet Be |
| ||
|
|
|
of Shares |
|
Paid per |
|
Announced Plans |
|
Purchased Under the |
| ||
|
Fiscal Period |
|
Purchased |
|
Share |
|
or Programs |
|
Plans or Programs |
| ||
|
|
|
|
|
|
|
|
|
|
| ||
|
09/29/2014 - 10/26/2014 |
|
221 |
|
$ |
40.92 |
|
105,329 |
|
$ |
143,671 |
|
|
10/27/2014 - 11/23/2014 |
|
133 |
|
$ |
46.85 |
|
105,462 |
|
$ |
137,470 |
|
|
11/24/2014 - 12/28/2014 |
|
148 |
|
$ |
53.93 |
|
105,610 |
|
$ |
129,474 |
|
The Company utilizes a written trading plan under Rule 10b5-1 under the Securities Exchange Act of 1934, as amended, from time to time to facilitate the repurchase of shares of our common stock under this share repurchase program. There can be no assurance that we will repurchase shares of our common stock either through a Rule 10b5-1 trading plan or otherwise.
Stock Performance Graph
The following performance graph compares the cumulative shareholder return of the Companys common stock for the five-year period between December 27, 2009 and December 28, 2014 to (i) the NASDAQ Stock Market (U.S.) Index and (ii) a group of the Companys peers consisting of U.S. companies listed on NASDAQ with standard industry classification (SIC) codes 5800-5899 (eating and drinking places). Management believes the companies included in this peer group appropriately reflect the scope of the Companys operations and match the competitive market in which the Company operates. The graph assumes the value of the investments in the Companys common stock and in each index was $100 on December 27, 2009, and that all dividends were reinvested.
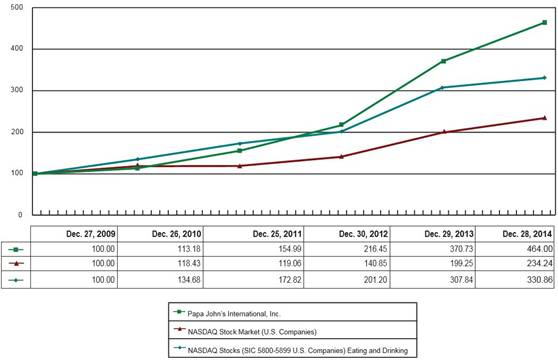
Item 6. Selected Financial Data
The selected financial data presented for each of the fiscal years in the five-year period ended December 28, 2014, were derived from our audited consolidated financial statements. The selected financial data below should be read in conjunction with Managements Discussion and Analysis of Financial Condition and Results of Operations and the Consolidated Financial Statements and Notes thereto included in Item 7 and Item 8, respectively, of this Form 10-K.
|
|
|
Year Ended (1) |
| |||||||||||||
|
|
|
Dec. 28, |
|
Dec. 29, |
|
Dec. 30, |
|
Dec. 25, |
|
Dec. 26, |
| |||||
|
(In thousands, except per share data) |
|
2014 |
|
2013 |
|
2012 |
|
2011 |
|
2010 |
| |||||
|
|
|
52 weeks |
|
52 weeks |
|
53 weeks |
|
52 weeks |
|
52 weeks |
| |||||
|
Income Statement Data |
|
|
|
|
|
|
|
|
|
|
| |||||
|
North America revenues: |
|
|
|
|
|
|
|
|
|
|
| |||||
|
Domestic Company-owned restaurant sales |
|
$ |
701,854 |
|
$ |
635,317 |
|
$ |
592,203 |
|
$ |
525,841 |
|
$ |
503,272 |
|
|
Franchise royalties (2) |
|
89,443 |
|
81,692 |
|
79,567 |
|
73,694 |
|
69,631 |
| |||||
|
Franchise and development fees |
|
726 |
|
1,181 |
|
806 |
|
722 |
|
610 |
| |||||
|
Domestic commissary sales |
|
629,492 |
|
578,870 |
|
545,924 |
|
508,155 |
|
454,506 |
| |||||
|
Other sales |
|
74,179 |
|
53,322 |
|
51,223 |
|
50,912 |
|
51,951 |
| |||||
|
International revenues: |
|
|
|
|
|
|
|
|
|
|
| |||||
|
Royalties and franchise and development fees (3) |
|
25,730 |
|
21,979 |
|
19,881 |
|
16,327 |
|
13,265 |
| |||||
|
Restaurant and commissary sales (4) |
|
76,725 |
|
66,661 |
|
53,049 |
|
42,231 |
|
33,162 |
| |||||
|
Total revenues |
|
1,598,149 |
|
1,439,022 |
|
1,342,653 |
|
1,217,882 |
|
1,126,397 |
| |||||
|
Operating income (5) |
|
117,630 |
|
106,503 |
|
99,807 |
|
87,017 |
|
86,744 |
| |||||
|
Investment income |
|
702 |
|
589 |
|
750 |
|
755 |
|
875 |
| |||||
|
Interest expense |
|
(4,077 |
) |
(983 |
) |
(2,162 |
) |
(2,981 |
) |
(4,309 |
) | |||||
|
Income before income taxes |
|
114,255 |
|
106,109 |
|
98,395 |
|
84,791 |
|
83,310 |
| |||||
|
Income tax expense |
|
36,558 |
|
33,130 |
|
32,393 |
|
26,324 |
|
27,247 |
| |||||
|
Net income before attribution to noncontrolling interests |
|
77,697 |
|
72,979 |
|
66,002 |
|
58,467 |
|
56,063 |
| |||||
|
Income attributable to noncontrolling interests (6) |
|
(4,382 |
) |
(3,442 |
) |
(4,342 |
) |
(3,732 |
) |
(3,485 |
) | |||||
|
Net income attributable to the Company |
|
$ |
73,315 |
|
$ |
69,537 |
|
$ |
61,660 |
|
$ |
54,735 |
|
$ |
52,578 |
|
|
|
|
|
|
|
|
|
|
|
|
|
| |||||
|
Net income attributable to common shareholders |
|
$ |
72,869 |
|
$ |
68,497 |
|
$ |
61,660 |
|
$ |
54,735 |
|
$ |
52,578 |
|
|
Basic earnings per common share |
|
$ |
1.78 |
|
$ |
1.58 |
|
$ |
1.31 |
|
$ |
1.09 |
|
$ |
1.00 |
|
|
Earnings per common share - assuming dilution |
|
$ |
1.75 |
|
$ |
1.55 |
|
$ |
1.29 |
|
$ |
1.08 |
|
$ |
0.99 |
|
|
Basic weighted average common shares outstanding |
|
40,960 |
|
43,387 |
|
46,916 |
|
50,086 |
|
52,656 |
| |||||
|
Diluted weighted average common shares outstanding |
|
41,718 |
|
44,243 |
|
47,810 |
|
50,620 |
|
52,936 |
| |||||
|
Dividends declared per common share |
|
$ |
0.53 |
|
$ |
0.25 |
|
$ |
|
|
$ |
|
|
$ |
|
|
|
|
|
|
|
|
|
|
|
|
|
|
| |||||
|
Balance Sheet Data |
|
|
|
|
|
|
|
|
|
|
| |||||
|
Total assets |
|
$ |
512,803 |
|
$ |
464,291 |
|
$ |
438,408 |
|
$ |
390,382 |
|
$ |
417,492 |
|
|
Total debt |
|
230,451 |
|
157,900 |
|
88,258 |
|
51,489 |
|
99,017 |
| |||||
|
Mandatorily redeemable noncontrolling interests (7) |
|
|
|
10,786 |
|
11,837 |
|
11,065 |
|
9,972 |
| |||||
|
Redeemable noncontrolling interests |
|
8,555 |
|
7,024 |
|
6,380 |
|
3,965 |
|
3,512 |
| |||||
|
Total stockholders equity |
|
98,715 |
|
138,184 |
|
181,514 |
|
205,647 |
|
195,608 |
| |||||
(1) We operate on a 52-53 week fiscal year ending on the last Sunday of December of each year. The 2012 fiscal year consisted of 53 weeks and all other years above consisted of 52 weeks. The additional week resulted in additional revenues of approximately $21.5 million and additional income before income taxes of approximately $4.1 million, or $0.05 per diluted share for 2012.
(2) North America franchise royalties were derived from franchised restaurant sales of $2.04 billion in 2014, $1.91 billion in 2013, $1.85 billion in 2012 ($1.82 billion on a 52 week basis), $1.71 billion in 2011 and $1.62 billion in 2010.
(3) International royalties were derived from franchised restaurant sales of $553.0 million in 2014, $460.0 million in 2013, $388.4 million in 2012 ($379.4 million on a 52 week basis), $320.0 million in 2011 and $258.8 million in 2010.
(4) Restaurant sales for international Company-owned restaurants were $23.7 million in 2014, $22.7 million in 2013, $16.2 million in 2012, $12.4 million in 2011 and $11.0 million in 2010.
(5) The operating results include the consolidation of BIBP Commodities, Inc. (BIBP), which increased operating income approximately $21.4 million in 2010 (including a reduction in BIBPs cost of sales of $14.2 million associated with PJFSs agreement to pay BIBP for past cheese purchases an amount equal to its accumulated deficit). BIBP had break-even results in 2011 and was dissolved in 2011.
(6) Represents the noncontrolling interests allocation of income for our joint venture arrangements.
(7) Mandatorily redeemable noncontrolling interest is included in other long-term liabilities in the consolidated balance sheets. See Note 6 of Notes to Consolidated Financial Statements for additional information.
Item 7. Managements Discussion and Analysis of Financial Condition and Results of Operations
Introduction
Papa Johns International, Inc. (referred to as the Company, Papa Johns or in the first person notations of we, us and our) began operations in 1984. At December 28, 2014, there were 4,663 Papa Johns restaurants in operation, consisting of 735 Company-owned and 3,928 franchised restaurants. Our revenues are principally derived from retail sales of pizza and other food and beverage products to the general public by Company-owned restaurants, franchise royalties, sales of franchise and development rights, sales to franchisees of food and paper products, printing and promotional items, risk management services, and information systems and related services used in their operations.
New unit openings in 2014 were 388 as compared to 386 in 2013 and 368 in 2012 and unit closings in 2014 were 153 as compared to 121 in 2013 and 88 in 2012. We expect net unit growth of approximately 220 to 250 units during 2015 of which approximately 75% will be international locations. Our expansion strategy is to cluster restaurants in targeted markets, thereby increasing consumer awareness and enabling us to take advantage of operational, distribution and advertising efficiencies.
We continue to generate strong sales in our North America Company-owned restaurants in a very competitive environment. Average annual Company-owned sales for our most recent domestic comparable restaurant base were $1.06 million for 2014 (52-week year), compared to $988,000 for 2013 (52-week year) and $953,000 for 2012 (53-week year). Average sales volumes in new markets are generally lower than in those markets in which we have established a significant market position. The comparable sales for domestic Company-owned restaurants increased 8.2% in 2014, 6.6% in 2013 and 5.6% in 2012. Comparable sales represents sales generated by restaurants open for the entire twelve-month period reported.
We are pleased with the ongoing growth in both our North America and international franchise restaurant sales. The comparable sales for North America franchised units increased 6.2% in 2014, 3.1% in 2013 and 2.9% in 2012. The comparable sales for International franchised units increased 7.8% in 2014, 7.5% in 2013 and 7.1% in 2012.
We strive to obtain high-quality restaurant sites with good access and visibility, and to enhance the appearance and quality of our restaurants. We believe these factors improve our image and brand awareness. The average cash investment for the 11 domestic traditional Company-owned restaurants opened during 2014 was approximately $283,000, compared to the $280,000 investment for the 13 domestic traditional units opened in 2013, exclusive of land and any tenant improvement allowances we received. We also opened two Company-owned restaurants in China, with an average investment cost of approximately $290,000 which compares to $225,000 for the 11 restaurants opened in 2013.
Approximately 43% to 46% of our domestic revenues in each of the last three years were derived from sales to franchisees of various items including food and paper products, printing and promotional items, risk
management services and information systems equipment, including the FOCUS Point of Sales system, and software and related services. We believe that in addition to supporting both Company and franchised profitability and growth, these activities contribute to product quality and consistency throughout the Papa Johns system.
Critical Accounting Policies and Estimates
The results of operations are based on our consolidated financial statements, which were prepared in conformity with accounting principles generally accepted in the United States (GAAP). The preparation of consolidated financial statements requires management to select accounting policies for critical accounting areas as well as estimates and assumptions that affect the amounts reported in the consolidated financial statements. The Companys significant accounting policies are more fully described in Note 2 of Notes to Consolidated Financial Statements. Significant changes in assumptions and/or conditions in our critical accounting policies could materially impact the operating results. We have identified the following accounting policies and related judgments as critical to understanding the results of our operations:
Allowance for Doubtful Accounts and Notes Receivable
We establish reserves for uncollectible accounts and notes receivable based on overall receivable aging levels and a specific evaluation of accounts and notes for franchisees and other customers with known financial difficulties. Balances are charged off against the allowance after recovery efforts have ceased.
Noncontrolling Interests
The Company has the following four joint ventures in which there are noncontrolling interests as of December 28, 2014:
|
Joint Venture |
|
Redemption Feature |
|
Location within the |
|
Recorded value |
|
|
|
|
|
|
|
|
|
Star Papa, LP |
|
Redeemable |
|
Temporary equity |
|
Carrying value |
|
PJ Denver, LLC |
|
Redeemable |
|
Temporary equity |
|
Redemption value |
|
Colonels Limited, LLC |
|
No redemption feature |
|
Permanent equity |
|
Carrying value |
|
PJ Minnesota, LLC |
|
No redemption feature |
|
Permanent equity |
|
Carrying value |
Consolidated net income is required to be reported separately at amounts attributable to both the parent and the noncontrolling interest. Disclosures are required to clearly identify and distinguish between the interests of the parent company and the interests of the noncontrolling owners, including a disclosure on the face of the consolidated statements of income attributable to the noncontrolling interest holder.
See Note 6 of Notes to Consolidated Financial Statements for additional information.
Stock Based Compensation
Compensation expense for equity grants is estimated on the grant date, net of projected forfeitures and is recognized over the vesting period (generally in equal installments over three years). Restricted stock is valued based on the market price of the Companys shares on the date of grant. Stock options are valued using a Black-Scholes option pricing model.
Our specific assumptions for estimating the fair value of options include the following:
|
|
|
2014 |
|
2013 |
|
2012 |
|
|
|
|
|
|
|
|
|
|
|
Assumptions (weighted average): |
|
|
|
|
|
|
|
|
Risk-free interest rate |
|
1.8 |
% |
1.1 |
% |
1.1 |
% |
|
Expected dividend yield |
|
1.0 |
% |
0.1 |
% |
0.0 |
% |
|
Expected volatility |
|
35.7 |
% |
37.5 |
% |
37.8 |
% |
|
Expected term (in years) |
|
6.0 |
|
6.0 |
|
6.0 |
|
The risk-free interest rate for the periods within the contractual life of an option is based on the U.S. Treasury yield curve in effect at the time of grant. The expected dividend yield was estimated as the annual dividend divided by the market price of the Companys shares on the date of grant. Expected volatility was estimated by using the Companys historical share price volatility for a period similar to the expected life of the option. See Note 18 of Notes to Consolidated Financial Statements for additional information.
Intangible Assets Goodwill
We evaluate goodwill annually in the fourth quarter or whenever we identify certain triggering events or circumstances that would more-likely-than-not reduce the fair value of a reporting unit below its carrying amount. Such tests are completed separately with respect to the goodwill of each of our reporting units, which includes our domestic Company-owned restaurants, China and the United Kingdom (PJUK). We may perform a qualitative assessment or move directly to the quantitative assessment for any reporting unit in any period if we believe that it is more efficient or if impairment indicators exist.
We elected to perform the two-step quantitative assessment for all reporting units in 2014.
Our domestic Company-owned restaurants fair value calculation considered both an income approach and a market approach and our China and United Kingdom fair value calculations considered an income approach. The income approach used projected net cash flows, with various growth assumptions, over a ten-year discrete period and a terminal value, which were discounted using appropriate rates. The selected discount rate considered the risk and nature of each reporting units cash flow and the rates of return market participants would require to invest their capital in the reporting unit. In determining the fair value from a market approach, we considered earnings before interest, taxes, depreciation and amortization (EBITDA) multiples that a potential buyer would pay based on third-party transactions in similar markets.
The results of our quantitative assessments indicated the fair values significantly exceeded the carrying amounts. Subsequent to completing our annual quantitative goodwill impairment tests, no indications of impairment were identified.
Insurance Reserves
Our insurance programs for workers compensation, owned and non-owned automobiles, general liability, property, and health insurance coverage provided to our employees are funded by the Company up to certain retention levels. Losses are accrued based upon undiscounted estimates of the aggregate retained liability for claims incurred using certain third-party actuarial projections and our claims loss experience. The estimated insurance claims losses could be significantly affected should the frequency or ultimate cost of claims differ significantly from historical trends used to estimate the insurance reserves recorded by the Company. See Note 12 of Notes to Consolidated Financial Statements for additional information.
Deferred Income Tax Accounts and Tax Reserves
Papa Johns is subject to income taxes in the United States and several foreign jurisdictions. Significant judgment is required in determining Papa Johns provision for income taxes and the related assets and liabilities. The provision for income taxes includes income taxes paid, currently payable or receivable and those deferred.
Deferred tax assets and liabilities are determined based on differences between financial reporting and tax basis of assets and liabilities, and are measured using enacted tax rates and laws that are expected to be in effect when the differences reverse. Deferred tax assets are also recognized for the estimated future effects of tax loss carryforwards. The effect on deferred taxes of changes in tax rates is recognized in the period in which the new tax rate is enacted. Valuation allowances are established when necessary on a jurisdictional basis to reduce deferred tax assets to the amounts we expect to realize. As of December 28, 2014, we had a net deferred income tax liability of approximately $10.0 million.
Tax authorities periodically audit the Company. We record reserves and related interest and penalties for identified exposures as income tax expense. We evaluate these issues and adjust for events, such as statute of limitations expirations, court rulings or audit settlements, which may impact our ultimate payment for such exposures. We recognized increases in income tax expense of $117,000 in 2014 and $305,000 in 2012 and a decrease in income tax expense of $909,000 in 2013 associated with the finalization of certain income tax matters. See Note 15 of Notes to Consolidated Financial Statements for additional information.
Fiscal Year
The Company follows a fiscal year ending on the last Sunday of December, generally consisting of 52 weeks made up of four 13-week quarters. The 13-week quarters consist of two four-week periods followed by one five-week period. Our 2014 and 2013 fiscal years consisted of 52 weeks while our 2012 fiscal year consisted of 53 weeks, including a six-week period in the fourth quarter. The additional week in 2012 resulted in additional revenues of approximately $21.5 million and additional income before income taxes of $4.1 million, or $0.05 per diluted common share.
Two-for-One Stock Split
The Company completed a two-for-one stock split of the Companys outstanding shares of stock in December 2013 effected in the form of a stock dividend. Shareholders of record on December 12, 2013 received one additional share for each outstanding share of stock held on the record date. The stock dividend was distributed effective December 27, 2013. All share and per-share amounts have been adjusted to reflect the stock split.
FOCUS System
The Company is implementing a new, proprietary point-of-sale system, which we refer to as FOCUS, in substantially all domestic system-wide restaurants. As of December 28, 2014, we had installed FOCUS in almost 75% of our domestic restaurants, including all Company-owned restaurants and almost 1,600 franchised restaurants. Substantial completion is expected to occur by the end of the first quarter of 2015.
The costs related to implementing FOCUS decreased income before income taxes by approximately $3.7 million in 2014, or a $0.06 negative impact on diluted earnings per share, as compared to 2013. FOCUS had the following impact on our consolidated statement of income for the fiscal year ended December 28, 2014 (in thousands):
|
|
|
Year Ended |
| |
|
|
|
Dec. 28, |
| |
|
|
|
2014 |
| |
|
|
|
|
| |
|
Franchise royalties (a) |
|
$ |
(405 |
) |
|
Other sales (b) |
|
20,143 |
| |
|
Other operating expenses (c) |
|
(20,629 |
) | |
|
Depreciation and amortization (d) |
|
(2,834 |
) | |
|
Net decrease in income before income taxes |
|
$ |
(3,725 |
) |
|
|
|
|
| |
|
Diluted earnings per common share |
|
$ |
(0.06 |
) |
(a) Incentive program tied to franchisee rollout of FOCUS.
(b) Represents revenues for equipment installed at domestic franchised restaurants.
(c) Includes cost of sales associated with equipment installed at franchised restaurants and other costs to support the rollout of the program.
(d) Includes depreciation expense for both the capitalized software and for equipment installed at Company-owned restaurants which are being depreciated over five to seven years.
As part of the rollout, we have partnered with a third party to offer a financing option for this system to our franchisees. The arrangement with the third party requires us to offer a guarantee for the loans. The term of these loans will be five years or less and will require us to perform under the guarantee when a franchisee has a late payment in excess of 60 days. The guarantee is limited to the greater of 10% of all loans or 100% of all loans that have higher risk profiles. Higher risk profiles are determined based on pre-established criteria including length of time in business, credit rating, and other factors. We have the ability to decline funding on higher risk loans.
Items Impacting Comparability; Non-GAAP Measures
The following table reconciles our financial results as reported under GAAP to certain non-GAAP measures. We present these non-GAAP measures to adjust for certain items which we believe impact the comparability of our results of operations.
|
|
|
Year Ended |
| |||||||
|
|
|
Dec. 28, |
|
Dec. 29, |
|
Dec. 30, |
| |||
|
(In thousands, except per share amounts) |
|
2014 |
|
2013 |
|
2012 |
| |||
|
|
|
|
|
|
|
|
| |||
|
Total revenues, as reported |
|
$ |
1,598,149 |
|
$ |
1,439,022 |
|
$ |
1,342,653 |
|
|
53rd week of operations (a) |
|
|
|
|
|
(21,500 |
) | |||
|
Total revenues, as adjusted |
|
$ |
1,598,149 |
|
$ |
1,439,022 |
|
$ |
1,321,153 |
|
|
|
|
|
|
|
|
|
| |||
|
Income before income taxes, as reported |
|
$ |
114,255 |
|
$ |
106,109 |
|
$ |
98,395 |
|
|
53rd week of operations (a) |
|
|
|
|
|
(4,145 |
) | |||
|
Incentive Contribution (b) |
|
(1,000 |
) |
(1,000 |
) |
2,971 |
| |||
|
Income before income taxes, as adjusted |
|
$ |
113,255 |
|
$ |
105,109 |
|
$ |
97,221 |
|
|
|
|
|
|
|
|
|
| |||
|
Net income, as reported |
|
$ |
73,315 |
|
$ |
69,537 |
|
$ |
61,660 |
|
|
53rd week of operations (a) |
|
|
|
|
|
(2,634 |
) | |||
|
Incentive Contribution (b) |
|
(680 |
) |
(660 |
) |
1,955 |
| |||
|
Net income, as adjusted |
|
$ |
72,635 |
|
$ |
68,877 |
|
$ |
60,981 |
|
|
|
|
|
|
|
|
|
| |||
|
Earnings per diluted common share, as reported |
|
$ |
1.75 |
|
$ |
1.55 |
|
$ |
1.29 |
|
|
53rd week of operations (a) |
|
|
|
|
|
(0.05 |
) | |||
|
Incentive Contribution (b) |
|
(0.02 |
) |
(0.02 |
) |
0.04 |
| |||
|
Earnings per diluted common share, as adjusted |
|
$ |
1.73 |
|
$ |
1.53 |
|
$ |
1.28 |
|
(a) The Company follows a fiscal year ending on the last Sunday of December, generally consisting of 52 weeks made up of four 13-week quarters. In 2012, the Companys fiscal year consisted of 53 weeks, with the additional week added to the fourth quarter (14 weeks) results. The 2012 impact of the 53rd week on income before income taxes was an increase of $4.1 million, or $0.05 earnings per diluted common share.
(b) In connection with a new multi-year supplier agreement, the Company received a $5.0 million supplier marketing payment in 2012. The Company is recognizing the supplier marketing payment evenly as income over the five-year term of the agreement ($1.0 million per year). In 2012, the Company contributed the supplier marketing payment to the Papa Johns Marketing Fund (PJMF), an unconsolidated nonstock corporation designed to operate at break even for the purpose of designing and administering advertising and promotional programs for all participating domestic restaurants. The Companys contribution to PJMF was fully expensed in 2012.
PJMF elected to distribute the $5.0 million supplier marketing payment to the domestic system as advertising credits in 2012. Our domestic Company-owned restaurants portion of the advertising credits resulted in an increase in income before income taxes of approximately $1.0 million in 2012.
The overall impact of these transactions described above, which are collectively defined as the Incentive Contribution, was an increase in income before income taxes of approximately $1.0 million in each of 2014 and 2013 (or an increase in diluted earnings per common share of approximately $0.02 in each year) and a reduction in income before income taxes of approximately $3.0 million in 2012 (or a reduction to diluted earnings per share of approximately $0.04).
The non-GAAP results shown above, which exclude the items impacting comparability, should not be construed as a substitute for or a better indicator of the Companys performance than the Companys GAAP results. Management believes presenting the financial information without these items is important for purposes of comparison to prior year results and analyzing each segments operating results. In addition, management uses these non-GAAP measures to allocate resources, and analyze trends and underlying operating performance. Annual cash bonuses, and certain long-term incentive programs for various levels of management, were based on financial measures that excluded the Incentive Contribution. See Results of Operations for further analysis regarding the impact of these items.
In addition, we present free cash flow in this report, which is a non-GAAP measure. We define free cash flow as net cash provided by operating activities (from the consolidated statements of cash flows) less the purchases of property and equipment. We view free cash flow as an important measure because it is one factor that management uses in determining the amount of cash available for discretionary investment. Free cash flow is not a term defined by GAAP, and as a result, our measure of free cash flow might not be comparable to similarly titled measures used by other companies. Free cash flow should not be construed as a substitute for or a better indicator of our performance than the Companys GAAP measures. See Liquidity and Capital Resources for a reconciliation of free cash flow to the most directly comparable GAAP measure.
The presentation of the non-GAAP measures in this report is made alongside the most directly comparable GAAP measures.
Percentage Relationships and Restaurant Data and Unit Progression
The following tables set forth the percentage relationship to total revenues, unless otherwise indicated, of certain income statement data, and certain restaurant data for the years indicated:
|
|
|
Year Ended (1) |
| ||||
|
|
|
Dec. 28, |
|
Dec. 29, |
|
Dec. 30, |
|
|
|
|
2014 |
|
2013 |
|
2012 |
|
|
|
|
52 weeks |
|
52 weeks |
|
53 weeks |
|
|
Income Statement Data: |
|
|
|
|
|
|
|
|
North America revenues: |
|
|
|
|
|
|
|
|
Domestic Company-owned restaurant sales |
|
43.9 |
% |
44.2 |
% |
44.1 |
% |
|
Franchise royalties |
|
5.6 |
|
5.7 |
|
5.9 |
|
|
Franchise and development fees |
|
0.1 |
|
0.1 |
|
0.1 |
|
|
Domestic commissary sales |
|
39.4 |
|
40.2 |
|
40.7 |
|
|
Other sales |
|
4.6 |
|
3.7 |
|
3.8 |
|
|
International revenues: |
|
|
|
|
|
|
|
|
Royalties and franchise and development fees |
|
1.6 |
|
1.5 |
|
1.5 |
|
|
Restaurant and commissary sales |
|
4.8 |
|
4.6 |
|
3.9 |
|
|
Total revenues |
|
100.0 |
|
100.0 |
|
100.0 |
|
|
Costs and expenses: |
|
|
|
|
|
|
|
|
Domestic Company-owned restaurant cost of sales (2) |
|
25.0 |
|
24.6 |
|
23.2 |
|
|
Domestic Company-owned restaurant operating expenses (2) |
|
56.5 |
|
56.9 |
|
57.1 |
|
|
Domestic commissary cost of sales (3) |
|
78.3 |
|
77.5 |
|
78.1 |
|
|
Domestic commissary operating expenses (3) |
|
14.6 |
|
14.8 |
|
14.2 |
|
|
Other operating expenses (4) |
|
95.8 |
|
90.0 |
|
88.7 |
|
|
International restaurant and commissary expenses (5) |
|
83.0 |
|
84.9 |
|
84.6 |
|
|
General and administrative expenses |
|
8.8 |
|
9.3 |
|
9.8 |
|
|
Other general expenses |
|
0.5 |
|
0.5 |
|
0.6 |
|
|
Depreciation and amortization |
|
2.5 |
|
2.4 |
|
2.4 |
|
|
Total costs and expenses |
|
92.6 |
|
92.6 |
|
92.6 |
|
|
Operating income |
|
7.4 |
|
7.4 |
|
7.4 |
|
|
Net interest expense |
|
(0.2 |
) |
(0.1 |
) |
(0.1 |
) |
|
Income before income taxes |
|
7.2 |
|
7.3 |
|
7.3 |
|
|
Income tax expense |
|
2.3 |
|
2.3 |
|
2.4 |
|
|
Net income before attribution to noncontrolling interests |
|
4.9 |
|
5.0 |
|
4.9 |
|
|
Income attributable to noncontrolling interests |
|
(0.3 |
) |
(0.2 |
) |
(0.3 |
) |
|
Net income attributable to the Company |
|
4.6 |
% |
4.8 |
% |
4.6 |
% |
|
|
|
Year Ended (1) |
| |||||||
|
|
|
Dec. 28, |
|
Dec. 29, |
|
Dec. 30, |
| |||
|
|
|
2014 |
|
2013 |
|
2012 |
| |||
|
|
|
52 weeks |
|
52 weeks |
|
53 weeks |
| |||
|
Restaurant Data: |
|
|
|
|
|
|
| |||
|
Percentage increase in comparable domestic Company-owned restaurant sales (6) |
|
8.2 |
% |
6.6 |
% |
5.6 |
% | |||
|
Number of domestic Company-owned restaurants included in the most recent full years comparable restaurant base |
|
646 |
|
633 |
|
615 |
| |||
|
Average sales for domestic Company-owned restaurants included in the most recent comparable restaurant base |
|
$ |
1,064,000 |
|
$ |
988,000 |
|
$ |
953,000 |
|
|
|
|
|
|
|
|
|
| |||
|
Papa Johns Restaurant Progression: |
|
|
|
|
|
|
| |||
|
North America Company-owned: |
|
|
|
|
|
|
| |||
|
Beginning of period |
|
665 |
|
648 |
|
598 |
| |||
|
Opened |
|
12 |
|
19 |
|
8 |
| |||
|
Closed |
|
(4 |
) |
(2 |
) |
(3 |
) | |||
|
Acquired from franchisees |
|
13 |
|
|
|
57 |
| |||
|
Sold to franchisees |
|
|
|
|
|
(12 |
) | |||
|
End of period |
|
686 |
|
665 |
|
648 |
| |||
|
International Company-owned: |
|
|
|
|
|
|
| |||
|
Beginning of period |
|
58 |
|
48 |
|
30 |
| |||
|
Opened |
|
2 |
|
11 |
|
20 |
| |||
|
Closed |
|
(7 |
) |
(1 |
) |
(2 |
) | |||
|
Sold to franchisees |
|
(4 |
) |
|
|
|
| |||
|
End of period |
|
49 |
|
58 |
|
48 |
| |||
|
North America franchised: |
|
|
|
|
|
|
| |||
|
Beginning of period |
|
2,621 |
|
2,556 |
|
2,463 |
| |||
|
Opened |
|
132 |
|
152 |
|
182 |
| |||
|
Closed |
|
(86 |
) |
(87 |
) |
(44 |
) | |||
|
Acquired from Company |
|
|
|
|
|
12 |
| |||
|
Sold to Company |
|
(13 |
) |
|
|
(57 |
) | |||
|
End of period |
|
2,654 |
|
2,621 |
|
2,556 |
| |||
|
International franchised: |
|
|
|
|
|
|
| |||
|
Beginning of period |
|
1,084 |
|
911 |
|
792 |
| |||
|
Opened |
|
242 |
|
204 |
|
158 |
| |||
|
Closed |
|
(56 |
) |
(31 |
) |
(39 |
) | |||
|
Acquired from Company |
|
4 |
|
|
|
|
| |||
|
End of period |
|
1,274 |
|
1,084 |
|
911 |
| |||
|
Total Papa Johns restaurants - end of period |
|
4,663 |
|
4,428 |
|
4,163 |
| |||
(1) We operate on a 52-53 week fiscal year ending on the last Sunday of December of each year. The 2014 and 2013 fiscal years consisted of 52 weeks and the 2012 fiscal year consisted of 53 weeks. The additional week in 2012 resulted in additional revenues of approximately $21.5 million and additional income before income taxes of approximately $4.1 million, or $0.05 per diluted common share.
(2) As a percentage of domestic Company-owned restaurant sales.
(3) As a percentage of domestic commissary sales.
(4) As a percentage of other sales.
(5) As a percentage of international restaurant and commissary sales.
(6) Includes only Company-owned restaurants open throughout the periods being compared.
Results of Operations
2014 Compared to 2013
Discussion of Revenues. Consolidated revenues increased $159.1 million, or 11.1%, to $1.60 billion in 2014, compared to $1.44 billion in 2013. Revenues are summarized in the following table on a reporting segment basis.
|
|
|
Year Ended |
|
Increase |
|
Increase |
| |||||
|
|
|
Dec. 28, |
|
Dec. 29, |
|
(decrease) |
|
(decrease) |
| |||
|
(In thousands) |
|
2014 |
|
2013 |
|
$ |
|
% |
| |||
|
|
|
|
|
|
|
|
|
|
| |||
|
North America Revenues: |
|
|
|
|
|
|
|
|
| |||
|
Domestic Company-owned restaurant sales |
|
$ |
701,854 |
|
$ |
635,317 |
|
$ |
66,537 |
|
10.5 |
% |
|
Franchise royalties |
|
89,443 |
|
81,692 |
|
7,751 |
|
9.5 |
% | |||
|
Franchise and development fees |
|
726 |
|
1,181 |
|
(455 |
) |
-38.5 |
% | |||
|
Domestic commissary sales |
|
629,492 |
|
578,870 |
|
50,622 |
|
8.7 |
% | |||
|
Other sales |
|
74,179 |
|
53,322 |
|
20,857 |
|
39.1 |
% | |||
|
|
|
|
|
|
|
|
|
|
| |||
|
International Revenues: |
|
|
|
|
|
|
|
|
| |||
|
Royalties and franchise and development fees |
|
25,730 |
|
21,979 |
|
3,751 |
|
17.1 |
% | |||
|
Restaurant and commissary sales |
|
76,725 |
|
66,661 |
|
10,064 |
|
15.1 |
% | |||
|
Total Revenues |
|
$ |
1,598,149 |
|
$ |
1,439,022 |
|
$ |
159,127 |
|
11.1 |
% |
The increase in revenues in 2014 compared to 2013 was primarily due to the following:
· Domestic Company-owned restaurant sales increased $66.5 million, or 10.5% primarily due to an 8.2% increase in comparable sales and a 2.6% increase in equivalent units. Equivalent units represents the number of restaurants open at the beginning of a given period, adjusted for restaurants opened, closed, acquired or sold during the period on a weighted average basis.
· North America franchise royalties increased $7.8 million, or 9.5% primarily due to a 6.2% increase in comparable sales and a reduced level of performance-based royalty incentives.
· Domestic commissary sales increased $50.6 million, or 8.7%, primarily due to increases in the prices of certain commodities (primarily cheese and meats), higher sales volumes, and higher overall margins.
· Other sales increased $20.9 million, or 39.1%, primarily due to FOCUS equipment sales to franchisees. See the FOCUS System section above for additional information.
· International royalties and franchise and development fees increased $3.8 million or 17.1% primarily due to an increase in the number of restaurants and a 7.8% increase in comparable sales, calculated on a constant dollar basis.
· International restaurant and commissary sales increased $10.1 million, or 15.1%, primarily due to an increase in commissary revenues, particularly in the United Kingdom, with increases in units and higher comparable sales. This was somewhat offset by the 2013 year including an additional month of revenues at our China Company-owned operations as we changed the reporting cycle in the fourth quarter of 2013 to no longer consolidate the results one month in arrears. The impact of this change resulted in incremental revenues of $2.1 million in 2013.
Discussion of Operating Results
Our income before income taxes totaled $114.3 million in 2014, as compared to $106.1 million in 2013, an increase of approximately $8.1 million. Income before income taxes is summarized in the following table on a reporting segment basis:
|
|
|
Year Ended |
|
|
| |||||
|
|
|
Dec. 28, |
|
Dec. 29, |
|
Increase |
| |||
|
(In thousands) |
|
2014 |
|
2013 |
|
(Decrease) |
| |||
|
|
|
|
|
|
|
|
| |||
|
Domestic Company-owned restaurants |
|
$ |
40,969 |
|
$ |
34,590 |
|
$ |
6,379 |
|
|
Domestic commissaries |
|
39,317 |
|
37,804 |
|
1,513 |
| |||
|
North America franchising |
|
77,009 |
|
70,201 |
|
6,808 |
| |||
|
International |
|
7,250 |
|
2,803 |
|
4,447 |
| |||
|
All others |
|
(9 |
) |
3,490 |
|
(3,499 |
) | |||
|
Unallocated corporate expenses |
|
(49,440 |
) |
(41,025 |
) |
(8,415 |
) | |||
|
Elimination of intersegment profits |
|
(841 |
) |
(1,754 |
) |
913 |
| |||
|
Total income before income taxes (a) |
|
$ |
114,255 |
|
$ |
106,109 |
|
$ |
8,146 |
|
(a) Includes FOCUS system rollout costs of approximately $3.7 million in 2014. See the FOCUS System section above for additional information.
Changes in income before income taxes for 2014 in comparison to 2013 are summarized on a segment basis as follows:
· Domestic Company-owned Restaurant Segment. Domestic Company-owned restaurants income before income taxes increased $6.4 million due to the 8.2% increase in comparable sales, partially offset by higher commodities and higher automobile insurance claims costs of approximately $3.5 million. Additionally, 2014 includes depreciation expense of approximately $1.2 million associated with FOCUS equipment costs.
· Domestic Commissaries Segment. Domestic commissaries income before income taxes increased $1.5 million primarily due to higher margins and higher sales volumes, which were somewhat offset by higher workers compensation and automobile insurance claims costs of approximately $2.6 million and higher costs associated with various ongoing commissary initiatives.
· North America Franchising Segment. North America franchising income before income taxes increased approximately $6.8 million in 2014 due to the previously mentioned royalty revenue increase.
· International Segment. The international segment reported income before income taxes of approximately $7.3 million in 2014 compared to $2.8 million in 2013. The increase of $4.4 million was primarily due to an increase in units and comparable sales of 7.4%, which resulted in both higher royalties and contributed to an improvement of $3.1 million in the United Kingdom results. The favorable results were partially offset by unfavorable China Company-owned results of approximately $700,000 (losses of approximately $3.4 million in 2014 and $2.7 million in 2013). The unfavorable results were primarily due to restaurant disposition costs for 11 restaurants, which were approximately $700,000 higher in 2014. Additionally, the 2013 China results included $215,000 of incremental losses associated with the additional month of operations in the fourth quarter of 2013, as previously discussed. Based on prior experience in other underpenetrated markets, some operating losses can occur as the business is being established.
· All Others Segment. The All others segment, which primarily includes our online and mobile ordering business and our wholly-owned print and promotions subsidiary, Preferred Marketing
Solutions, decreased approximately $3.5 million. The decrease was primarily due to higher infrastructure costs to support our digital ordering business and a lower margin at our print and promotions business, primarily associated with an increased number of discounted direct mail campaigns in comparison to 2013.
· Unallocated Corporate Segment. Unallocated corporate expenses increased approximately $8.4 million. The components of unallocated corporate expenses were as follows (in thousands):
|
|
|
Year Ended |
|
Year Ended |
|
|
| |||
|
|
|
December 28, |
|
December 29, |
|
Increase |
| |||
|
|
|
2014 |
|
2013 |
|
(Decrease) |
| |||
|
|
|
|
|
|
|
|
| |||
|
General and administrative (a) |
|
$ |
38,647 |
|
$ |
34,819 |
|
$ |
3,828 |
|
|
Net interest expense (b) |
|
3,458 |
|
482 |
|
2,976 |
| |||
|
Depreciation expense |
|
7,598 |
|
6,845 |
|
753 |
| |||
|
FOCUS system rollout costs (c) |
|
1,638 |
|
|
|
1,638 |
| |||
|
Supplier marketing income (d) |
|
(1,000 |
) |
(1,000 |
) |
|
| |||
|
Other income |
|
(901 |
) |
(121 |
) |
(780 |
) | |||
|
Total unallocated corporate expenses |
|
$ |
49,440 |
|
$ |
41,025 |
|
$ |
8,415 |
|
(a) The increase in unallocated general and administrative costs was primarily due to higher legal and management incentive compensation costs, partially offset by lower travel costs.
(b) The increase in net interest expense was primarily due to a higher average outstanding debt balance with a higher effective interest rate. Additionally, 2013 included an approximate $1.1 million benefit from a decrease in the redemption value of a mandatorily redeemable noncontrolling interest in a joint venture. An amendment in the joint venture agreement during 2014 no longer requires changes in the value to be recorded in net interest.
(c) Includes depreciation expense for capitalized FOCUS software development costs and other costs to support the rollout of the program.
(d) See Items Impacting Comparability; Non-GAAP Measures for additional information.
Diluted earnings per common share were $1.75 in 2014, compared to $1.55 in 2013, an increase of $0.20, or 12.9%. Diluted earnings per common share increased $0.10 due to the 5.7% reduction in weighted average shares outstanding.
Review of Consolidated Operating Results
Revenues. Domestic Company-owned restaurant sales were $701.9 million for 2014 compared to $635.3 million for 2013. As previously noted, the 10.5% increase was primarily due to an 8.2% increase in comparable sales and a 2.6% increase in equivalent units.
North America franchise sales increased 7.1% to $2.04 billion, from $1.91 billion in 2013, as domestic franchise comparable sales increased 6.2% and equivalent units increased 1.2%. North America franchise sales are not included in our consolidated statements of income; however, our North America franchise royalty revenue is derived from these sales. North America franchise royalties were $89.4 million for 2014, representing an increase of 9.5% from 2013. As previously noted, this increase is due to the franchise comparable sales increase and a reduction in performance-based royalty incentives.
Average weekly sales for comparable units include restaurants that were open throughout the periods presented below. The comparable sales base for domestic Company-owned and North America franchised restaurants, respectively, includes restaurants acquired by the Company or divested to franchisees during the previous twelve months. Average weekly sales for non-comparable units include restaurants that were not open throughout the periods presented below and include non-traditional sites. Average weekly sales for non-traditional units not subject to continuous operation are calculated based upon actual days open.
The comparable sales base and average weekly sales for 2014 and 2013 for domestic Company-owned and North America franchised restaurants consisted of the following:
|
|
|
Year Ended |
|
Year Ended |
| ||||||||
|
|
|
December 28, 2014 |
|
December 29, 2013 |
| ||||||||
|
|
|
Domestic |
|
North |
|
Domestic |
|
North |
| ||||
|
|
|
|
|
|
|
|
|
|
| ||||
|
Total domestic units (end of period) |
|
686 |
|
2,654 |
|
665 |
|
2,621 |
| ||||
|
Equivalent units |
|
666 |
|
2,521 |
|
649 |
|
2,492 |
| ||||
|
Comparable sales base units |
|
646 |
|
2,307 |
|
633 |
|
2,263 |
| ||||
|
Comparable sales base percentage |
|
97.0 |
% |
91.5 |
% |
97.5 |
% |
90.8 |
% | ||||
|
Average weekly sales - comparable units |
|
$ |
20,451 |
|
$ |
16,031 |
|
$ |
18,995 |
|
$ |
15,171 |
|
|
Average weekly sales - total non-comparable units* |
|
$ |
14,389 |
|
$ |
10,588 |
|
$ |
12,167 |
|
$ |
10,092 |
|
|
Average weekly sales - all units |
|
$ |
20,271 |
|
$ |
15,570 |
|
$ |
18,832 |
|
$ |
14,704 |
|
*Includes 150 traditional units in 2014 and 185 in 2013 and 213 non-traditional units in 2014 and 184 in 2013.
North America franchise and development fees were approximately $700,000 in 2014, a decrease of approximately $500,000 from 2013 primarily due to lower franchise renewal fees.
Domestic commissary sales increased 8.7% to $629.5 million in 2014, from $578.9 million in the prior year. As previously discussed, the increase was primarily due to increases in the prices of certain commodities (primarily cheese and meats), higher sales volumes and higher overall margins. Our commissaries charge a fixed dollar mark-up on the cost of cheese. Cheese prices are based upon the block price, which increased to an average of $2.12 per pound in 2014 from $1.76 per pound in 2013.
Other sales increased $20.9 million to $74.2 million in 2014 primarily due to FOCUS equipment sales to franchisees. See the FOCUS System section above for additional information.
International royalties and franchise and development fees increased approximately $3.8 million primarily due to a 17.5% increase in franchised units and a comparable sales increase of 7.8%, calculated on a constant dollar basis. International franchise restaurant sales were $553.0 million in 2014, compared to $460.0 million in 2013. International franchise restaurant sales are not included in our consolidated statements of income; however, our international royalty revenue is derived from these sales.
International restaurant and commissary sales increased $10.1 million, or 15.1%, primarily due to an increase in commissary revenues from increases in units and higher comparable sales, including the United Kingdom. As previously noted, the 2013 year includes an additional month of revenues at our China Company-owned operations in the amount of $2.1 million.
Costs and Expenses. The restaurant operating margin at domestic Company-owned units was 18.5% in both 2014 and 2013 with the following differences by income statement category:
· Cost of sales was 0.4% higher as a percentage of revenues in 2014 primarily due to higher commodity costs, primarily cheese and meats, somewhat offset by a higher ticket average.
· Salaries and benefits were 0.4% lower as a percentage of sales in 2014, primarily due to the benefit of higher sales.
· Advertising and related costs as a percentage of revenues were 0.3% lower as a percentage of sales in 2014, primarily due to the benefit of higher sales.
· Occupancy costs and other restaurant operating costs, on a combined basis, were 0.3% higher as a percentage of revenues in 2014 primarily due to higher restaurant driver insurance claims costs of approximately $3.5 million.
Domestic commissary operating margin was 7.1% and 7.7% in 2014 and 2013, respectively, with the following differences by income statement category:
· Cost of sales was 0.8% higher as a percentage of revenues in 2014 primarily due to higher cheese costs, which have a fixed-dollar markup. As cheese prices are higher, food cost as a percentage of sales is higher.
· Salaries and benefits and other commissary operating expenses were 0.2% lower as a percentage of sales due to the benefit of higher sales. The costs were $6.3 million higher in 2014 primarily due to higher sales volumes, higher workers compensation and automobile insurance claims costs of $2.6 million and higher costs associated with various ongoing commissary initiatives.
Other operating expenses as a percentage of other sales were 95.8% in 2014, compared to 90.0% in 2013. The higher operating expenses were primarily due to the low margin associated with sales of FOCUS systems to franchisees, higher infrastructure costs to support our online operations and the impact of an increased number of reduced cost direct mail campaigns offered to our domestic franchised restaurants by Preferred.
International restaurant and commissary expenses were 83.0% in 2014 compared to 84.9% in 2013, as a percentage of total restaurant and commissary sales. The decrease of 1.9% is primarily due to lower operating expenses for the United Kingdom primarily due to the benefit of higher sales.
General and administrative (G&A) expenses were $140.6 million, or 8.8% of revenues for 2014, as compared to $134.2 million, or 9.3% of revenues for 2013. The decrease as a percentage of sales was primarily the result of leverage from higher sales. The increase of $6.3 million was primarily due to the following:
· Unallocated corporate G&A expenses increased primarily due to higher legal and management incentive compensation costs, partially offset by lower travel costs.
· Domestic Company-owned restaurant supervisor expenses increased, including higher bonuses from higher profits.
· International G&A costs were higher due to increased infrastructure, marketing and other support costs.
Other general expenses reflected net expense of $8.2 million in 2014, as compared to $6.7 million in 2013 as detailed below (in thousands):
|
|
|
|
|
|
|
Increase |
| |||
|
|
|
2014 |
|
2013 |
|
(Decrease) |
| |||
|
|
|
|
|
|
|
|
| |||
|
Franchise and development incentives (a) |
|
$ |
5,143 |
|
$ |
4,645 |
|
$ |
498 |
|
|
Disposition and impairment losses (b) |
|
1,870 |
|
804 |
|
1,066 |
| |||
|
Provision for uncollectible accounts and notes receivable |
|
1,113 |
|
604 |
|
509 |
| |||
|
Pre-opening restaurant costs |
|
122 |
|
458 |
|
(336 |
) | |||
|
Perfect Pizza lease obligation (c) |
|
95 |
|
305 |
|
(210 |
) | |||
|
Supplier marketing payment (d) |
|
(1,000 |
) |
(1,000 |
) |
|
| |||
|
Other expense |
|
880 |
|
857 |
|
23 |
| |||
|
Total other general expenses |
|
$ |
8,223 |
|
$ |
6,673 |
|
$ |
1,550 |
|
(a) Incentives provided to franchisees for opening restaurants.
(b) Includes higher disposition related costs of approximately $700,000 for China Company-owned restaurant closures and divestitures.
(c) The Perfect Pizza lease obligation relates to rents, taxes, insurance and other costs associated with the former Perfect Pizza operations in the United Kingdom.
(d) See Items Impacting Comparability; Non-GAAP Measures above for further information about the Incentive Contribution.
Depreciation and amortization was $40.0 million, or 2.5% of revenues for 2014, as compared to $35.1 million, or 2.4% of revenues for 2013. The increase of $4.9 million is primarily due to incremental depreciation related to both our New Jersey commissary dough production capital expenditures and our FOCUS capitalized software costs and equipment costs at Company-owned restaurants.
Net interest. Net interest expense consisted of the following (in thousands):
|
|
|
Year Ended |
| |||||||
|
|
|
Dec. 28, |
|
Dec. 29, |
|
(Increase) |
| |||
|
|
|
2014 |
|
2013 |
|
Decrease |
| |||
|
|
|
|
|
|
|
|
| |||
|
Interest expense - line of credit (a) |
|
$ |
(4,073 |
) |
$ |
(2,131 |
) |
$ |
(1,942 |
) |
|
Investment income |
|
702 |
|
589 |
|
113 |
| |||
|
Change in redemption value of mandatorily redeemable noncontrolling interest in a joint venture (b) |
|
(4 |
) |
1,148 |
|
(1,152 |
) | |||
|
Net interest (expense) income |
|
$ |
(3,375 |
) |
$ |
(394 |
) |
$ |
(2,981 |
) |
(a) The increase in interest expense was due to a higher average outstanding debt balance and a higher effective interest rate.
(b) See Notes 2 and 6 of Notes to Consolidated Financial Statements for additional information.
Income Tax Expense. Our effective income tax rate was 32.0% in 2014 compared to 31.2% in 2013. The higher tax rate in 2014 was primarily due to the prior year including favorable state tax settlements. See Note 15 of Notes to Consolidated Financial Statements for additional information.
2013 Compared to 2012
Discussion of Revenues. Consolidated revenues increased $96.4 million, or 7.2%, to $1.44 billion in 2013, compared to $1.34 billion in 2012. Revenues are summarized in the following table on a reporting segment basis. Alongside the GAAP financial statement data, we have included certain additional non-GAAP financial measures that the Company believes are important for purposes of comparing to prior
year results and analyzing each segments revenue trends. See Items Impacting Comparability; Non-GAAP Measures above for further information about our use of non-GAAP financial measures. Excluding the impact of the 53rd week of operations in 2012, which approximated $21.5 million, revenues increased 8.9%.
|
|
|
Year Ended |
|
|
|
|
|
Adjusted |
|
Adjusted |
| |||||||
|
|
|
Dec. 29, |
|
Dec. 30, |
|
|
|
53rd |
|
Increase |
|
Increase |
| |||||
|
(In thousands) |
|
2013 |
|
2012 |
|
Increase |
|
Week |
|
$ |
|
% |
| |||||
|
|
|
52 weeks |
|
53 weeks |
|
|
|
|
|
|
|
|
| |||||
|
North America Revenues: |
|
|
|
|
|
|
|
|
|
|
|
|
| |||||
|
Domestic Company-owned restaurant sales |
|
$ |
635,317 |
|
$ |
592,203 |
|
$ |
43,114 |
|
$ |
10,600 |
|
$ |
53,714 |
|
9.2 |
% |
|
Franchise royalties |
|
81,692 |
|
79,567 |
|
2,125 |
|
1,400 |
|
3,525 |
|
4.5 |
% | |||||
|
Franchise and development fees |
|
1,181 |
|
806 |
|
375 |
|
|
|
375 |
|
46.5 |
% | |||||
|
Domestic commissary sales |
|
578,870 |
|
545,924 |
|
32,946 |
|
8,500 |
|
41,446 |
|
7.7 |
% | |||||
|
Other sales |
|
53,322 |
|
51,223 |
|
2,099 |
|
200 |
|
2,299 |
|
4.5 |
% | |||||
|
|
|
|
|
|
|
|
|
|
|
|
|
|
| |||||
|
International Revenues: |
|
|
|
|
|
|
|
|
|
|
|
|
| |||||
|
Royalties and franchise and development fees |
|
21,979 |
|
19,881 |
|
2,098 |
|
150 |
|
2,248 |
|
11.4 |
% | |||||
|
Restaurant and commissary sales |
|
66,661 |
|
53,049 |
|
13,612 |
|
650 |
|
14,262 |
|
27.2 |
% | |||||
|
Total Revenues |
|
$ |
1,439,022 |
|
$ |
1,342,653 |
|
$ |
96,369 |
|
$ |
21,500 |
|
$ |
117,869 |
|
8.9 |
% |
The increase in revenues in 2013 compared to 2012 was primarily due to the following:
· Domestic Company-owned restaurant sales increased $43.1 million, or 7.3%. Excluding the $10.6 million impact of the 53rd week in 2012, sales increased $53.7 million, or 9.2%, primarily due to an increase in comparable sales of 6.6% and the net acquisition of 50 restaurants in the Denver and Minneapolis markets from a franchisee in the second quarter of 2012.
· North America franchise royalty revenues increased $2.1 million, or 2.7%. Excluding the $1.4 million impact of the 53rd week in 2012, revenues increased approximately $3.5 million, or 4.5%, due to an increase in comparable sales of 3.1% and an increase in net franchise units over the prior year. This increase was slightly offset by reduced royalties attributable to the Companys net acquisition of the 50 restaurants noted above.
· Domestic commissary sales increased $32.9 million, or 6.0%. Excluding the $8.5 million impact of the 53rd week in 2012, sales increased $41.4 million, or 7.7%, primarily due to higher commissary product volumes, primarily resulting from increases in the volume of restaurant sales, higher overall margins and increases in the prices of underlying commodities.
· International royalties and franchise and development fees increased $2.1 million or 10.6%. Excluding the $150,000 impact of the 53rd week in 2012, royalties and fees increased $2.2 million, or 11.4%. This was primarily due to an increase in units and comparable sales of 7.5%.
· International restaurant and commissary sales increased $13.6 million, or 25.7%. Excluding the $650,000 impact of the 53rd week in 2012, sales increased $14.3 million, or 27.2%. The increase was primarily due to an increase in China Company-owned restaurant sales due to an increase in units. In addition, we no longer consolidated China one month in arrears, which put China on the same reporting cycle as our Domestic operations. The inclusion of the additional month of operations in fiscal 2013 resulted in $2.1 million of incremental revenues.
Discussion of Operating Results
Our income before income taxes totaled $106.1 million in 2013, as compared to $98.4 million in 2012, an increase of approximately $7.7 million. Income before income taxes is summarized in the following table on a reporting segment basis. Alongside the GAAP financial statement data, we have included certain additional non-GAAP measures that the Company believes are important for purposes of comparing to prior year results and analyzing each segments operating results.
|
|
|
Year Ended |
|
|
|
|
|
Incentive |
|
Adjusted |
| ||||||||
|
|
|
Dec. 29, |
|
Dec. 30, |
|
Increase/ |
|
53rd |
|
Contribution |
|
Increase/ |
| ||||||
|
(In thousands) |
|
2013 |
|
2012 |
|
(Decrease) |
|
Week (a) |
|
(b) |
|
(Decrease) (c) |
| ||||||
|
|
|
52 weeks |
|
53 weeks |
|
|
|
|
|
|
|
|
| ||||||
|
|
|
|
|
|
|
|
|
|
|
|
|
|
| ||||||
|
Domestic Company-owned restaurants |
|
$ |
34,590 |
|
$ |
38,114 |
|
$ |
(3,524 |
) |
$ |
1,609 |
|
$ |
1,029 |
|
$ |
(886 |
) |
|
Domestic commissaries |
|
37,804 |
|
34,317 |
|
3,487 |
|
1,200 |
|
|
|
4,687 |
| ||||||
|
North America franchising |
|
70,201 |
|
69,332 |
|
869 |
|
1,414 |
|
|
|
2,283 |
| ||||||
|
International |
|
2,803 |
|
3,063 |
|
(260 |
) |
414 |
|
|
|
154 |
| ||||||
|
All others |
|
3,490 |
|
2,889 |
|
601 |
|
215 |
|
|
|
816 |
| ||||||
|
Unallocated corporate expenses |
|
(41,025 |
) |
(48,958 |
) |
7,933 |
|
(707 |
) |
(5,000 |
) |
2,226 |
| ||||||
|
Elimination of intersegment profits |
|
(1,754 |
) |
(362 |
) |
(1,392 |
) |
|
|
|
|
(1,392 |
) | ||||||
|
Total income before income taxes |
|
$ |
106,109 |
|
$ |
98,395 |
|
$ |
7,714 |
|
$ |
4,145 |
|
$ |
(3,971 |
) |
$ |
7,888 |
|
(a) The 53rd week of operations increased income before income taxes by approximately $4.1 million in 2012. The Adjusted Increase/ (Decrease) column eliminates the impact of the 53rd week so that the 52 weeks of 2013 can be compared to an equivalent 52 weeks in 2012.
(b) Includes the $5.0 million of expense related to the 2012 Incentive Contribution to PJMF and the related benefit of a $1.0 million advertising credit from PJMF that was received by the Domestic Company-owned restaurants. The annual amortization of the $5.0 million ($1.0 million per year) is the same in both years presented. The Adjusted Increase/ (Decrease) column eliminates the impact of the Incentive Contribution for comparability.
(c) See Items Impacting Comparability; Non-GAAP Measures previously discussed for further information. The impact of the 53rd week in 2012 substantially offset the impact of the Incentive Contribution.
Changes in income before income taxes for 2013 in comparison to 2012 are summarized on a segment basis as follows:
· Domestic Company-owned Restaurant Segment. Domestic Company-owned restaurants income before income taxes decreased $3.5 million. Excluding the 2012 impact of the 53rd week and the Incentive Contribution of approximately $2.6 million, income decreased $900,000 due to higher commodity costs of approximately $5.8 million, largely offset by incremental profits associated with higher comparable sales of 6.6%. Additionally, 2012 benefited from various supplier incentives of approximately $1.0 million.
· Domestic Commissaries Segment. Domestic commissaries income before income taxes increased $3.5 million. Excluding the impact of the 53rd week in 2012 of approximately $1.2 million, income increased $4.7 million. The increase was primarily due to higher commissary product volumes, resulting from increased restaurant sales volumes from the previously noted increase in net units and comparable sales, and higher margins. The incremental profits from higher sales were somewhat offset by higher costs of approximately $1.4 million related to bringing distribution in house at certain of our commissaries from a third party provider. In addition, we had one-time dough production start up costs at our New Jersey commissary of approximately $700,000 in 2013.
· North America Franchising Segment. North America franchising income before income taxes increased approximately $900,000 in 2013. Excluding the impact of the 53rd week in 2012 of approximately $1.4 million, income increased approximately $2.3 million due to the previously mentioned royalty revenue increase, partially offset by both an increase in incentives and a reduction in royalties attributable to the Companys net acquisition of the 50 Denver and Minneapolis restaurants.
· International Segment. The international segment reported income before income taxes of approximately $2.8 million in 2013 compared to $3.1 million in 2012, a decrease of approximately $300,000. Excluding the 2012 impact of the 53rd week of approximately $400,000, income increased approximately $150,000. This increase was primarily due to the increase in units and comparable sales of 7.5%, which provided higher royalties. Additionally, United Kingdom results improved by approximately $1.0 million due to increased units and higher comparable sales. These increases were substantially offset by higher operating losses in our Company-owned China market of approximately $2.1 million, including $215,000 of incremental losses associated with the additional month of operations in the fourth quarter of 2013, as previously discussed. The losses in the China market include a reduction in operating results at our Company-owned restaurants, primarily associated with new restaurants, as well as write off costs associated with closing one location and the disposition of certain other assets. Additionally, 2013 reflects higher infrastructure and support costs to expand in this underpenetrated market. Based on prior experience in other underpenetrated markets, some operating losses can occur as the business is being established.
· All Others Segment. The All others segment income increased approximately $600,000. Excluding the impact of the 53rd week in 2012 of approximately $200,000, income increased approximately $800,000. The increase was primarily due to an improvement in our online and mobile ordering (eCommerce) business due to higher online volumes. This increase was somewhat offset by reduced operating results at Preferred, due to reduced cost direct mail campaigns offered to our domestic franchised restaurants.
· Unallocated Corporate Segment. Unallocated corporate expenses decreased $7.9 million. Excluding the impact of the 53rd week and the Incentive Contribution in 2012 of $5.7 million, expenses decreased $2.2 million. The components of unallocated corporate expenses excluding the 53rd week and the Incentive Contribution were as follows (in thousands):
|
|
|
Year Ended |
|
Year Ended |
|
|
| |||
|
|
|
December 29, |
|
December 30, |
|
Increase |
| |||
|
|
|
2013 |
|
2012 |
|
(Decrease) |
| |||
|
|
|
|
|
|
|
|
| |||
|
General and administrative (a) |
|
$ |
34,819 |
|
$ |
36,911 |
|
$ |
(2,092 |
) |
|
Net interest expense (b) |
|
482 |
|
1,476 |
|
(994 |
) | |||
|
Depreciation expense |
|
6,845 |
|
7,193 |
|
(348 |
) | |||
|
Perfect Pizza lease obligation (c) |
|
305 |
|
(135 |
) |
440 |
| |||
|
Other (income) (d) |
|
(426 |
) |
(1,194 |
) |
768 |
| |||
|
Total unallocated corporate expenses |
|
$ |
42,025 |
|
$ |
44,251 |
|
$ |
(2,226 |
) |
(a) The decrease in unallocated general and administrative costs was primarily due to 2012 including higher legal and professional fees of approximately $3.2 million, primarily associated with the Agne litigation reserves (see Note 17 of Notes to Consolidated Financial Statements for additional information). In addition, management incentives, net of salary increases, were lower in 2013 by approximately $1.5 million. This was offset by various other general and administrative cost increases including higher travel, operators conference and information technology costs.
(b) The decrease in net interest was primarily due to a decrease in the change in redemption value of a mandatorily redeemable noncontrolling interest in a joint venture, partially offset
by higher interest costs on our line of credit due to both a higher average debt balance and a higher effective interest rate.
(c) The Perfect Pizza lease obligation relates to rents, taxes and insurance associated with the former Perfect Pizza operations in the United Kingdom. See Note 17 of Notes to Consolidated Financial Statements for additional information.
(d) Other income was lower primarily due to higher expenses associated with our online customer loyalty program.
Diluted earnings per common share were $1.55 in 2013, compared to $1.29 in 2012, an increase of $0.26, or 20.2%. As previously discussed, the 2012 benefit of the 53rd week of operations was substantially offset by the impact of the Incentive Contribution. Diluted earnings per common share increased $0.12 due to the 7.5% reduction in weighted average shares outstanding.
Review of Consolidated Operating Results
Revenues. Domestic Company-owned restaurant sales were $635.3 million for 2013 compared to $592.2 million for 2012. As previously noted, the 7.2% increase was primarily due to a 6.6% increase in comparable sales and the net acquisition of 50 restaurants in Denver and Minneapolis from a franchisee in the second quarter of 2012. Excluding the impact of the 53rd week in 2012 of $10.6 million, revenues increased 9.2%.
North America franchise sales increased 3.0% to $1.91 billion, from $1.85 billion in 2012, as domestic franchise comparable sales increased 3.1% and equivalent units increased 3.2%, somewhat offset by the impact of the 53rd week in 2012. North America franchise sales are not included in our consolidated statements of income; however, our North America franchise royalty revenue is derived from these sales. North America franchise royalties were $81.7 million for 2013, representing an increase of 2.7% from the comparable period. As previously noted, this increase is due to the franchise comparable sales increase and an increase in units. Excluding the impact of the 53rd week in 2012 of $1.4 million, royalties increased 4.5%.
The comparable sales base and average weekly sales for 2013 and 2012 for domestic Company-owned and North America franchised restaurants consisted of the following:
|
|
|
Year Ended |
|
Year Ended |
| ||||||||
|
|
|
December 29, 2013 |
|
December 30, 2012 |
| ||||||||
|
|
|
Domestic |
|
North |
|
Domestic |
|
North |
| ||||
|
|
|
|
|
|
|
|
|
|
| ||||
|
Total domestic units (end of period) |
|
665 |
|
2,621 |
|
648 |
|
2,556 |
| ||||
|
Equivalent units |
|
649 |
|
2,492 |
|
624 |
|
2,415 |
| ||||
|
Comparable sales base units |
|
633 |
|
2,263 |
|
615 |
|
2,190 |
| ||||
|
Comparable sales base percentage |
|
97.5 |
% |
90.8 |
% |
98.6 |
% |
90.7 |
% | ||||
|
Average weekly sales - comparable units |
|
$ |
18,995 |
|
$ |
15,171 |
|
$ |
17,987 |
|
$ |
14,870 |
|
|
Average weekly sales - total non-comparable units* |
|
$ |
12,167 |
|
$ |
10,092 |
|
$ |
12,604 |
|
$ |
10,389 |
|
|
Average weekly sales - all units |
|
$ |
18,832 |
|
$ |
14,704 |
|
$ |
17,908 |
|
$ |
14,453 |
|
*Includes 185 traditional units in 2013 and 215 in 2012 and 184 non-traditional units in 2013 and 158 in 2012.
North America franchise and development fees were approximately $1.2 million in 2013, or an increase of approximately $375,000 from 2012.
Domestic commissary sales increased 6.0% to $578.9 million in 2013, from $545.9 million in the prior year. Excluding the impact of the 53rd week in 2012, the increase was 7.7%. As previously discussed, the increase was primarily due to an increase in sales volumes, higher overall margins and increases in the prices of commodities. Our commissaries charge a fixed dollar mark-up on the cost of cheese. Cheese prices are based upon the block price, which increased to an average price of $1.76 per pound in 2013 from $1.69 per pound in 2012.
Other sales increased $2.1 million to $53.3 million in 2013. Excluding the impact of the 53rd week in 2012, the increase was $2.3 million, or 4.5%. The increase primarily resulted from an increase in online fees due to higher online volumes.
International franchise restaurant sales were $460.0 million in 2013, compared to $388.4 million in 2012. International franchise restaurant sales are not included in our consolidated statements of income; however, our international royalty revenue is derived from these sales. Total international revenues in our consolidated financial statements were $88.6 million for 2013 compared to $72.9 million in 2012, an increase of $15.7 million. This increase was primarily attributable to an increase in China Company-owned restaurant sales due to an increase in restaurants and an additional month of reported results, as previously discussed. Additionally, royalties and commissary sales increased due to an increase in franchised units and the 7.5% increase in comparable sales, calculated on a constant dollar basis. Our PJUK operations represented 48% of international revenues in 2013 and 51% in 2012 and our China Company-owned operations represented approximately 28% of international revenues in 2013 and 22% in 2012.
Costs and Expenses. The restaurant operating margin at domestic Company-owned units was 18.5% in 2013 compared to 19.7% in 2012 (19.5% excluding the $1.0 million advertising credit from PJMF). The decrease of 1.2% consisted of the following differences:
· Cost of sales was 1.4% higher as a percentage of sales in 2013 due to both higher commodity costs of approximately $5.8 million, including cheese, dough and meats, as well as lower national promotion pricing. 2012 also included various supplier incentives, as previously noted.
· Salaries and benefits were 0.3% lower as a percentage of sales in 2013, primarily due to the benefit of higher sales volumes.
· Advertising and related costs as a percentage of sales were relatively flat year-over-year; 2012 included a $1.0 million advertising credit received from PJMF.
· Occupancy costs and other restaurant operating expenses as a percentage of sales were relatively consistent (20.3% in 2013 and 20.4% in 2012).
Domestic commissary operating margin was 7.7% in both 2013 and 2012, with the following differences by income statement line:
· Cost of sales was 0.6% lower as a percentage of revenues in 2013 primarily due to pricing changes.
· Salaries and benefits and other commissary operating expenses were 0.6% higher as a percentage of revenues in 2013. This was primarily attributable to higher distribution and other operating costs related to bringing distribution in house for certain of our commissaries from a third party provider and the start up dough production costs at our New Jersey commissary, as previously discussed.
Other operating expenses as a percentage of other sales were 90.0% in 2013, compared to 88.7% in 2012. The higher operating expenses were primarily due to the impact of the reduced cost direct mail campaigns offered to our domestic franchised restaurants by Preferred.
International restaurant and commissary expenses were 84.9% in 2013 compared to 84.6% in 2012, as a percentage of total restaurant and commissary sales. The increase of 0.3% is primarily attributable to the higher operating expenses associated with our China Company-owned restaurant operations. As previously noted, our China Company-owned restaurant operations represented approximately 28% of international revenues in 2013 and 22% in 2012, an increase of 6%, and our PJUK operations represented 48% of international revenues in 2013, a decrease of 3%.
General and administrative expenses were $134.2 million, or 9.3% of revenues for 2013, as compared to $131.6 million, or 9.8% of revenues for 2012. The decrease as a percentage of sales was primarily the result of leverage from higher sales. Additionally, 2012 included approximately $3.3 million related to the previously discussed Agne text messaging class action, which increased the 2012 general and administrative expenses percentage by approximately 0.2%.
Other general expenses reflected net expense of $6.7 million in 2013, as compared to $8.3 million in 2012 as detailed below (in thousands):
|
|
|
|
|
|
|
Increase |
| |||
|
|
|
2013 |
|
2012 |
|
(Decrease) |
| |||
|
|
|
|
|
|
|
|
| |||
|
Supplier marketing payment (a) |
|
$ |
(1,000 |
) |
$ |
4,000 |
|
$ |
(5,000 |
) |
|
Franchise and development incentives and initiatives (b) |
|
4,645 |
|
3,194 |
|
1,451 |
| |||
|
Disposition and impairment losses (c) |
|
804 |
|
362 |
|
442 |
| |||
|
Pre-opening restaurant costs |
|
458 |
|
321 |
|
137 |
| |||
|
Perfect Pizza lease obligation (d) |
|
305 |
|
(135 |
) |
440 |
| |||
|
Other expense (e) |
|
1,461 |
|
571 |
|
890 |
| |||
|
Total other general expenses |
|
$ |
6,673 |
|
$ |
8,313 |
|
$ |
(1,640 |
) |
(a) See Items Impacting Comparability; Non-GAAP Measures above for further information about the Incentive Contribution.
(b) Includes incentives provided to domestic franchisees for opening restaurants.
(c) Disposition and impairment losses include costs associated with the disposition of certain systems and other equipment, which were higher in 2013.
(d) The Perfect Pizza lease obligation relates to rents, taxes and insurance associated with the former Perfect Pizza operations in the United Kingdom.
(e) The increase is primarily due to higher expenses associated with our online customer loyalty program.
Depreciation and amortization was $35.1 million, or 2.4% of revenues for 2013, as compared to $32.8 million, or 2.4% of revenues, for 2012. The increase of $2.3 million is primarily due to higher depreciation for our domestic commissaries, primarily attributable to incremental depreciation related to the New Jersey dough production capital expenditures, and higher international depreciation costs primarily associated with the additional number of China Company-owned restaurants.
Net interest. Net interest expense consisted of the following (in thousands):
|
|
|
Year Ended |
| |||||||
|
|
|
Dec. 29, |
|
Dec. 30, |
|
(Increase) |
| |||
|
|
|
2013 |
|
2012 |
|
Decrease |
| |||
|
|
|
|
|
|
|
|
| |||
|
Interest expense - line of credit (a) |
|
$ |
(2,131 |
) |
$ |
(1,114 |
) |
$ |
(1,017 |
) |
|
Investment income |
|
589 |
|
750 |
|
(161 |
) | |||
|
Change in redemption value of mandatorily redeemable noncontrolling interest in a joint venture (b) |
|
1,148 |
|
(1,048 |
) |
2,196 |
| |||
|
Net interest (expense) income |
|
$ |
(394 |
) |
$ |
(1,412 |
) |
$ |
1,018 |
|
(a) The increase in interest expense was due to a higher average outstanding debt balance and a higher effective interest rate.
(b) See Notes 2 and 6 of Notes to Consolidated Financial Statements for additional information.
Income Tax Expense. Our effective income tax rate was 31.2% in 2013 compared to 32.9% in 2012. The lower tax rate in 2013 includes both higher levels of tax credits, including Work Opportunity Tax Credit and state and federal research and experimentation credits, as well as favorable nonrecurring settlements of specific state tax matters. We recognized a decrease of $909,000 in our 2013 income tax expense associated with the finalization of certain income tax matters while we recognized additional income tax expense in 2012 of approximately $305,000. See Note 15 of Notes to Consolidated Financial Statements for additional information.
Liquidity and Capital Resources
Our debt is comprised entirely of an unsecured revolving credit facility with outstanding balances of $230.5 million as of December 28, 2014 and $157.9 million as of December 29, 2013. The increase in the outstanding balance was primarily due to borrowings to fund increased share repurchases and to pay dividends.
On October 31, 2014, we amended our unsecured revolving line of credit facility (Amended Line) to increase the amount available from $300 million to $400 million and extend the maturity date from April 30, 2018 to October 31, 2019. Additionally, we have the option to increase the Amended Line an additional $100 million. The interest rate charged on outstanding balances is LIBOR plus 75 to 175 basis points. The commitment fee on the unused balance ranges from 15 to 25 basis points. The increment over LIBOR and the commitment fee are determined quarterly based upon the ratio of total indebtedness to consolidated earnings before interest, taxes, depreciation and amortization (EBITDA), as defined by the Amended Line. The remaining availability under the Amended Line, reduced for outstanding letters of credit approximates $148.2 million.
We use interest rate swaps to hedge against the effects of potential interest rate increases on borrowings under our revolving credit facility. On July 30, 2013, we terminated our $50 million interest rate swap agreement, which had a fixed rate of 0.56%. Upon termination of the $50 million swap, we entered into a $75 million swap with an interest rate of 1.42% and a maturity date of April 30, 2018. In May 2014, we entered into a $50 million forward interest rate swap with an interest rate of 1.36%, an effective date of December 30, 2014 and a maturity date of April 30, 2018. See Note 9 of Notes to Consolidated Financial Statements for additional information.
Our credit facility contains affirmative and negative covenants, including the following financial covenants, as defined by the credit facility:
|
|
|
Permitted Ratio |
|
Actual Ratio for the |
|
|
|
|
|
|
|
|
|
Leverage Ratio |
|
Not to exceed 3.0 to 1.0 |
|
1.5 to 1.0 |
|
|
|
|
|
|
|
|
|
Interest Coverage Ratio |
|
Not less than 3.5 to 1.0 |
|
5.0 to 1.0 |
|
Our leverage ratio is defined as outstanding debt divided by consolidated EBITDA for the most recent four fiscal quarters. Our interest coverage ratio is defined as the sum of consolidated EBITDA and consolidated rental expense for the most recent four fiscal quarters divided by the sum of consolidated interest expense and consolidated rental expense for the most recent four fiscal quarters. We were in compliance with all covenants as of December 28, 2014.
Cash flow provided by operating activities was $122.6 million for 2014 as compared to $101.4 million in 2013. The increase of approximately $21.3 million was primarily due to higher net income and favorable changes in working capital and other operating activities including higher depreciation and amortization expense. Cash flow provided by operating activities decreased to $101.4 million in 2013 from $104.4 million in 2012, primarily due to working capital needs offset somewhat by higher net income.
The Companys free cash flow for the last three years was as follows (in thousands):
|
|
|
Year Ended |
| |||||||
|
|
|
Dec. 28, |
|
Dec. 29, |
|
Dec. 30, |
| |||
|
|
|
2014 |
|
2013 |
|
2012 |
| |||
|
|
|
|
|
|
|
|
| |||
|
Net cash provided by operating activities |
|
$ |
122,632 |
|
$ |
101,360 |
|
$ |
104,379 |
|
|
Purchase of property and equipment (a) |
|
(48,655 |
) |
(50,750 |
) |
(42,628 |
) | |||
|
Free cash flow (b) |
|
$ |
73,977 |
|
$ |
50,610 |
|
$ |
61,751 |
|
(a) We require capital primarily for the development, acquisition, renovation and maintenance of restaurants, the development, renovation and maintenance of commissary facilities and equipment and the enhancement of corporate systems and facilities, including technological enhancements. The purchases for 2014 include FOCUS equipment costs for domestic Company-owned restaurants and technology investments, including FOCUS software development costs. The purchases for 2013 include expenditures on equipment for New Jersey commissary dough production, technology investments, including FOCUS software development costs, and China new restaurant builds. Purchases of property and equipment are summarized by operating segment in Note 20 of Notes to Consolidated Financial Statements.
(b) We define free cash flow as net cash provided by operating activities (from the consolidated statements of cash flows) less the purchases of property and equipment. See Items Impacting Comparability; Non-GAAP Measures for more information about this non-GAAP measure, its limitations and why we present free cash flow alongside the most directly comparable GAAP measure.
We require capital for share repurchases and the payment of cash dividends. The following is a summary of our common share repurchases, as adjusted for the stock split, for the last three years (in thousands, except average price per share):
|
Fiscal |
|
Number of |
|
Total Cash |
|
Average |
| ||
|
2012 |
|
4,552 |
|
$ |
106,095 |
|
$ |
23.31 |
|
|
2013 |
|
3,538 |
|
$ |
118,569 |
|
$ |
33.51 |
|
|
2014 |
|
2,562 |
|
$ |
117,400 |
|
$ |
45.82 |
|
Subsequent to December 28, 2014, we acquired an additional 224,000 shares at an aggregate cost of $13.6 million. Approximately $115.9 million remained available through December 31, 2015 under the Companys share repurchase program as of February 17, 2015.
In 2014 and 2013, we paid cash dividends of $21.7 million and $10.8 million, respectively (first dividend payment in September 2013). Additionally, on January 28, 2015, our Board of Directors declared a first quarter 2015 cash dividend of $0.14 per share, or approximately $5.6 million. The dividend was paid on February 20, 2015 to shareholders of record as of the close of business on February 9, 2015. The declaration and payment of any future dividends will be at the discretion of the Board of Directors, subject to the Companys financial results, cash requirements, and other factors deemed relevant by the Board of Directors.
Contractual obligations and payments as of December 28, 2014 due by year are as follows (in thousands):
|
|
|
Payments Due by Period |
| |||||||||||||
|
|
|
Less than 1 |
|
1-3 Years |
|
3-5 Years |
|
After 5 |
|
Total |
| |||||
|
|
|
|
|
|
|
|
|
|
|
|
| |||||
|
Contractual Obligations: |
|
|
|
|
|
|
|
|
|
|
| |||||
|
|
|
|
|
|
|
|
|
|
|
|
| |||||
|
Revolving credit facility (1) |
|
$ |
|
|
$ |
|
|
$ |
230,451 |
|
$ |
|
|
$ |
230,451 |
|
|
Interest payments (2) |
|
4,803 |
|
9,606 |
|
6,505 |
|
|
|
20,914 |
| |||||
|
Total debt |
|
4,803 |
|
9,606 |
|
236,956 |
|
|
|
251,365 |
| |||||
|
Operating leases (3) |
|
40,062 |
|
65,951 |
|
41,007 |
|
38,255 |
|
185,275 |
| |||||
|
Total contractual obligations |
|
$ |
44,865 |
|
$ |
75,557 |
|
$ |
277,963 |
|
$ |
38,255 |
|
$ |
436,640 |
|
(1) We utilize interest rate swaps to hedge against $125 million of our variable rate debt. The value of our interest rate swaps was $376,000 at December 28, 2014 and was recorded in other current and other long-term liabilities in the consolidated balance sheet.
(2) Represents estimated interest payments on our revolving line of credit balance outstanding as of December 28, 2014. The interest payments assume the outstanding balance on our $400 million unsecured revolving credit facility will remain at $230.5 million until the maturity date of October 31, 2019. Interest payments are calculated based on LIBOR plus the applicable margin in effect at December 28, 2014, and considers the interest rate swap agreements in effect until April 30, 2018 (interest rates of 1.36% and 1.42%). The actual interest rates on our variable rate debt and the amount of our indebtedness could vary from those used to compute the above interest payments. See Note 9 of Notes to Consolidated Financial Statements for additional information concerning our debt and credit arrangements.
(3) See Note 17 of Notes to Consolidated Financial Statements for additional information.
The above table does not include the following:
· Unrecognized tax benefits of $2.8 million since we are not able to make reasonable estimates of the period of cash settlement with respect to the taxing authority.
· Redeemable noncontrolling interests of $8.6 million as we are not able to predict the timing of the redemptions.
Off-Balance Sheet Arrangements
The off-balance sheet arrangements that are reasonably likely to have a current or future effect on the Companys financial condition are operating leases of Company-owned restaurant sites, QC Centers, office space and transportation equipment.
We guarantee leases for certain Papa Johns domestic franchisees, who purchased restaurants that were previously Company-owned, as well as approximately 25 leases in the United Kingdom in connection with the 2006 sale of our former Perfect Pizza operations. We are contingently liable on these leases. These leases have varying terms, the latest of which expires in 2018. As of December 28, 2014, the estimated maximum amount of undiscounted payments the Company could be required to make in the event of nonpayment by the primary lessees was approximately $1.1 million.
We have certain other commercial commitments where payment is contingent upon the occurrence of certain events. Such commitments include the following by year (in thousands):
|
|
|
Amount of Commitment Expiration Per Period |
| |||||||||||||
|
|
|
Less than |
|
1-3 |
|
3-5 |
|
After |
|
|
| |||||
|
|
|
1 Year |
|
Years |
|
Years |
|
5 Years |
|
Total |
| |||||
|
|
|
|
|
|
|
|
|
|
|
|
| |||||
|
Other Commercial Commitments: |
|
|
|
|
|
|
|
|
|
|
| |||||
|
|
|
|
|
|
|
|
|
|
|
|
| |||||
|
Standby letters of credit |
|
$ |
21,312 |
|
$ |
|
|
$ |
|
|
$ |
|
|
$ |
21,312 |
|
We are party to standby letters of credit with off-balance sheet risk associated with our insurance programs. See Notes 9, 12 and 17 of Notes to Consolidated Financial Statements for additional information related to contractual and other commitments.
Forward-Looking Statements
Certain matters discussed in this report, including information within Managements Discussion and Analysis of Financial Condition and Results of Operations, constitute forward-looking statements within the meaning of the federal securities laws. Generally, the use of words such as expect, estimate, believe, anticipate, will, forecast, plan, project, or similar words identify forward-looking statements that we intend to be included within the safe harbor protections provided by the federal securities laws. Such forward-looking statements may relate to projections or guidance concerning business performance, revenue, earnings, contingent liabilities, resolution of litigation, commodity costs, profit margins, unit growth, capital expenditures, and other financial and operational measures. Such statements are not guarantees of future performance and involve certain risks, uncertainties and assumptions, which are difficult to predict and many of which are beyond our control. Therefore, actual outcomes and results may differ materially from those matters expressed or implied in such forward-looking statements. The risks, uncertainties and assumptions that are involved in our forward-looking statements include, but are not limited to:
· aggressive changes in pricing or other marketing or promotional strategies by competitors, which may adversely affect sales; and new product and concept developments by food industry competitors;
· changes in consumer preferences or consumer buying habits, including the impact of adverse general economic conditions;
· the impact that product recalls, food quality or safety issues, incidences of foodborne illness, food contamination and other general public health concerns, including potential epidemics, could have system-wide on our restaurants or our results;
· failure to maintain our brand strength and quality reputation;
· the ability of the Company and its franchisees to meet planned growth targets and operate new and existing restaurants profitably;
· increases in or sustained high costs of food ingredients or other restaurant costs. This could include increased employee compensation, benefits, insurance, tax rates, regulatory compliance and similar costs; including increased costs resulting from federal health care legislation;
· disruption of our supply chain or commissary operations which could be caused by our sole source of supply of cheese or limited source of suppliers for other key ingredients or more generally due to weather, drought, disease, geopolitical or other disruptions beyond our control;
· increased risks associated with our international operations, including economic and political conditions, instability in our international markets, fluctuations in currency exchange rates, and difficulty in meeting planned sales targets and new store growth. This could include our expansion into emerging or underpenetrated markets, such as China, where we have a Company-owned presence. Based on prior experience in underpenetrated markets, operating losses are likely to occur as the market is being established;
· the impact of changes in interest rates on the Company or our franchisees;
· the credit performance of our franchise loan or guarantee programs;
· the impact of the resolution of current or future claims and litigation;
· current or proposed legislation impacting our business;
· failure to effectively execute succession planning, and our reliance on the multiple roles of our Founder, Chairman, President and Chief Executive Officer, who also serves as our brand spokesperson; and
· disruption of critical business or information technology systems, and risks associated with systems failures and data privacy and security breaches, including theft of Company, employee and customer information.
These and other risk factors are discussed in detail in Part I. Item 1A. Risk Factors of this Annual Report on Form 10-K. We undertake no obligation to update publicly any forward-looking statements, whether as a result of future events, new information or otherwise, except as required by law.
Item 7A. Quantitative and Qualitative Disclosures About Market Risk
Interest Rate Risk
Our debt is comprised entirely of an unsecured revolving credit facility with outstanding balances of $230.5 million as of December 28, 2014 and $157.9 million as of December 29, 2013. On October 31, 2014, we amended our unsecured revolving credit facility (Amended Line) to increase the amount available from $300 million to $400 million and extend the maturity date from April 30, 2018 to October 31, 2019. Additionally, we have the option to increase the Amended Line an additional $100 million. The interest rate charged on the outstanding balances is LIBOR plus 75 to 175 basis points. The commitment fee on the unused balance ranges from 15 to 25 basis points.
We attempt to minimize interest risk exposure and to lower our overall borrowing costs for changes in interest rates through the utilization of interest rate swaps, which are derivative financial instruments. Our swaps are entered into with financial institutions and have reset dates and critical terms that match those of the underlying debt. By using a derivative instrument to hedge exposures to changes in interest rates, we expose ourselves to credit risk. Credit risk is the failure of the counterparty to perform under the terms of the derivative contract. We minimize the credit risk by entering into transactions with high-quality counterparties whose credit rating is evaluated on a quarterly basis.
On July 30, 2013, we terminated our $50 million interest rate swap agreement, which had a fixed rate of 0.56%. Upon termination of the $50 million swap, we entered into a $75 million swap with an interest rate of 1.42% and a maturity date of April 30, 2018. In May 2014, we entered into a $50 million forward interest rate swap with an interest rate of 1.36%, an effective date of December 30, 2014 and a maturity date of April 30, 2018.
The effective interest rate on the revolving line of credit, including the impact of the interest rate swap agreements, was 2.1% as of December 28, 2014. An increase in the present interest rate of 100 basis points on the line of credit balance outstanding as of December 28, 2014, including the impact of the interest rate swaps, would increase interest expense by $1.1 million.
Foreign Currency Exchange Rate Risk
We do not enter into financial instruments to manage foreign currency exchange rates since only 6.4% of our total revenues are derived from sales to customers and royalties outside the United States.
Commodity Price Risk
In the ordinary course of business, the food and paper products we purchase, including cheese (historically representing 35% to 40% of our food cost), are subject to seasonal fluctuations, weather, availability, demand and other factors that are beyond our control. We have pricing agreements with some of our vendors, including forward pricing agreements for a portion of our cheese purchases for our domestic Company-owned restaurants, which are accounted for as normal purchases; however, we still remain exposed to on-going commodity volatility.
The following table presents the actual average block price for cheese by quarter in 2014, 2013 and 2012. Also presented is the projected 2015 average block price by quarter (based on the February 17, 2015 Chicago Mercantile Exchange cheese futures prices for 2015):
|
|
|
2015 |
|
2014 |
|
2013 |
|
2012 |
| ||||
|
|
|
Projected |
|
Block |
|
Block |
|
Block |
| ||||
|
|
|
Market |
|
Price |
|
Price |
|
Price |
| ||||
|
|
|
|
|
|
|
|
|
|
| ||||
|
Quarter 1 |
|
$ |
1.564 |
|
$ |
2.212 |
|
$ |
1.662 |
|
$ |
1.522 |
|
|
Quarter 2 |
|
1.650 |
|
2.131 |
|
1.784 |
|
1.539 |
| ||||
|
Quarter 3 |
|
1.786 |
|
2.141 |
|
1.740 |
|
1.750 |
| ||||
|
Quarter 4 |
|
1.778 |
|
1.991 |
|
1.849 |
|
1.939 |
| ||||
|
Full Year |
|
$ |
1.695 |
|
$ |
2.119 |
|
$ |
1.759 |
|
$ |
1.692 |
|
Item 8. Financial Statements and Supplementary Data
Report of Independent Registered Public Accounting Firm
The Board of Directors and Stockholders of Papa Johns International, Inc. and Subsidiaries
We have audited the accompanying consolidated balance sheets of Papa Johns International, Inc. and Subsidiaries as of December 28, 2014 and December 29, 2013, and the related consolidated statements of income, comprehensive income, stockholders equity, and cash flows for each of the three years in the period ended December 28, 2014. Our audits also included the financial statement schedule listed in the Index at Item 15(a)(2). These financial statements and schedule are the responsibility of the Companys management. Our responsibility is to express an opinion on these financial statements and schedule based on our audits.
We conducted our audits in accordance with the standards of the Public Company Accounting Oversight Board (United States). Those standards require that we plan and perform the audit to obtain reasonable assurance about whether the financial statements are free of material misstatement. An audit includes examining, on a test basis, evidence supporting the amounts and disclosures in the financial statements. An audit also includes assessing the accounting principles used and significant estimates made by management, as well as evaluating the overall financial statement presentation. We believe that our audits provide a reasonable basis for our opinion.
In our opinion, the financial statements referred to above present fairly, in all material respects, the consolidated financial position of Papa Johns International, Inc. and Subsidiaries at December 28, 2014 and December 29, 2013, and the consolidated results of their operations and their cash flows for each of the three years in the period ended December 28, 2014, in conformity with U.S. generally accepted accounting principles. Also, in our opinion, the related financial statement schedule, when considered in relation to the basic financial statements taken as a whole, presents fairly in all material respects the information set forth therein.
We also have audited, in accordance with the standards of the Public Company Accounting Oversight Board (United States), Papa Johns International, Inc. and Subsidiaries internal control over financial reporting as of December 28, 2014, based on criteria established in Internal ControlIntegrated Framework issued by the Committee of Sponsoring Organizations of the Treadway Commission (2013 Framework) and our report dated February 24, 2015, expressed an unqualified opinion thereon.
|
|
/s/ Ernst & Young LLP |
Louisville, Kentucky
February 24, 2015
Papa Johns International, Inc. and Subsidiaries
Consolidated Statements of Income
|
|
|
Years Ended |
| |||||||
|
|
|
December 28, |
|
December 29, |
|
December 30, |
| |||
|
(In thousands, except per share amounts) |
|
2014 |
|
2013 |
|
2012 |
| |||
|
North America revenues: |
|
|
|
|
|
|
| |||
|
Domestic Company-owned restaurant sales |
|
$ |
701,854 |
|
$ |
635,317 |
|
$ |
592,203 |
|
|
Franchise royalties |
|
89,443 |
|
81,692 |
|
79,567 |
| |||
|
Franchise and development fees |
|
726 |
|
1,181 |
|
806 |
| |||
|
Domestic commissary sales |
|
629,492 |
|
578,870 |
|
545,924 |
| |||
|
Other sales |
|
74,179 |
|
53,322 |
|
51,223 |
| |||
|
International revenues: |
|
|
|
|
|
|
| |||
|
Royalties and franchise and development fees |
|
25,730 |
|
21,979 |
|
19,881 |
| |||
|
Restaurant and commissary sales |
|
76,725 |
|
66,661 |
|
53,049 |
| |||
|
Total revenues |
|
1,598,149 |
|
1,439,022 |
|
1,342,653 |
| |||
|
Costs and expenses: |
|
|
|
|
|
|
| |||
|
Domestic Company-owned restaurant expenses: |
|
|
|
|
|
|
| |||
|
Cost of sales |
|
175,733 |
|
156,237 |
|
137,378 |
| |||
|
Salaries and benefits |
|
188,234 |
|
173,316 |
|
163,260 |
| |||
|
Advertising and related costs |
|
63,463 |
|
59,172 |
|
54,583 |
| |||
|
Occupancy costs and other restaurant operating expenses |
|
144,628 |
|
128,826 |
|
120,581 |
| |||
|
Total domestic Company-owned restaurant expenses |
|
572,058 |
|
517,551 |
|
475,802 |
| |||
|
Domestic commissary expenses: |
|
|
|
|
|
|
| |||
|
Cost of sales |
|
492,940 |
|
448,693 |
|
426,531 |
| |||
|
Salaries and benefits and other commissary operating expenses |
|
91,981 |
|
85,649 |
|
77,503 |
| |||
|
Total domestic commissary expenses |
|
584,921 |
|
534,342 |
|
504,034 |
| |||
|
Other operating expenses |
|
71,068 |
|
48,011 |
|
45,455 |
| |||
|
International restaurant and commissary expenses |
|
63,718 |
|
56,609 |
|
44,853 |
| |||
|
General and administrative expenses |
|
140,566 |
|
134,228 |
|
131,591 |
| |||
|
Other general expenses |
|
8,223 |
|
6,673 |
|
8,313 |
| |||
|
Depreciation and amortization |
|
39,965 |
|
35,105 |
|
32,798 |
| |||
|
Total costs and expenses |
|
1,480,519 |
|
1,332,519 |
|
1,242,846 |
| |||
|
Operating income |
|
117,630 |
|
106,503 |
|
99,807 |
| |||
|
Investment income |
|
702 |
|
589 |
|
750 |
| |||
|
Interest expense |
|
(4,077 |
) |
(983 |
) |
(2,162 |
) | |||
|
Income before income taxes |
|
114,255 |
|
106,109 |
|
98,395 |
| |||
|
Income tax expense |
|
36,558 |
|
33,130 |
|
32,393 |
| |||
|
Net income before attribution to noncontrolling interests |
|
77,697 |
|
72,979 |
|
66,002 |
| |||
|
Income attributable to noncontrolling interests |
|
(4,382 |
) |
(3,442 |
) |
(4,342 |
) | |||
|
Net income attributable to the Company |
|
$ |
73,315 |
|
$ |
69,537 |
|
$ |
61,660 |
|
|
|
|
|
|
|
|
|
| |||
|
Calculation of income for earnings per share: |
|
|
|
|
|
|
| |||
|
Net income attributable to the Company |
|
$ |
73,315 |
|
$ |
69,537 |
|
$ |
61,660 |
|
|
Increase in noncontrolling interest redemption value |
|
(44 |
) |
(510 |
) |
|
| |||
|
Net income attributable to participating securities |
|
(402 |
) |
(530 |
) |
|
| |||
|
Net income attributable to common shareholders |
|
$ |
72,869 |
|
$ |
68,497 |
|
$ |
61,660 |
|
|
|
|
|
|
|
|
|
| |||
|
Basic earnings per common share |
|
$ |
1.78 |
|
$ |
1.58 |
|
$ |
1.31 |
|
|
Diluted earnings per common share |
|
$ |
1.75 |
|
$ |
1.55 |
|
$ |
1.29 |
|
|
|
|
|
|
|
|
|
| |||
|
Basic weighted average common shares outstanding |
|
40,960 |
|
43,387 |
|
46,916 |
| |||
|
Diluted weighted average common shares outstanding |
|
41,718 |
|
44,243 |
|
47,810 |
| |||
|
|
|
|
|
|
|
|
| |||
|
Dividends declared per common share |
|
$ |
0.53 |
|
$ |
0.25 |
|
$ |
|
|
|
|
|
|
|
|
|
|
| |||
|
Supplemental data (see Note 16): |
|
|
|
|
|
|
| |||
|
Revenues - affiliates |
|
$ |
3,546 |
|
$ |
3,259 |
|
$ |
29,310 |
|
See accompanying notes.
Papa Johns International, Inc. and Subsidiaries
Consolidated Statements of Comprehensive Income
|
|
|
Years Ended |
| |||||||
|
|
|
December 28, |
|
December 29, |
|
December 30, |
| |||
|
(In thousands) |
|
2014 |
|
2013 |
|
2012 |
| |||
|
|
|
|
|
|
|
|
| |||
|
Net income before attribution to noncontrolling interests |
|
$ |
77,697 |
|
$ |
72,979 |
|
$ |
66,002 |
|
|
Other comprehensive income (loss), before tax: |
|
|
|
|
|
|
| |||
|
Foreign currency translation adjustments |
|
(2,584 |
) |
1,065 |
|
1,128 |
| |||
|
Interest rate swaps (1) |
|
(261 |
) |
(51 |
) |
(114 |
) | |||
|
Defined benefit pension plan |
|
|
|
|
|
45 |
| |||
|
Other comprehensive income (loss), before tax |
|
(2,845 |
) |
1,014 |
|
1,059 |
| |||
|
Income tax effect: |
|
|
|
|
|
|
| |||
|
Foreign currency translation adjustments |
|
956 |
|
(394 |
) |
(1,110 |
) | |||
|
Interest rate swaps (2) |
|
97 |
|
19 |
|
42 |
| |||
|
Defined benefit pension plan |
|
|
|
|
|
(16 |
) | |||
|
Income tax effect |
|
1,053 |
|
(375 |
) |
(1,084 |
) | |||
|
Other comprehensive income (loss), net of tax |
|
(1,792 |
) |
639 |
|
(25 |
) | |||
|
Comprehensive income before attribution to noncontrolling interests |
|
75,905 |
|
73,618 |
|
65,977 |
| |||
|
Comprehensive income, redeemable noncontrolling interests |
|
(3,687 |
) |
(3,466 |
) |
(4,342 |
) | |||
|
Comprehensive income, nonredeemable noncontrolling interests |
|
(695 |
) |
24 |
|
|
| |||
|
Comprehensive income attributable to the Company |
|
$ |
71,523 |
|
$ |
70,176 |
|
$ |
61,635 |
|
(1) Amounts reclassified out of accumulated other comprehensive income (AOCI) into interest expense included $996, $501 and $150 for the years ended December 28, 2014, December 29, 2013 and December 30, 2012, respectively.
(2) The income tax effects of amounts reclassified out of AOCI into interest expense were $369, $185 and $55 for the years ended December 28, 2014, December 29, 2013 and December 30, 2012, respectively.
See accompanying notes.
Papa Johns International, Inc. and Subsidiaries
Consolidated Balance Sheets
|
|
|
Years Ended |
| ||||
|
|
|
December 28, |
|
December 29, |
| ||
|
(In thousands, except per share amounts) |
|
2014 |
|
2013 |
| ||
|
|
|
|
|
|
| ||
|
Assets |
|
|
|
|
| ||
|
Current assets: |
|
|
|
|
| ||
|
Cash and cash equivalents |
|
$ |
20,122 |
|
$ |
13,670 |
|
|
Accounts receivable (less allowance for doubtful accounts of $3,814 in 2014 and $4,318 in 2013) |
|
55,933 |
|
52,919 |
| ||
|
Accounts receivable - affiliates (no allowance for doubtful accounts in 2014 and 2013) |
|
114 |
|
284 |
| ||
|
Notes receivable (no allowance for doubtful accounts in 2014 and 2013) |
|
6,106 |
|
3,566 |
| ||
|
Income taxes receivable |
|
9,527 |
|
|
| ||
|
Inventories |
|
27,394 |
|
23,035 |
| ||
|
Deferred income taxes |
|
8,248 |
|
8,004 |
| ||
|
Prepaid expenses |
|
18,736 |
|
14,336 |
| ||
|
Other current assets |
|
9,828 |
|
9,226 |
| ||
|
Total current assets |
|
156,008 |
|
125,040 |
| ||
|
Net property and equipment |
|
219,457 |
|
212,097 |
| ||
|
Notes receivable, less current portion (less allowance for doubtful accounts of $3,132 in 2014 and $3,387 in 2013) |
|
12,801 |
|
13,239 |
| ||
|
Goodwill |
|
82,007 |
|
79,391 |
| ||
|
Deferred income taxes |
|
3,914 |
|
|
| ||
|
Other assets |
|
38,616 |
|
34,524 |
| ||
|
Total assets |
|
$ |
512,803 |
|
$ |
464,291 |
|
|
|
|
|
|
|
| ||
|
Liabilities and stockholders equity |
|
|
|
|
| ||
|
Current liabilities: |
|
|
|
|
| ||
|
Accounts payable |
|
$ |
38,832 |
|
$ |
35,653 |
|
|
Income and other taxes payable |
|
9,637 |
|
4,401 |
| ||
|
Accrued expenses and other current liabilities |
|
58,293 |
|
57,807 |
| ||
|
Total current liabilities |
|
106,762 |
|
97,861 |
| ||
|
Deferred revenue |
|
4,257 |
|
5,827 |
| ||
|
Long-term debt |
|
230,451 |
|
157,900 |
| ||
|
Deferred income taxes |
|
22,188 |
|
14,660 |
| ||
|
Other long-term liabilities |
|
41,875 |
|
42,835 |
| ||
|
Total liabilities |
|
405,533 |
|
319,083 |
| ||
|
|
|
|
|
|
| ||
|
Redeemable noncontrolling interests |
|
8,555 |
|
7,024 |
| ||
|
|
|
|
|
|
| ||
|
Stockholders equity: |
|
|
|
|
| ||
|
Preferred stock ($0.01 par value per share; no shares issued) |
|
|
|
|
| ||
|
Common stock ($0.01 par value per share; issued 43,331 in 2014 and 42,796 in 2013) |
|
433 |
|
428 |
| ||
|
Additional paid-in capital |
|
147,912 |
|
137,552 |
| ||
|
Accumulated other comprehensive income |
|
671 |
|
2,463 |
| ||
|
Retained earnings |
|
92,876 |
|
41,297 |
| ||
|
Treasury stock (3,549 shares in 2014 and 1,129 shares in 2013, at cost) |
|
(155,659 |
) |
(44,066 |
) | ||
|
Total stockholders equity, net of noncontrolling interests |
|
86,233 |
|
137,674 |
| ||
|
Noncontrolling interests in subsidiaries |
|
12,482 |
|
510 |
| ||
|
Total stockholders equity |
|
98,715 |
|
138,184 |
| ||
|
Total liabilities, redeemable noncontrolling interests and stockholders equity |
|
$ |
512,803 |
|
$ |
464,291 |
|
See accompanying notes.
Papa Johns International, Inc. and Subsidiaries
Consolidated Statements of Stockholders Equity
|
|
|
Papa Johns International, Inc. |
|
|
|
|
| |||||||||||||||||
|
|
|
Common |
|
|
|
|
|
Accumulated |
|
|
|
|
|
|
|
|
| |||||||
|
|
|
Stock |
|
|
|
Additional |
|
Other |
|
|
|
|
|
Noncontrolling |
|
Total |
| |||||||
|
|
|
Shares |
|
Common |
|
Paid-In |
|
Comprehensive |
|
Retained |
|
Treasury |
|
Interests in |
|
Stockholders |
| |||||||
|
(In thousands) |
|
Outstanding |
|
Stock |
|
Capital |
|
Income (Loss) |
|
Earnings |
|
Stock |
|
Subsidiaries |
|
Equity |
| |||||||
|
Balance at December 25, 2011 |
|
48,038 |
|
$ |
734 |
|
$ |
262,089 |
|
$ |
1,849 |
|
$ |
294,801 |
|
$ |
(353,826 |
) |
$ |
|
|
$ |
205,647 |
|
|
Net income attributable to the Company (1) |
|
|
|
|
|
|
|
|
|
61,660 |
|
|
|
|
|
61,660 |
| |||||||
|
Other comprehensive loss |
|
|
|
|
|
|
|
(25 |
) |
|
|
|
|
|
|
(25 |
) | |||||||
|
Exercise of stock options |
|
864 |
|
8 |
|
12,256 |
|
|
|
|
|
|
|
|
|
12,264 |
| |||||||
|
Tax effect of equity awards |
|
|
|
|
|
933 |
|
|
|
|
|
|
|
|
|
933 |
| |||||||
|
Acquisition of Company common stock |
|
(4,552 |
) |
|
|
|
|
|
|
|
|
(106,095 |
) |
|
|
(106,095 |
) | |||||||
|
Stock-based compensation expense |
|
|
|
|
|
6,905 |
|
|
|
|
|
|
|
|
|
6,905 |
| |||||||
|
Issuance of restricted stock |
|
132 |
|
|
|
(1,582 |
) |
|
|
|
|
1,582 |
|
|
|
|
| |||||||
|
Other |
|
|
|
|
|
(67 |
) |
|
|
|
|
292 |
|
|
|
225 |
| |||||||
|
Balance at December 30, 2012 |
|
44,482 |
|
742 |
|
280,534 |
|
1,824 |
|
356,461 |
|
(458,047 |
) |
|
|
181,514 |
| |||||||
|
Net income attributable to the Company (1) |
|
|
|
|
|
|
|
|
|
69,537 |
|
|
|
(24 |
) |
69,513 |
| |||||||
|
Other comprehensive income |
|
|
|
|
|
|
|
639 |
|
|
|
|
|
|
|
639 |
| |||||||
|
Cash dividends paid |
|
|
|
|
|
41 |
|
|
|
(10,751 |
) |
|
|
|
|
(10,710 |
) | |||||||
|
Exercise of stock options |
|
570 |
|
6 |
|
6,859 |
|
|
|
|
|
|
|
|
|
6,865 |
| |||||||
|
Tax effect of equity awards |
|
|
|
|
|
1,172 |
|
|
|
|
|
|
|
|
|
1,172 |
| |||||||
|
Acquisition of Company common stock |
|
(3,536 |
) |
|
|
|
|
|
|
|
|
(118,569 |
) |
|
|
(118,569 |
) | |||||||
|
Retirement of Company common stock |
|
|
|
(320 |
) |
(156,380 |
) |
|
|
(373,440 |
) |
530,140 |
|
|
|
|
| |||||||
|
Stock-based compensation expense |
|
|
|
|
|
7,409 |
|
|
|
|
|
|
|
|
|
7,409 |
| |||||||
|
Issuance of restricted stock |
|
138 |
|
|
|
(2,187 |
) |
|
|
|
|
2,187 |
|
|
|
|
| |||||||
|
Change in redemption value of noncontrolling interests |
|
|
|
|
|
|
|
|
|
(510 |
) |
|
|
|
|
(510 |
) | |||||||
|
Reclassification from temporary equity to permanent equity |
|
|
|
|
|
|
|
|
|
|
|
|
|
434 |
|
434 |
| |||||||
|
Contributions from noncontrolling interests |
|
|
|
|
|
|
|
|
|
|
|
|
|
100 |
|
100 |
| |||||||
|
Other |
|
13 |
|
|
|
104 |
|
|
|
|
|
223 |
|
|
|
327 |
| |||||||
|
Balance at December 29, 2013 |
|
41,667 |
|
428 |
|
137,552 |
|
2,463 |
|
41,297 |
|
(44,066 |
) |
510 |
|
138,184 |
| |||||||
|
Net income attributable to the Company (1) |
|
|
|
|
|
|
|
|
|
73,315 |
|
|
|
695 |
|
74,010 |
| |||||||
|
Other comprehensive loss |
|
|
|
|
|
|
|
(1,792 |
) |
|
|
|
|
|
|
(1,792 |
) | |||||||
|
Cash dividends paid |
|
|
|
|
|
87 |
|
|
|
(21,692 |
) |
|
|
|
|
(21,605 |
) | |||||||
|
Exercise of stock options |
|
535 |
|
5 |
|
5,832 |
|
|
|
|
|
|
|
|
|
5,837 |
| |||||||
|
Tax effect of equity awards |
|
|
|
|
|
1,047 |
|
|
|
|
|
|
|
|
|
1,047 |
| |||||||
|
Acquisition of Company common stock |
|
(2,562 |
) |
|
|
|
|
|
|
|
|
(117,400 |
) |
|
|
(117,400 |
) | |||||||
|
Stock-based compensation expense |
|
|
|
|
|
8,712 |
|
|
|
|
|
|
|
|
|
8,712 |
| |||||||
|
Issuance of restricted stock |
|
133 |
|
|
|
(5,443 |
) |
|
|
|
|
5,443 |
|
|
|
|
| |||||||
|
Change in redemption value of noncontrolling interests |
|
|
|
|
|
|
|
|
|
(44 |
) |
|
|
|
|
(44 |
) | |||||||
|
Reclassification from temporary equity to permanent equity |
|
|
|
|
|
|
|
|
|
|
|
|
|
11,391 |
|
11,391 |
| |||||||
|
Contributions from noncontrolling interests |
|
|
|
|
|
|
|
|
|
|
|
|
|
1,086 |
|
1,086 |
| |||||||
|
Distributions to noncontrolling interests |
|
|
|
|
|
|
|
|
|
|
|
|
|
(1,200 |
) |
(1,200 |
) | |||||||
|
Other |
|
9 |
|
|
|
125 |
|
|
|
|
|
364 |
|
|
|
489 |
| |||||||
|
Balance at December 28, 2014 |
|
39,782 |
|
$ |
433 |
|
$ |
147,912 |
|
$ |
671 |
|
$ |
92,876 |
|
$ |
(155,659 |
) |
$ |
12,482 |
|
$ |
98,715 |
|
(1) Net income to the Company at December 28, 2014, December 29, 2013 and December 30, 2012 excludes $4,382, $3,442 and $4,342, respectively, allocable to the noncontrolling interests for our joint venture arrangements.
At December 30, 2012, the accumulated other comprehensive income of $1,824 was comprised of unrealized foreign currency translation gains of $1,889, offset by a net unrealized loss on the interest rate swap agreement of $65.
At December 29, 2013, the accumulated other comprehensive income of $2,463 was comprised of unrealized foreign currency translation gains of $2,561, offset by a net unrealized loss on the interest rate swap agreement of $98.
At December 28, 2014, the accumulated other comprehensive income of $671 was comprised of unrealized foreign currency translation gains of $933, offset by a net unrealized loss on the interest rate swap agreements of $262.
See accompanying notes.
Papa Johns International, Inc. and Subsidiaries
Consolidated Statements of Cash Flows
|
|
|
Years Ended |
| |||||||
|
|
|
December 28, |
|
December 29, |
|
December 30, |
| |||
|
(In thousands) |
|
2014 |
|
2013 |
|
2012 |
| |||
|
Operating activities |
|
|
|
|
|
|
| |||
|
Net income before attribution to noncontrolling interests |
|
$ |
77,697 |
|
$ |
72,979 |
|
$ |
66,002 |
|
|
Adjustments to reconcile net income to net cash provided by operating activities: |
|
|
|
|
|
|
| |||
|
Provision for uncollectible accounts and notes receivable |
|
1,795 |
|
1,921 |
|
1,674 |
| |||
|
Depreciation and amortization |
|
39,965 |
|
35,105 |
|
32,798 |
| |||
|
Deferred income taxes |
|
14,704 |
|
10,603 |
|
2,035 |
| |||
|
Stock-based compensation expense |
|
8,712 |
|
7,409 |
|
6,905 |
| |||
|
Excess tax benefit on equity awards |
|
(10,282 |
) |
(4,755 |
) |
(1,967 |
) | |||
|
Other |
|
4,738 |
|
2,767 |
|
3,230 |
| |||
|
Changes in operating assets and liabilities, net of acquisitions: |
|
|
|
|
|
|
| |||
|
Accounts receivable |
|
(5,741 |
) |
(11,058 |
) |
(18,048 |
) | |||
|
Income taxes receivable |
|
(9,527 |
) |
|
|
|
| |||
|
Inventories |
|
(2,838 |
) |
(857 |
) |
(1,947 |
) | |||
|
Prepaid expenses |
|
(4,394 |
) |
(1,553 |
) |
(2,572 |
) | |||
|
Other current assets |
|
(387 |
) |
(1,458 |
) |
(1,667 |
) | |||
|
Other assets and liabilities |
|
915 |
|
(3,728 |
) |
(3,952 |
) | |||
|
Accounts payable |
|
3,171 |
|
3,029 |
|
(342 |
) | |||
|
Income and other taxes payable |
|
5,233 |
|
(6,027 |
) |
6,460 |
| |||
|
Accrued expenses and other current liabilities |
|
(665 |
) |
(2,536 |
) |
12,209 |
| |||
|
Deferred revenue |
|
(464 |
) |
(481 |
) |
3,561 |
| |||
|
Net cash provided by operating activities |
|
122,632 |
|
101,360 |
|
104,379 |
| |||
|
Investing activities |
|
|
|
|
|
|
| |||
|
Purchases of property and equipment |
|
(48,655 |
) |
(50,750 |
) |
(42,628 |
) | |||
|
Loans issued |
|
(6,816 |
) |
(6,095 |
) |
(4,903 |
) | |||
|
Repayments of loans issued |
|
4,254 |
|
7,068 |
|
3,642 |
| |||
|
Acquisitions, net of cash acquired |
|
(4,773 |
) |
|
|
(6,175 |
) | |||
|
Proceeds from divestitures of restaurants |
|
400 |
|
|
|
908 |
| |||
|
Other |
|
556 |
|
339 |
|
36 |
| |||
|
Net cash used in investing activities |
|
(55,034 |
) |
(49,438 |
) |
(49,120 |
) | |||
|
Financing activities |
|
|
|
|
|
|
| |||
|
Net proceeds on line of credit facility |
|
72,551 |
|
69,642 |
|
36,769 |
| |||
|
Cash dividends paid |
|
(21,735 |
) |
(10,797 |
) |
|
| |||
|
Excess tax benefit on equity awards |
|
10,282 |
|
4,755 |
|
1,967 |
| |||
|
Tax payments for equity award issuances |
|
(9,235 |
) |
(3,584 |
) |
(855 |
) | |||
|
Proceeds from exercise of stock options |
|
5,837 |
|
6,865 |
|
12,264 |
| |||
|
Acquisition of Company common stock |
|
(117,400 |
) |
(118,569 |
) |
(106,095 |
) | |||
|
Contributions from noncontrolling interest holders |
|
1,086 |
|
950 |
|
2,052 |
| |||
|
Distributions to noncontrolling interest holders |
|
(2,800 |
) |
(3,650 |
) |
(4,256 |
) | |||
|
Other |
|
491 |
|
(327 |
) |
225 |
| |||
|
Net cash used in financing activities |
|
(60,923 |
) |
(54,715 |
) |
(57,929 |
) | |||
|
Effect of exchange rate changes on cash and cash equivalents |
|
(223 |
) |
67 |
|
124 |
| |||
|
Change in cash and cash equivalents |
|
6,452 |
|
(2,726 |
) |
(2,546 |
) | |||
|
Cash and cash equivalents at beginning of year |
|
13,670 |
|
16,396 |
|
18,942 |
| |||
|
Cash and cash equivalents at end of year |
|
$ |
20,122 |
|
$ |
13,670 |
|
$ |
16,396 |
|
See accompanying notes.
Papa Johns International, Inc. and Subsidiaries
Notes to Consolidated Financial Statements
1. Description of Business
Papa Johns International, Inc. (referred to as the Company, Papa Johns or in the first person notations of we, us and our) operates and franchises pizza delivery and carryout restaurants under the trademark Papa Johns, currently in all 50 states and in 36 international countries and territories. Substantially all revenues are derived from retail sales of pizza and other food and beverage products to the general public by Company-owned restaurants, franchise royalties, sales of franchise and development rights, and sales to franchisees of food and paper products, printing and promotional items, risk management services, and information systems and related services used in their operations.
2. Significant Accounting Policies
Principles of Consolidation
The accompanying consolidated financial statements include the accounts of Papa Johns and its subsidiaries. The results of our Company-owned operations in China were consolidated one month in arrears until fiscal 2013. The inclusion of the additional month of operations in fiscal 2013 resulted in $2.1 million of incremental international revenues and an incremental loss before income taxes of $215,000 reported in the international segment. This change in our consolidation policy did not have a material impact to our financial results for any of the years presented. All intercompany balances and transactions have been eliminated.
Variable Interest Entity
Papa Johns domestic restaurants, both Company-owned and franchised, participate in Papa Johns Marketing Fund, Inc. (PJMF), a nonstock corporation designed to operate at break-even for the purpose of designing and administering advertising and promotional programs for all participating domestic restaurants. PJMF is a variable interest entity (VIE) as it does not have sufficient equity to fund its operations without ongoing financial support and contributions from its members. Based on the ownership and governance structure and operating procedures of PJMF, we have determined that we do not have the power to direct the most significant activities of PJMF and are therefore not the primary beneficiary. Accordingly, we determined that consolidation is not appropriate.
Fiscal Year
Our fiscal year ends on the last Sunday in December of each year. All fiscal years presented consist of 52 weeks except for the 2012 fiscal year, which consists of 53 weeks.
Use of Estimates
The preparation of consolidated financial statements in conformity with accounting principles generally accepted in the United States requires management to make estimates and assumptions that affect the amounts reported in the consolidated financial statements and accompanying notes. Significant items that are subject to such estimates and assumptions include allowance for doubtful accounts and notes receivable, intangible assets, online customer loyalty program obligation, insurance reserves and tax reserves. Although management bases its estimates on historical experience and assumptions that are believed to be reasonable under the circumstances, actual results could significantly differ from these estimates.
2. Significant Accounting Policies (continued)
Reclassifications
Certain prior year amounts in the consolidated statements of income have been reclassified to conform to the current year presentation, which had no effect on current or previously reported net income.
Revenue Recognition
Retail sales from Company-owned restaurants and franchise royalties, which are based on a percentage of franchise restaurant sales, are recognized as revenues when the products are delivered to or carried out by customers. Franchise fees are recognized when a franchised restaurant begins operations, at which time we have performed our obligations related to such fees. Fees received pursuant to development agreements which grant the right to develop franchised restaurants in future periods in specific geographic areas are deferred and recognized on a pro rata basis as franchised restaurants subject to the development agreements begin operations.
The Company offers various incentive programs for franchisees including royalty incentives, new restaurant opening (i.e. development incentives) and other various support initiatives. Royalties, franchise and development fees and commissary sales are reduced to reflect any incentives earned or granted under these programs that are in the form of discounts. Direct mail advertising discounts are also periodically offered. Other sales are reduced to reflect these advertising discounts. Other development incentives for opening restaurants are offered in the form of the free use of Company equipment. This equipment is amortized over the term of the agreement, which is generally two to three years, and is recognized in other general expenses in our consolidated statements of income.
Domestic production and distribution revenues are comprised of food, promotional items and supplies sold to franchised restaurants located in the United States and are recognized as revenue upon shipment of the related products to the franchisees. Fees for information services, including software maintenance fees, help desk fees and online ordering fees are recognized as revenue as such services are provided and are included in other sales. Insurance commissions are recognized as revenue over the term of the policy period and are included in other sales.
International revenues are comprised of restaurant sales, royalties and fees received from international franchisees and the sale and distribution of food to international franchisees, and are recognized consistently with the policies applied for revenues generated in the United States.
Advertising and Related Costs
Advertising and related costs include the costs of domestic Company-owned local restaurant activities such as mail coupons, door hangers and promotional items and contributions to PJMF and various local market cooperative advertising funds (Co-op Funds). Contributions by domestic Company-owned and franchised restaurants to PJMF and the Co-op Funds are based on an established percentage of monthly restaurant revenues. PJMF is responsible for developing and conducting marketing and advertising for the domestic Papa Johns system. The Co-op Funds are responsible for developing and conducting advertising activities in a specific market, including the placement of electronic and print materials developed by PJMF. We recognize domestic Company-owned restaurant contributions to PJMF and the Co-op Funds in which we do not have a controlling interest in the period in which the contribution accrues. The net assets of the Co-op Funds in which we possess majority voting rights, and thus control the cooperatives, are included in our consolidated balance sheets.
2. Significant Accounting Policies (continued)
Leases
Lease expense is recognized on a straight-line basis over the expected life of the lease term. A lease term often includes option periods, available at the inception of the lease.
Stock-Based Compensation
Compensation expense for equity grants is estimated on the grant date, net of projected forfeitures, and is recognized over the vesting period (generally in equal installments over three years). Restricted stock is valued based on the market price of the Companys shares on the date of grant. Stock options are valued using a Black-Scholes option pricing model. Our specific assumptions for estimating the fair value of options are included in Note 18.
Cash Equivalents
Cash equivalents consist of highly liquid investments with maturity of three months or less at date of purchase. These investments are carried at cost, which approximates fair value.
Accounts Receivable
Substantially all accounts receivable are due from franchisees for purchases of food, paper products, restaurant equipment, printing and promotional items, risk management services, information systems and related services, and royalties. Credit is extended based on an evaluation of the franchisees financial condition and collateral is generally not required. A reserve for uncollectible accounts is established as deemed necessary based upon overall accounts receivable aging levels and a specific review of accounts for franchisees with known financial difficulties. Account balances are charged off against the allowance after recovery efforts have ceased.
Notes Receivable
The Company provides financing to select franchisees principally for use in the acquisition, construction and development of their restaurants and for the purchase of restaurants from the Company. Notes receivable bear interest at fixed or floating rates and are generally secured by the assets of each restaurant and the ownership interests in the franchise. We establish an allowance based on a review of each borrowers economic performance and underlying collateral value. Note balances are charged off against the allowance after recovery efforts have ceased.
Inventories
Inventories, which consist of food products, paper goods and supplies, smallwares, and printing and promotional items, are stated at the lower of cost, determined under the first-in, first-out (FIFO) method, or market.
2. Significant Accounting Policies (continued)
Property and Equipment
Property and equipment are stated at cost. Depreciation is recorded using the straight-line method over the estimated useful lives of the assets (generally five to ten years for restaurant, commissary and other equipment, and 20 to 40 years for buildings and improvements). Leasehold improvements are amortized over the terms of the respective leases, including the first renewal period (generally five to ten years).
Depreciation expense was $39.1 million in 2014, $34.5 million in 2013 and $32.1 million in 2012.
Deferred Costs
We defer certain information systems development and related costs that meet established criteria. Amounts deferred, which are included in property and equipment, are amortized principally over periods not exceeding five years beginning in the month subsequent to completion of the related information systems project. Total costs deferred were approximately $3.3 million in 2014, $3.3 million in 2013 and $2.7 million in 2012. The unamortized information systems development costs approximated $8.7 million and $7.5 million as of December 28, 2014 and December 29, 2013, respectively.
Intangible Assets Goodwill
We evaluate goodwill annually in the fourth quarter or whenever we identify certain triggering events or circumstances that would more-likely-than-not reduce the fair value of a reporting unit below its carrying amount. Such tests are completed separately with respect to the goodwill of each of our reporting units, which includes our domestic Company-owned restaurants, China and the United Kingdom (PJUK). We may perform a qualitative assessment or move directly to the quantitative assessment for any reporting unit in any period if we believe that it is more efficient or if impairment indicators exist. We elected to perform the two-step quantitative assessment for all reporting units in 2014.
Our domestic Company-owned restaurants fair value calculation considered both an income approach and a market approach and our China and United Kingdom fair value calculations considered an income approach. The income approach used projected net cash flows, with various growth assumptions, over a ten-year discrete period and a terminal value, which were discounted using appropriate rates. The selected discount rate considered the risk and nature of each reporting units cash flow and the rates of return market participants would require to invest their capital in the reporting unit. In determining the fair value from a market approach, we considered earnings before interest, taxes, depreciation and amortization (EBITDA) multiples that a potential buyer would pay based on third-party transactions in similar markets.
The results of our quantitative assessments indicated the fair values significantly exceeded the carrying amounts. Subsequent to completing our annual quantitative goodwill impairment tests, no indications of impairment were identified.
Deferred Income Tax Accounts and Tax Reserves
We are subject to income taxes in the United States and several foreign jurisdictions. Significant judgment is required in determining our provision for income taxes and the related assets and liabilities. The provision for income taxes includes income taxes paid, currently payable or receivable and those deferred.
2. Significant Accounting Policies (continued)
Deferred tax assets and liabilities are determined based on differences between financial reporting and tax basis of assets and liabilities, and are measured using enacted tax rates and laws that are expected to be in effect when the differences reverse. Deferred tax assets are also recognized for the estimated future effects of tax loss carryforwards. The effect on deferred taxes of changes in tax rates is recognized in the period in which the new tax is enacted. As a result, our effective tax rate may fluctuate. Valuation allowances are established when necessary on a jurisdictional basis to reduce deferred tax assets to the amounts we expect to realize.
Tax authorities periodically audit the Company. We record reserves and related interest and penalties for identified exposures as income tax expense. We evaluate these issues and adjust for events, such as statute of limitations expirations, court rulings or audit settlements, which may impact our ultimate payment for such exposures.
Insurance Reserves
Our insurance programs for workers compensation, owned and non-owned automobiles, general liability, property, and health insurance coverage provided to our employees are funded by the Company up to certain retention levels. Losses are accrued based upon undiscounted estimates of the aggregate retained liability for claims incurred using certain third-party actuarial projections and our claims loss experience. The estimated insurance claims losses could be significantly affected should the frequency or ultimate cost of claims differ significantly from historical trends used to estimate the insurance reserves recorded by the Company. See Note 12 for additional information on our insurance reserves.
Derivative Financial Instruments
We recognize all derivatives on the balance sheet at fair value. At inception and on an ongoing basis, we assess whether each derivative that qualifies for hedge accounting continues to be highly effective in offsetting changes in the cash flows of the hedged item. If the derivative meets the hedge criteria as defined by certain accounting standards, depending on the nature of the hedge, changes in the fair value of the derivative are either offset against the change in fair value of assets, liabilities or firm commitments through earnings or recognized in accumulated other comprehensive income until the hedged item is recognized in earnings. The ineffective portion of a derivatives change in fair value, if any, is immediately recognized in earnings.
We recognized a loss of $261,000 ($164,000 after tax) in 2014, a loss of $51,000 ($32,000 after tax) in 2013 and a loss of $114,000 ($72,000 after tax) in 2012, in accumulated other comprehensive income for the net change in the fair value of our interest rate swaps. See Note 9 for additional information on our debt and credit arrangements.
2. Significant Accounting Policies (continued)
Noncontrolling Interests
The Company has the following four joint ventures in which there are noncontrolling interests:
|
Joint Venture |
|
Redemption Feature |
|
Location within the |
|
Recorded value |
|
|
|
|
|
|
|
|
|
|
|
Star Papa, LP |
|
Redeemable |
|
Temporary equity |
|
Carrying value |
|
|
PJ Denver, LLC |
|
Redeemable |
|
Temporary equity |
|
Redemption value |
|
|
Colonels Limited, LLC |
|
No redemption feature |
|
Permanent equity |
|
Carrying value |
|
|
PJ Minnesota, LLC |
|
No redemption feature |
|
Permanent equity |
|
Carrying value |
|
Consolidated net income is required to be reported separately at amounts attributable to both the parent and the noncontrolling interest. Additionally, disclosures are required to clearly identify and distinguish between the interests of the parent company and the interests of the noncontrolling owners, including a disclosure on the face of the consolidated statements of income attributable to the noncontrolling interest holder.
See Note 6 for additional information regarding noncontrolling interests.
Foreign Currency Translation
The local currency is the functional currency for our foreign subsidiaries located in the United Kingdom, Mexico and China. Earnings and losses are translated into U.S. dollars using monthly average exchange rates, while assets and liabilities are translated using year-end exchange rates. The resulting translation adjustments are included as a component of accumulated other comprehensive income (loss) net of income taxes.
Recent Accounting Pronouncements
Revenue from Contract with Customers
In May 2014, the Financial Accounting Standards Board issued Revenue from Contracts with Customers (Accounting Standards Update (ASU) 2014-09), a comprehensive new revenue recognition standard that will supersede nearly all existing revenue recognition guidance under GAAP. This update requires companies to recognize revenue at amounts that reflect the consideration to which the company expects to be entitled in exchange for those goods or services at the time of transfer. In doing so, companies will need to use more judgment and make more estimates than under todays guidance. Such estimates may include identifying performance obligations in the contract, estimating the amount of variable consideration to include in the transaction price and allocating the transaction price to each separate performance obligation. Companies can either apply a full retrospective adoption or a modified retrospective adoption.
We are required to adopt the new requirements in the first quarter of 2017. We are currently evaluating the method of adoption and its impact of the new requirements on our consolidated financial statements. We currently do not believe the impact will be significant.
3. Stockholders Equity
Shares Authorized and Outstanding
The Company has authorized 5.0 million preferred shares and 100.0 million common shares. The Companys outstanding common shares, net of repurchased Company stock, were 39.8 million shares at December 28, 2014 and 41.7 million shares at December 29, 2013. There were no preferred shares issued or outstanding at December 28, 2014 and December 29, 2013.
Two-for-one Stock Split and Treasury Retirement
On October 29, 2013, our Board of Directors approved a two-for-one stock split of our outstanding shares. The stock split was effected in the form of a stock dividend and entitled each shareholder of record at the close of business on December 12, 2013 to receive one additional share for every outstanding share of stock held on the record date. The stock dividend was distributed on December 27, 2013 with approximately 21.0 million shares of stock distributed. All per share and share amounts in the accompanying consolidated financial statements and notes to the financial statements have been adjusted to reflect the stock split.
In conjunction with the stock split, we retired shares held in treasury as of October 29, 2013, the date of approval by our Board of Directors.
Share Repurchase Program
Our Board of Directors has authorized the repurchase of up to $1.325 billion of common stock under a share repurchase program that began on December 9, 1999 and expires on December 31, 2015. Funding for the share repurchase program has been provided through a credit facility, operating cash flow, stock option exercises and cash and cash equivalents.
We repurchased 2.6 million and 3.5 million shares of our common stock for $117.4 million and $118.6 million in 2014 and 2013, respectively.
Subsequent to year end through February 17, 2015, the Company acquired an additional 224,000 shares at an aggregate cost of $13.6 million. As of February 17, 2015, $115.9 million was available for repurchase of common stock under this authorization.
Cash Dividend
The Company initiated quarterly cash dividends to its shareholders during 2013. The Company paid dividends of $21.7 million and $10.8 million in 2014 and 2013, respectively. Subsequent to fiscal 2014, on January 28, 2015, our Board of Directors declared a first quarter 2015 cash dividend of $0.14 per share, or approximately $5.6 million. The dividend was paid on February 20, 2015 to shareholders of record as of the close of business on February 9, 2015.
4. Earnings per Share
We compute earnings per share using the two-class method. The two-class method requires an earnings allocation formula that determines earnings per share for common shareholders and participating security holders according to dividends declared and participating rights in undistributed earnings. We consider time-based restricted stock awards to be participating securities because holders of such shares have non-forfeitable dividend rights. Under the two-class method, undistributed earnings allocated to participating securities are subtracted from net income attributable to the Company in determining net income attributable to common shareholders.
Additionally, in accordance with ASC 480, Distinguishing Liabilities from Equity, the increase in the redemption value for the noncontrolling interest of PJ Denver, LLC reduces income attributable to common shareholders.
Basic earnings per common share are computed by dividing net income attributable to common shareholders by the weighted-average common shares outstanding. Diluted earnings per common share are computed by dividing the net income attributable to common shareholders by the diluted weighted average common shares outstanding. Diluted weighted average common shares outstanding consists of basic weighted average common shares outstanding plus weighted average awards outstanding under our equity compensation plans, which are dilutive securities.
The calculations of basic earnings per common share and diluted earnings per common share for the years ended December 28, 2014, December 29, 2013 and December 30, 2012 are as follows (in thousands, except per share data):
|
|
|
2014 |
|
2013 |
|
2012 |
| |||
|
|
|
|
|
|
|
|
| |||
|
Basic earnings per common share: |
|
|
|
|
|
|
| |||
|
Net income attributable to the Company |
|
$ |
73,315 |
|
$ |
69,537 |
|
$ |
61,660 |
|
|
Increase in noncontrolling interest redemption value |
|
(44 |
) |
(510 |
) |
|
| |||
|
Net income attributable to participating securities |
|
(402 |
) |
(530 |
) |
|
| |||
|
Net income attributable to common shareholders |
|
$ |
72,869 |
|
$ |
68,497 |
|
$ |
61,660 |
|
|
|
|
|
|
|
|
|
| |||
|
Weighted average common shares outstanding |
|
40,960 |
|
43,387 |
|
46,916 |
| |||
|
Basic earnings per common share |
|
$ |
1.78 |
|
$ |
1.58 |
|
$ |
1.31 |
|
|
|
|
|
|
|
|
|
| |||
|
Diluted earnings per common share: |
|
|
|
|
|
|
| |||
|
Net income attributable to common shareholders |
|
$ |
72,869 |
|
$ |
68,497 |
|
$ |
61,660 |
|
|
|
|
|
|
|
|
|
| |||
|
Weighted average common shares outstanding |
|
40,960 |
|
43,387 |
|
46,916 |
| |||
|
Dilutive effect of outstanding equity awards |
|
758 |
|
856 |
|
894 |
| |||
|
Diluted weighted average common shares outstanding |
|
41,718 |
|
44,243 |
|
47,810 |
| |||
|
Diluted earnings per common share |
|
$ |
1.75 |
|
$ |
1.55 |
|
$ |
1.29 |
|
Shares subject to options to purchase common stock with an exercise price greater than the average market price for the year were not included in the computation of diluted earnings per common share because the effect would have been antidilutive. The weighted average number of shares subject to antidilutive options was 226,000 in 2014 and 129,000 in 2013 (none in 2012).
See Note 6 for additional information regarding our noncontrolling interests and Note 18 for equity awards, including restricted stock.
5. Fair Value Measurements and Disclosures
We are required to determine the fair value of financial assets and liabilities based on the price that would be received to sell the asset or paid to transfer the liability to a market participant. Fair value is a market-based measurement, not an entity specific measurement. The fair value of certain assets and liabilities approximates carrying value because of the short-term nature of the accounts, including cash, accounts receivable and accounts payable. The carrying value of our notes receivable net of allowances also approximates fair value. The fair value of the amount outstanding under our revolving credit facility approximates its carrying value due to its variable market-based interest rate. These assets and liabilities are categorized as Level 1 as defined below.
Certain assets and liabilities are measured at fair value on a recurring basis and are required to be classified and disclosed in one of the following categories:
· Level 1: Quoted market prices in active markets for identical assets or liabilities.
· Level 2: Observable market-based inputs or unobservable inputs that are corroborated by market data.
· Level 3: Unobservable inputs that are not corroborated by market data.
Our financial assets and liabilities that were measured at fair value on a recurring basis as of December 28, 2014 and December 29, 2013 are as follows (in thousands):
|
|
|
Carrying |
|
Fair Value Measurements |
| ||||||||
|
|
|
Value |
|
Level 1 |
|
Level 2 |
|
Level 3 |
| ||||
|
|
|
|
|
|
|
|
|
|
| ||||
|
December 28, 2014 |
|
|
|
|
|
|
|
|
| ||||
|
Financial assets: |
|
|
|
|
|
|
|
|
| ||||
|
Cash surrender value of life insurance policies (a) |
|
$ |
18,238 |
|
$ |
18,238 |
|
$ |
|
|
$ |
|
|
|
|
|
|
|
|
|
|
|
|
| ||||
|
Financial liabilities: |
|
|
|
|
|
|
|
|
| ||||
|
Interest rate swaps (b) |
|
376 |
|
|
|
376 |
|
|
| ||||
|
|
|
|
|
|
|
|
|
|
| ||||
|
December 29, 2013 |
|
|
|
|
|
|
|
|
| ||||
|
Financial assets: |
|
|
|
|
|
|
|
|
| ||||
|
Cash surrender value of life insurance policies (a) |
|
$ |
16,798 |
|
$ |
16,798 |
|
$ |
|
|
$ |
|
|
|
|
|
|
|
|
|
|
|
|
| ||||
|
Financial liabilities: |
|
|
|
|
|
|
|
|
| ||||
|
Interest rate swap (b) |
|
76 |
|
|
|
76 |
|
|
| ||||
(a) Represents life insurance policies held in our non-qualified deferred compensation plan.
(b) The fair value of our interest rate swaps are based on the sum of all future net present value cash flows. The future cash flows are derived based on the terms of our interest rate swaps, as well as considering published discount factors, and projected London Interbank Offered Rates (LIBOR).
There were no transfers among levels within the fair value hierarchy during fiscal 2014 or 2013.
6. Noncontrolling Interests
Papa Johns has joint ventures in which there are noncontrolling interests, consisting of the following as of December 28, 2014, December 29, 2013 and December 30, 2012:
|
|
|
|
|
|
|
|
|
Noncontrolling |
|
|
|
|
Number of |
|
Restaurant |
|
Papa Johns |
|
Interest |
|
|
|
|
Restaurants |
|
Locations |
|
Ownership |
|
Ownership |
|
|
|
|
|
|
|
|
|
|
|
|
|
December 28, 2014 |
|
|
|
|
|
|
|
|
|
|
Star Papa, LP |
|
84 |
|
Texas |
|
51 |
% |
49 |
% |
|
Colonels Limited, LLC |
|
56 |
|
Maryland and Virginia |
|
70 |
% |
30 |
% |
|
PJ Minnesota, LLC |
|
35 |
|
Minnesota |
|
70 |
% |
30 |
% |
|
PJ Denver, LLC |
|
25 |
|
Colorado |
|
60 |
% |
40 |
% |
|
|
|
|
|
|
|
|
|
|
|
|
December 29, 2013 |
|
|
|
|
|
|
|
|
|
|
Star Papa, LP |
|
81 |
|
Texas |
|
51 |
% |
49 |
% |
|
Colonels Limited, LLC |
|
52 |
|
Maryland and Virginia |
|
70 |
% |
30 |
% |
|
PJ Minnesota, LLC |
|
33 |
|
Minnesota |
|
80 |
% |
20 |
% |
|
PJ Denver, LLC |
|
25 |
|
Colorado |
|
60 |
% |
40 |
% |
|
|
|
|
|
|
|
|
|
|
|
|
December 30, 2012 |
|
|
|
|
|
|
|
|
|
|
Star Papa, LP |
|
78 |
|
Texas |
|
51 |
% |
49 |
% |
|
Colonels Limited, LLC |
|
52 |
|
Maryland and Virginia |
|
70 |
% |
30 |
% |
|
PJ Minnesota, LLC |
|
30 |
|
Minnesota |
|
80 |
% |
20 |
% |
|
PJ Denver, LLC |
|
22 |
|
Colorado |
|
60 |
% |
40 |
% |
The noncontrolling interest holders ownership in PJ Minnesota, LLC increased from 20% to 30% in 2014 upon exercise of an option to acquire an additional 10% interest in the joint venture from the Company.
The income before income taxes attributable to these joint ventures for the years ended December 28, 2014, December 29, 2013 and December 30, 2012 were as follows (in thousands):
|
|
|
2014 |
|
2013 |
|
2012 |
| |||
|
|
|
|
|
|
|
|
| |||
|
Papa Johns International, Inc. |
|
$ |
6,932 |
|
$ |
5,121 |
|
$ |
6,823 |
|
|
Noncontrolling interests |
|
4,382 |
|
3,442 |
|
4,342 |
| |||
|
Total income before income taxes |
|
$ |
11,314 |
|
$ |
8,563 |
|
$ |
11,165 |
|
6. Noncontrolling Interests (continued)
The noncontrolling interest holders of two joint ventures have the option to require the Company to purchase their interests. Since redemption of the noncontrolling interests is outside of the Companys control, the noncontrolling interests are presented in the caption Redeemable noncontrolling interests in the consolidated balance sheets and include the following joint ventures:
· The Star Papa, LP agreement contains a redemption feature that is not currently redeemable, but it is probable to become redeemable in the future. Due to specific valuation provisions contained in the agreement, this noncontrolling interest has been recorded at its carrying value.
· The PJ Denver, LLC agreement contains a redemption feature that is currently redeemable and, therefore, this noncontrolling interest has been recorded at its current redemption value. The change in redemption value is recorded as an adjustment to Redeemable noncontrolling interests and Retained earnings in the consolidated balance sheets.
We have a third joint venture, PJ Minnesota, LLC, that had a redemption feature until a contract amendment removed the redemption feature in the fourth quarter of 2013. The noncontrolling interest was reclassified from temporary equity to Stockholders equity in the consolidated balance sheet at December 29, 2013, at carrying value.
The following summarizes changes in our redeemable noncontrolling interests in 2014 and 2013 (in thousands):
|
Balance at December 30, 2012 |
|
$ |
6,380 |
|
|
Net income |
|
1,718 |
| |
|
Contributions from redeemable noncontrolling interest holders |
|
850 |
| |
|
Distributions to redeemable noncontrolling interest holders |
|
(2,000 |
) | |
|
Change in redemption value |
|
510 |
| |
|
Reclassification from temporary equity to permanent equity |
|
(434 |
) | |
|
Balance at December 29, 2013 |
|
7,024 |
| |
|
Net income |
|
2,487 |
| |
|
Distributions to redeemable noncontrolling interest holders |
|
(1,000 |
) | |
|
Change in redemption value |
|
44 |
| |
|
Balance at December 28, 2014 |
|
$ |
8,555 |
|
Our fourth joint venture, Colonels Limited, LLC, had a mandatory redemption feature through August 24, 2014. Accordingly, the Company recorded this noncontrolling interest as a liability at its redemption value in other long-term liabilities. The redemption value was adjusted at each reporting date and any change was recorded in interest expense. In the third quarter of 2014, the mandatory redemption clause was removed via a contract amendment to the operating agreement. Upon the removal of this redemption feature, the noncontrolling interest for Colonels Limited, LLC was reclassified from other long-term liabilities to stockholders equity at the recorded amount, which approximated fair value, with no impact to income before income taxes. At December 28, 2014, the noncontrolling interest was recorded in stockholders equity at a carrying value of $11.4 million and was recorded at a redemption value of $10.8 million in other long-term liabilities at December 29, 2013.
6. Noncontrolling Interests (continued)
We recorded interest expense of $4,000 and $1.0 million in 2014 and 2012, respectively, and interest income of $1.1 million in 2013 for the change in redemption value of the Colonels Limited, LLC agreement. Changes in the carrying value following the removal of the redemption feature on August 24, 2014 are recorded in stockholders equity.
7. Acquisitions
We acquired restaurants from our domestic franchisees in 2014 and 2012 (none in 2013), which are summarized as follows:
|
|
|
2014 |
|
2012 |
| ||
|
|
|
|
|
|
| ||
|
Number of restaurants acquired |
|
13 |
|
56 |
| ||
|
Location of restaurants acquired |
|
Various |
|
Denver and Minneapolis |
| ||
|
|
|
|
|
|
| ||
|
Purchase price (in thousands): |
|
|
|
|
| ||
|
Cash payment (a) |
|
$ |
4,773 |
|
$ |
5,200 |
|
|
Cancellation of accounts and notes receivable |
|
412 |
|
|
| ||
|
Total purchase price |
|
$ |
5,185 |
|
$ |
5,200 |
|
|
|
|
|
|
|
| ||
|
Fair value allocation of purchase price (in thousands): |
|
|
|
|
| ||
|
Property and equipment |
|
$ |
555 |
|
$ |
1,602 |
|
|
Reacquired franchise right |
|
844 |
|
245 |
| ||
|
Goodwill |
|
3,661 |
|
3,830 |
| ||
|
Other, including cash |
|
125 |
|
239 |
| ||
|
Total purchase price |
|
$ |
5,185 |
|
$ |
5,916 |
|
(a) 2012 cash payments made were net of $700,000 received from the sale of six restaurants located in the Denver market to an existing franchisee.
The restaurant acquisitions described above were accounted for by the purchase method of accounting, whereby operating results subsequent to the acquisition date are included in our consolidated financial results. The excess of the purchase price over the aggregate fair value of net assets acquired was allocated to goodwill for the Domestic Company-owned restaurants segment and is eligible for deduction over 15 years under U.S. tax regulations.
In July 2012, Papa Johns and a third party formed a limited liability company (PJ Minnesota, LLC) to operate the previously acquired Minneapolis restaurants. The Companys equity (80% ownership at that time) in the operations was funded by the contribution of the acquired restaurants, while the third partys equity (20% ownership at that time) was funded through a $275,000 loan issued by Papa Johns and a $25,000 cash contribution. There was no gain or loss on this transaction. We are required to fully consolidate the financial results of this limited liability company. See Note 6 for additional information.
7. Acquisitions (continued)
In September 2012, Papa Johns and a third party formed a limited liability company (PJ Denver, LLC) to operate the previously acquired Denver restaurants. The Companys equity (60% ownership) in the operations was funded by the contribution of the acquired restaurants and cash (total value of $2.5 million), while the third partys equity (40% ownership) was funded by a cash contribution of $1.7 million. There was no gain or loss on this transaction. We are required to fully consolidate the financial results of this limited liability company. See Note 6 for additional information.
8. Goodwill
The following summarizes changes to the Companys goodwill, by reporting segment (in thousands):
|
|
|
Domestic |
|
International (a) |
|
All |
|
Total |
| ||||
|
|
|
|
|
|
|
|
|
|
| ||||
|
Balance as of December 30, 2012 |
|
$ |
58,567 |
|
$ |
19,955 |
|
$ |
436 |
|
$ |
78,958 |
|
|
Foreign currency adjustments |
|
|
|
433 |
|
|
|
433 |
| ||||
|
Balance as of December 29, 2013 |
|
58,567 |
|
20,388 |
|
436 |
|
79,391 |
| ||||
|
Acquisitions (b) |
|
3,661 |
|
|
|
|
|
3,661 |
| ||||
|
Divestitures (c) |
|
|
|
(47 |
) |
|
|
(47 |
) | ||||
|
Foreign currency adjustments |
|
|
|
(998 |
) |
|
|
(998 |
) | ||||
|
Balance as of December 28, 2014 |
|
$ |
62,228 |
|
$ |
19,343 |
|
$ |
436 |
|
$ |
82,007 |
|
(a) The international goodwill balances for all years presented are net of accumulated impairment of $2.3 million associated with our PJUK reporting unit, which was recorded in fiscal 2008.
(b) Includes 13 restaurants located in three domestic markets.
(c) Includes four restaurants located in the China market.
For fiscal year 2014, we performed a quantitative analysis on each reporting unit. For fiscal years 2012 and 2013, we performed qualitative analyses for our domestic Company-owned restaurants and our China reporting unit and quantitative analyses for our PJUK reporting unit. Upon completion of our goodwill impairment tests in 2012-2014, no impairment charges were recorded.
9. Debt and Credit Arrangements
Our debt is comprised entirely of an unsecured revolving credit facility (Credit Facility). The outstanding balance was $230.5 million as of December 28, 2014 and $157.9 million as of December 29, 2013.
On April 30, 2013, we amended and restated our Credit Facility to increase the amount available for borrowing to $300 million from $175 million and extend the maturity date to April 30, 2018. On October 31, 2014, we amended our Credit Facility (Amended Line) to increase the amount available to $400 million and extend the maturity date to October 31, 2019. Additionally, we have the option to increase the Amended Line an additional $100 million. The interest rate charged on outstanding balances is LIBOR plus 75 to 175 basis points. The commitment fee on the unused balance ranges from 15 to 25 basis points. The remaining availability under the Amended Line, reduced for outstanding letters of credit approximates $148.2 million.
The Credit Facility contains customary affirmative and negative covenants, including financial covenants requiring the maintenance of specified fixed charges and leverage ratios. At December 28, 2014, we were in compliance with these covenants.
We had the following interest rate swap agreements as of December 28, 2014:
|
Effective Dates |
|
Floating |
|
Fixed |
| |
|
|
|
|
|
|
| |
|
July 30, 2013 through April 30, 2018 |
|
$ |
75 million |
|
1.42 |
% |
|
December 30, 2014 through April 30, 2018 |
|
$ |
50 million |
|
1.36 |
% |
We previously had a $50 million swap that was terminated on July 30, 2013 with a fixed rate of 0.56%.
Our swaps are derivative instruments that are designated as cash flow hedges because the swaps provide a hedge against the effects of rising interest rates on borrowings. The effective portion of the gain or loss on the swaps is reported as a component of accumulated other comprehensive income and reclassified into earnings in the same period or periods during which the swaps affect earnings. Gains or losses on the swaps representing either hedge ineffectiveness or hedge components excluded from the assessment of effectiveness are recognized in current earnings. Amounts payable or receivable under the swaps are accounted for as adjustments to interest expense. As of December 28, 2014, the swaps are highly effective cash flow hedges with no ineffectiveness during the year ended December 28, 2014.
9. Debt and Credit Arrangements (continued)
The following table provides information on the location and amounts of our swaps in the accompanying consolidated financial statements (in thousands):
|
|
|
Liability Derivatives |
| ||||||
|
|
|
Balance Sheet Location |
|
Fair Value |
|
Fair Value |
| ||
|
|
|
|
|
|
|
|
| ||
|
Interest rate swaps |
|
Other current and long-term liabilities |
|
$ |
376 |
|
$ |
76 |
|
There were no derivatives that were not designated as hedging instruments.
The effect of derivative instruments on the accompanying consolidated financial statements is as follows (in thousands):
|
Derivatives - |
|
Amount of Gain |
|
Location of Gain |
|
Amount of Gain |
|
Location of Gain |
|
Amount of Gain |
| |||
|
|
|
|
|
|
|
|
|
|
|
|
| |||
|
Interest rate swaps: |
|
|
|
|
|
|
|
|
|
|
| |||
|
|
|
|
|
|
|
|
|
|
|
|
| |||
|
2014 |
|
$ |
(164 |
) |
Interest expense |
|
$ |
(996 |
) |
Interest expense |
|
$ |
|
|
|
2013 |
|
$ |
(32 |
) |
Interest expense |
|
$ |
(501 |
) |
Interest expense |
|
$ |
|
|
|
2012 |
|
$ |
(72 |
) |
Interest expense |
|
$ |
(150 |
) |
Interest expense |
|
$ |
|
|
The weighted average interest rates for the credit facility, including the impact of the previously mentioned swap agreements, were 1.7%, 1.4% and 1.3% in fiscal 2014, 2013 and 2012, respectively. Interest paid, including payments made or received under the swaps, was $3.7 million in 2014, $2.0 million in 2013 and $967,000 in 2012. As of December 28, 2014, the portion of the $376,000 liability associated with the interest rate swap that would be reclassified into earnings during the next 12 months as interest expense approximates $113,000.
10. Net Property and Equipment
Net property and equipment consists of the following (in thousands):
|
|
|
2014 |
|
2013 |
| ||
|
Land |
|
$ |
32,880 |
|
$ |
33,000 |
|
|
Buildings and improvements |
|
86,892 |
|
86,763 |
| ||
|
Leasehold improvements |
|
110,323 |
|
106,487 |
| ||
|
Equipment and other |
|
320,480 |
|
280,381 |
| ||
|
Construction in progress |
|
6,466 |
|
20,155 |
| ||
|
Total property and equipment |
|
557,041 |
|
526,786 |
| ||
|
Accumulated depreciation and amortization |
|
(337,584 |
) |
(314,689 |
) | ||
|
Net property and equipment |
|
$ |
219,457 |
|
$ |
212,097 |
|
11. Notes Receivable
Selected franchisees have borrowed funds from the Company, principally for use in the acquisition, construction and development of their restaurants. We have also entered into loan agreements with certain franchisees that purchased restaurants from us or from other franchisees. Loans outstanding were approximately $18.9 million and $16.8 million on a consolidated basis as of December 28, 2014 and December 29, 2013, respectively, net of allowance for doubtful accounts.
Notes receivable bear interest at fixed or floating rates and are generally secured by the assets of each restaurant and the ownership interests in the franchisee. The carrying amounts of the loans approximate fair value. Interest income recorded on franchisee loans was approximately $658,000 in 2014, $527,000 in 2013 and $631,000 in 2012 and is reported in investment income in the accompanying consolidated statements of income.
Based on our review of certain borrowers economic performance and underlying collateral value, we established allowances of $3.1 million and $3.4 million as of December 28, 2014 and December 29, 2013, respectively, for potentially uncollectible notes receivable. The following summarizes changes in our notes receivable allowance for doubtful accounts (in thousands):
|
Balance as of December 30, 2012 |
|
$ |
5,028 |
|
|
Recovered from costs and expenses |
|
(495 |
) | |
|
Deductions, including notes written off |
|
(1,146 |
) | |
|
Balance as of December 29, 2013 |
|
3,387 |
| |
|
Recovered from costs and expenses |
|
(502 |
) | |
|
Additions, net of notes written off |
|
247 |
| |
|
Balance as of December 28, 2014 |
|
$ |
3,132 |
|
12. Insurance Reserves
The following table summarizes changes in our insurance program reserves (in thousands):
|
Balance as of December 30, 2012 |
|
$ |
22,303 |
|
|
Additions |
|
23,187 |
| |
|
Payments |
|
(26,025 |
) | |
|
Balance as of December 29, 2013 |
|
19,465 |
| |
|
Additions |
|
33,926 |
| |
|
Payments |
|
(27,980 |
) | |
|
Balance as of December 28, 2014 |
|
$ |
25,411 |
|
We are a party to standby letters of credit with off-balance sheet risk associated with our insurance programs. The total amount committed under letters of credit for these programs was $21.2 million at December 28, 2014.
13. Accrued Expenses and Other Current Liabilities
Accrued expenses and other current liabilities consist of the following (in thousands):
|
|
|
2014 |
|
2013 |
| ||
|
Salaries, benefits and bonuses |
|
$ |
19,427 |
|
$ |
20,166 |
|
|
Insurance reserves, current |
|
11,149 |
|
7,907 |
| ||
|
Purchases |
|
8,132 |
|
10,349 |
| ||
|
Deposits |
|
4,120 |
|
1,370 |
| ||
|
Customer loyalty program |
|
2,357 |
|
1,682 |
| ||
|
Consulting and professional fees |
|
2,226 |
|
1,670 |
| ||
|
Rent |
|
1,626 |
|
7,024 |
| ||
|
Marketing |
|
1,543 |
|
1,353 |
| ||
|
Utilities |
|
1,399 |
|
1,381 |
| ||
|
Other |
|
6,314 |
|
4,905 |
| ||
|
Total |
|
$ |
58,293 |
|
$ |
57,807 |
|
14. Other Long-term Liabilities
Other long-term liabilities consist of the following (in thousands):
|
|
|
2014 |
|
2013 |
| ||
|
|
|
|
|
|
| ||
|
Deferred compensation plan |
|
$ |
17,599 |
|
$ |
15,798 |
|
|
Insurance reserves |
|
14,262 |
|
11,558 |
| ||
|
Accrued rent |
|
5,387 |
|
|
| ||
|
Mandatorily redeemable noncontrolling interests |
|
|
|
10,786 |
| ||
|
Other |
|
4,627 |
|
4,693 |
| ||
|
Total |
|
$ |
41,875 |
|
$ |
42,835 |
|
15. Income Taxes
A summary of the provision for income taxes follows (in thousands):
|
|
|
2014 |
|
2013 |
|
2012 |
| |||
|
Current: |
|
|
|
|
|
|
| |||
|
Federal |
|
$ |
17,193 |
|
$ |
19,731 |
|
$ |
26,065 |
|
|
Foreign |
|
2,368 |
|
1,974 |
|
1,669 |
| |||
|
State and local |
|
2,293 |
|
822 |
|
2,624 |
| |||
|
Deferred (federal and state) |
|
14,704 |
|
10,603 |
|
2,035 |
| |||
|
Total |
|
$ |
36,558 |
|
$ |
33,130 |
|
$ |
32,393 |
|
Significant deferred tax assets (liabilities) follow (in thousands):
|
|
|
2014 |
|
2013 |
| ||
|
|
|
|
|
|
| ||
|
Accrued liabilities |
|
$ |
12,319 |
|
$ |
10,584 |
|
|
Accrued bonuses |
|
3,624 |
|
4,153 |
| ||
|
Other assets and liabilities |
|
11,109 |
|
10,209 |
| ||
|
Equity awards |
|
6,494 |
|
5,974 |
| ||
|
Other |
|
3,730 |
|
3,992 |
| ||
|
Foreign net operating losses |
|
6,322 |
|
7,233 |
| ||
|
Valuation allowance on foreign net operating losses and foreign deferred tax assets |
|
(2,932 |
) |
(7,682 |
) | ||
|
Total deferred tax assets |
|
40,666 |
|
34,463 |
| ||
|
|
|
|
|
|
| ||
|
Deferred expenses |
|
(6,141 |
) |
(5,655 |
) | ||
|
Accelerated depreciation |
|
(21,425 |
) |
(16,838 |
) | ||
|
Goodwill |
|
(15,725 |
) |
(13,953 |
) | ||
|
Other |
|
(7,401 |
) |
(4,673 |
) | ||
|
Total deferred tax liabilities |
|
(50,692 |
) |
(41,119 |
) | ||
|
Net deferred (liability) asset |
|
$ |
(10,026 |
) |
$ |
(6,656 |
) |
The Company had approximately $29.7 million and $34.0 million of foreign tax net operating loss carryovers as of December 28, 2014 and December 29, 2013, respectively. The Company had approximately $2.9 million and $7.7 million of a valuation allowance primarily related to these foreign net operating losses as of December 28, 2014 and December 29, 2013, respectively. The net change in the total valuation allowance was a decrease of $4.8 million in 2014. A substantial majority of our foreign tax net operating losses do not have an expiration date.
15. Income Taxes (continued)
The reconciliation of income tax computed at the U.S. federal statutory rate to income tax expense for the years ended December 28, 2014, December 29, 2013 and December 30, 2012 is as follows in both dollars and as a percentage of income before income taxes ($ in thousands):
|
|
|
2014 |
|
2013 |
|
2012 |
| |||||||||
|
|
|
Income Tax |
|
Income |
|
Income Tax |
|
Income |
|
Income Tax |
|
Income |
| |||
|
|
|
|
|
|
|
|
|
|
|
|
|
|
| |||
|
Tax at U.S. federal statutory rate |
|
$ |
39,989 |
|
35.0 |
% |
$ |
37,138 |
|
35.0 |
% |
$ |
34,438 |
|
35.0 |
% |
|
State and local income taxes |
|
1,896 |
|
1.7 |
% |
1,820 |
|
1.7 |
% |
1,936 |
|
2.0 |
% | |||
|
Foreign income taxes |
|
2,368 |
|
2.1 |
% |
1,974 |
|
1.9 |
% |
1,669 |
|
1.7 |
% | |||
|
Settlement of certain tax issues |
|
117 |
|
0.1 |
% |
(909 |
) |
(0.9 |
)% |
305 |
|
0.3 |
% | |||
|
Income of consolidated partnerships attributable to noncontrolling interests |
|
(1,608 |
) |
(1.4 |
)% |
(1,263 |
) |
(1.2 |
)% |
(1,604 |
) |
(1.6 |
)% | |||
|
Non-qualified deferred compensation plan (income) loss |
|
(171 |
) |
(0.2 |
)% |
(599 |
) |
(0.6 |
)% |
(355 |
) |
(0.4 |
)% | |||
|
Tax credits and other |
|
(6,033 |
) |
(5.3 |
)% |
(5,031 |
) |
(4.7 |
)% |
(3,996 |
) |
(4.1 |
)% | |||
|
Total |
|
$ |
36,558 |
|
32.0 |
% |
$ |
33,130 |
|
31.2 |
% |
$ |
32,393 |
|
32.9 |
% |
Income taxes paid were $27.0 million in 2014, $29.3 million in 2013 and $25.3 million in 2012.
The Company files income tax returns in the U.S. federal jurisdiction and various states and foreign jurisdictions. The Company, with few exceptions, is no longer subject to U.S. federal, state and local, or non-U.S. income tax examinations by tax authorities for years before 2010. The Company is currently undergoing examinations by various tax authorities. The Company anticipates that the finalization of these current examinations and other issues could result in a decrease in the liability for unrecognized tax benefits (and a decrease of income tax expense) of approximately $546,000 during the next 12 months.
The Company had $2.8 million of unrecognized tax benefits at December 28, 2014 of which, if recognized, would affect the effective tax rate. A reconciliation of the beginning and ending liability for unrecognized tax benefits is as follows (in thousands):
|
Balance at December 30, 2012 |
|
$ |
3,430 |
|
|
Additions for tax positions of prior years |
|
170 |
| |
|
Reductions for lapse of statute of limitations |
|
(241 |
) | |
|
Settlements |
|
(698 |
) | |
|
Balance at December 29, 2013 |
|
2,661 |
| |
|
Additions for tax positions of prior years |
|
1,167 |
| |
|
Reductions for lapse of statute of limitations |
|
(1,015 |
) | |
|
Balance at December 28, 2014 |
|
$ |
2,813 |
|
The Company recognizes accrued interest and penalties related to unrecognized tax benefits as a part of income tax expense. The Companys 2014 and 2013 income tax expense includes interest benefits of $35,000 and $140,000, respectively. The Company has accrued approximately $674,000 and $707,000 for the payment of interest and penalties as of December 28, 2014 and December 29, 2013, respectively.
16. Related Party Transactions
Certain of our officers and directors own equity interests in entities that franchise restaurants. Following is a summary of full-year transactions and year-end balances with franchisees owned by related parties and PJMF (in thousands):
|
|
|
2014 |
|
2013 |
|
2012 |
| |||
|
Revenues from affiliates: |
|
|
|
|
|
|
| |||
|
Commissary sales |
|
$ |
2,679 |
|
$ |
2,426 |
|
$ |
23,145 |
|
|
Other sales |
|
482 |
|
482 |
|
2,394 |
| |||
|
Franchise royalties |
|
385 |
|
351 |
|
3,771 |
| |||
|
Total |
|
$ |
3,546 |
|
$ |
3,259 |
|
$ |
29,310 |
|
|
|
|
|
|
|
|
|
| |||
|
Accounts receivable - affiliates |
|
$ |
114 |
|
$ |
284 |
|
$ |
1,062 |
|
|
|
|
|
|
|
|
|
| |||
|
Accounts payable - affiliates |
|
$ |
249 |
|
$ |
|
|
$ |
|
|
The revenues from affiliates were at rates and terms available to independent franchisees. Additionally, the table excludes transactions and balances in 2013 for a former non-management director.
We paid $770,000 in 2014, $1.1 million in 2013 and $1.1 million in 2012 for charter aircraft services provided by an entity owned by our Founder, Chairman, President and Chief Executive Officer.
On November 12, 2013, we repurchased $38.6 million of our common stock (1.0 million shares at the closing price of $38.61 per share) from our Founder, Chairman, President and Chief Executive Officer.
We had the following transactions with PJMF:
· PJMF reimbursed Papa Johns $634,000, $2.2 million and $3.0 million in 2014, 2013, and 2012, respectively, for certain costs associated with national pizza giveaways awarded to our online loyalty program customers.
· PJMF reimbursed Papa Johns $1.2 million, $782,000, and $917,000 in 2014, 2013, and 2012, respectively, for certain administrative services (i.e., marketing, accounting, and information services), graphic design services, services and expenses of our founder as brand spokesman, and for software maintenance fees.
17. Litigation, Commitments and Contingencies
Litigation
The Company is involved in a number of lawsuits, claims, investigations and proceedings, including those specifically identified below, consisting of intellectual property, employment, consumer, commercial and other matters arising in the ordinary course of business. In accordance with ASC 450 Contingencies, the Company has made accruals with respect to these matters, where appropriate, which are reflected in the Companys financial statements. We review these provisions at least quarterly and adjust these provisions to reflect the impact of negotiations, settlements, rulings, advice of legal counsel and other information and events pertaining to a particular case.
17. Litigation, Commitments and Contingencies (continued)
Agne v. Papa Johns International, Inc. et al. was a class action filed on May 28, 2010 in the United States District Court for the Western District of Washington seeking damages for violations of the Telephone Consumer Protection Act and Washington State telemarketing laws alleging, among other things that several Papa Johns franchisees retained a vendor to send unsolicited commercial text message offers primarily in Washington and Oregon. The court granted plaintiffs motion for class certification in November 2012; we filed a petition for permission to appeal the courts ruling on class certification to the United States Court of Appeals for the Ninth Circuit.
In February 2013, the parties tentatively agreed to the financial terms of a settlement of the litigation. The court preliminarily approved the terms in June 2013 and granted final approval of the settlement and fee award in October 2013, following the close of the claims period. The actual settlement cost was $2.9 million, and all settlement and fee payments were made in 2013.
Perrin v. Papa Johns International, Inc. and Papa Johns USA, Inc. is a conditionally certified collective action filed in August 2009 in the United States District Court, Eastern District of Missouri, alleging that delivery drivers were not reimbursed for mileage and expenses in accordance with the Fair Labor Standards Act. Approximately 3,900 drivers out of a potential class size of 28,800 have opted into the action. In late December 2013, the District Court granted a motion for class certification in five additional states, which added approximately 15,000 plaintiffs to the case. The trial is scheduled for August 2015.
We intend to vigorously defend against all claims in this lawsuit. However, given the inherent uncertainties of litigation, the outcome of this case cannot be predicted and the amount of any potential loss cannot be reasonably estimated. A negative outcome in this case could have a material adverse effect on the Company.
Leases
We lease office, retail and commissary space under operating leases, which have an average term of five years and provide for at least one renewal. Certain leases further provide that the lease payments may be increased annually based on the fixed rate terms or adjustable terms such as the Consumer Price Index. PJUK, our subsidiary located in the United Kingdom, leases certain retail space, which is primarily subleased to our franchisees. We also lease the tractors and trailers used by our distribution subsidiary, PJFS, for an average period of seven years. Total lease expense was $34.7 million in 2014, $33.2 million in 2013 and $28.7 million in 2012, net of sublease payments received.
We subleased certain sites to our franchisees and other third parties in 2014, 2013 and 2012 and received payments of $6.7 million, $4.9 million and $3.8 million, respectively, which are netted against the corresponding expense.
17. Litigation, Commitments and Contingencies (continued)
Future gross lease costs, future expected sublease payments and net lease costs as of December 28, 2014, are as follows (in thousands):
|
|
|
|
|
Future |
|
|
| |||
|
|
|
|
|
Expected |
|
|
| |||
|
|
|
Gross Lease |
|
Sublease |
|
Net Lease |
| |||
|
Year |
|
Costs |
|
Payments |
|
Costs |
| |||
|
2015 |
|
$ |
40,062 |
|
$ |
5,875 |
|
$ |
34,187 |
|
|
2016 |
|
35,751 |
|
5,368 |
|
30,383 |
| |||
|
2017 |
|
30,200 |
|
5,054 |
|
25,146 |
| |||
|
2018 |
|
24,078 |
|
4,899 |
|
19,179 |
| |||
|
2019 |
|
16,929 |
|
4,673 |
|
12,256 |
| |||
|
Thereafter |
|
38,255 |
|
26,328 |
|
11,927 |
| |||
|
Total |
|
$ |
185,275 |
|
$ |
52,197 |
|
$ |
133,078 |
|
As a result of assigning our interest in obligations under property leases as a condition of the refranchising of certain restaurants, we are contingently liable for payment of approximately 20 domestic leases. These leases have varying terms, the latest of which expires in 2019. As of December 28, 2014, the estimated maximum amount of undiscounted payments the Company could be required to make in the event of nonpayment by the primary lessee was $724,000. As the fair value of the guarantees is not considered significant, no liability has been recorded.
In connection with the 2006 sale of our former Perfect Pizza operations in the United Kingdom, we remain contingently liable for payment of 25 leases, which have varying terms with most expiring by the end of 2015. As the initial party to the lease agreements, we are liable to the extent the primary obligor does not satisfy its payment obligations. As of December 28, 2014, the estimated maximum amount of undiscounted rental payments we would be required to make in the event of non-payment under these leases is approximately $420,000.
The Companys headquarters facility is leased under a capital lease arrangement with the City of Jeffersontown, Kentucky in connection with the issuance of $80.2 million in Industrial Revenue Bonds. The bonds are held 100% by the Company and, accordingly, the bond obligation and investment and related interest income and expense are eliminated in the consolidated financial statements resulting in the Companys net investment cost being reported in net property and equipment.
18. Equity Compensation
We award stock options, time-based restricted stock and performance-based restricted stock units from time to time under the Papa Johns International, Inc. 2011 Omnibus Incentive Plan and other such agreements as may arise.
There are approximately 7.5 million shares of common stock authorized for issuance and remaining available under the 2011 Omnibus Incentive Plan as of December 28, 2014, which includes 4.0 million shares transferred from the Papa Johns International, Inc. 2008 Omnibus Incentive Plan. Option awards are granted with an exercise price equal to the market price of the Companys stock at the date of grant. Options outstanding as of December 28, 2014 generally expire five or ten years from the date of grant and vest over a three-year period.
18. Equity Compensation (continued)
We recorded stock-based employee compensation expense of $8.7 million in 2014, $7.4 million in 2013 and $6.9 million in 2012. The total income tax benefit recognized in the income statement for share-based compensation arrangements was $3.2 million in 2014, $2.7 million in 2013 and $2.4 million in 2012. At December 28, 2014, there was $7.0 million of unrecognized compensation cost related to nonvested option awards, time-based restricted stock and performance-based restricted stock units, of which the Company expects to recognize $4.3 million in 2015, $2.0 million in 2016 and $720,000 in 2017.
Stock Options
Options exercised included 759,000 shares in 2014, 697,000 shares in 2013 and 864,000 shares in 2012. The total intrinsic value of the options exercised during 2014, 2013 and 2012 was $25.3 million, $13.1 million and $7.5 million, respectively. Cash received upon the exercise of stock options was $5.8 million, $6.9 million and $12.3 million during 2014, 2013 and 2012, respectively, and the related tax benefits realized were approximately $9.4 million, $4.8 million and $2.6 million during the corresponding periods.
Information pertaining to option activity during 2014 is as follows (number of options and aggregate intrinsic value in thousands):
|
|
|
|
|
|
|
Weighted |
|
|
| ||
|
|
|
|
|
|
|
Average |
|
|
| ||
|
|
|
|
|
Weighted |
|
Remaining |
|
|
| ||
|
|
|
Number |
|
Average |
|
Contractual |
|
Aggregate |
| ||
|
|
|
of |
|
Exercise |
|
Term |
|
Intrinsic |
| ||
|
|
|
Options |
|
Price |
|
(In Years) |
|
Value |
| ||
|
Outstanding at December 29, 2013 |
|
2,104 |
|
$ |
17.39 |
|
|
|
|
| |
|
Granted |
|
293 |
|
49.68 |
|
|
|
|
| ||
|
Exercised |
|
(759 |
) |
13.77 |
|
|
|
|
| ||
|
Cancelled |
|
(74 |
) |
31.83 |
|
|
|
|
| ||
|
Outstanding at December 28, 2014 |
|
1,564 |
|
$ |
24.52 |
|
5.41 |
|
$ |
48,640 |
|
|
Exercisable at December 28, 2014 |
|
893 |
|
$ |
16.55 |
|
3.11 |
|
$ |
34,872 |
|
The following is a summary of the significant assumptions used in estimating the fair value of options granted in 2014, 2013 and 2012:
|
|
|
2014 |
|
2013 |
|
2012 |
|
|
|
|
|
|
|
|
|
|
|
Assumptions (weighted average): |
|
|
|
|
|
|
|
|
Risk-free interest rate |
|
1.8 |
% |
1.1 |
% |
1.1 |
% |
|
Expected dividend yield |
|
1.0 |
% |
0.1 |
% |
0.0 |
% |
|
Expected volatility |
|
35.7 |
% |
37.5 |
% |
37.8 |
% |
|
Expected term (in years) |
|
6.0 |
|
6.0 |
|
6.0 |
|
The risk-free interest rate for the periods within the contractual life of an option is based on the U.S. Treasury yield curve in effect at the time of grant. The expected dividend yield was estimated as the annual dividend divided by the market price of the Companys shares on the date of grant. Expected volatility was estimated by using the Companys historical share price volatility for a period similar to the expected life of the option.
18. Equity Compensation (continued)
Options granted generally vest in equal installments over three years and expire ten years after grant. The expected term for these options represents the period of time that options granted are expected to be outstanding and was calculated using the simplified method prescribed by Securities and Exchange Commission rules and regulations as there was insufficient historical detail to be used as an alternative basis to estimating the term.
The weighted average grant-date fair values of options granted during 2014, 2013 and 2012 was $16.48, $9.87 and $7.04, respectively. The Company granted 293,000, 498,000 and 508,000 options in 2014, 2013 and 2012, respectively.
Restricted Stock and Restricted Stock Units
In 2014, 2013 and 2012, we granted shares of restricted stock that were time-based and generally vest in equal installments over three years. These restricted shares are intended to focus participants on our long-range objectives, while at the same time serving as a retention mechanism. We consider time-based restricted stock awards to be participating securities because holders of such shares have non-forfeitable dividend rights. We declared dividends totaling $128,000 ($0.53 per share) in 2014 and $86,000 ($0.25 per share) in 2013 to holders of time-based restricted stock.
Additionally, we granted shares of performance-based restricted stock units to executive management (17,000 in 2014, 3,000 in 2013, and 108,000 in 2012). The vesting of these awards (a three-year cliff vest) is dependent upon the Companys achievement of a compounded annual growth rate of earnings per share and the achievement of certain sales and unit growth metrics. The performance measures for the 2012 and 2013 grants were achieved and the shares will vest in February 2015.
The fair value of both time-based restricted stock and performance-based restricted stock units is based on the market price of the Companys shares on the grant date. Information pertaining to restricted stock activity during 2014, 2013 and 2012 is as follows (shares in thousands):
|
|
|
|
|
Weighted |
| |
|
|
|
|
|
Average |
| |
|
|
|
|
|
Grant-Date |
| |
|
|
|
Shares |
|
Fair Value |
| |
|
Total as of December 25, 2011 |
|
500 |
|
$ |
14.10 |
|
|
Granted |
|
266 |
|
18.59 |
| |
|
Forfeited |
|
(74 |
) |
15.46 |
| |
|
Vested |
|
(156 |
) |
13.89 |
| |
|
Total as of December 30, 2012 |
|
536 |
|
16.31 |
| |
|
Granted |
|
160 |
|
27.09 |
| |
|
Forfeited |
|
(70 |
) |
18.56 |
| |
|
Vested |
|
(203 |
) |
15.51 |
| |
|
Total as of December 29, 2013 |
|
423 |
|
20.39 |
| |
|
Granted |
|
106 |
|
49.31 |
| |
|
Forfeited |
|
(40 |
) |
27.79 |
| |
|
Vested |
|
(203 |
) |
18.05 |
| |
|
Total as of December 28, 2014 |
|
286 |
|
$ |
31.81 |
|
19. Employee Benefit Plans
We have established the Papa Johns International, Inc. 401(k) Plan (the 401(k) Plan), as a defined contribution benefit plan, in accordance with Section 401(k) of the Internal Revenue Code. The 401(k) Plan is open to employees who meet certain eligibility requirements and allows participating employees to defer receipt of a portion of their compensation and contribute such amount to one or more investment funds. At our discretion, we may make matching contribution payments, which are subject to vesting based on an employees length of service with us.
In addition, we maintain a non-qualified deferred compensation plan available to certain employees and directors. Under this plan, the participants may defer a certain amount of their compensation, which is credited to the participants accounts. The participant-directed investments associated with this plan are included in other long-term assets ($18.2 million and $16.8 million at December 28, 2014 and December 29, 2013, respectively) and the associated liabilities ($17.6 million and $15.8 million at December 28, 2014 and December 29, 2013, respectively) are included in other long-term liabilities in the accompanying consolidated balance sheets.
At our discretion, we contributed a matching payment of 1.5%, up to a maximum of 6% deferred, in 2014, 2013 and 2012 of a participating employees earnings deferred into both the 401(k) Plan and the non-qualified deferred compensation plan. Such costs were $734,000 in 2014, $691,000 in 2013 and $630,000 in 2012.
PJUK, the Companys United Kingdom subsidiary, provided a pension plan that was frozen in 1999. The Company recorded expense of $174,000, $60,000 and $154,000 associated with the pension plan for the fiscal years ended 2014, 2013, and 2012, respectively. The Company transferred the assets and liabilities for the ten participants in the pension plan to an outside insurance company in 2014. Substantially all of the $174,000 expensed in 2014 was related to the transfer.
20. Segment Information
We have five reportable segments for all years presented: domestic Company-owned restaurants, domestic commissaries, North America franchising, international operations, and all other units. The domestic Company-owned restaurant segment consists of the operations of all domestic (domestic is defined as contiguous United States) Company-owned restaurants and derives its revenues principally from retail sales of pizza and side items, including breadsticks, cheesesticks, chicken poppers and wings, dessert items and canned or bottled beverages. The domestic commissary segment consists of the operations of our regional dough production and product distribution centers and derives its revenues principally from the sale and distribution of food and paper products to domestic Company-owned and franchised restaurants. The North America franchising segment consists of our franchise sales and support activities and derives its revenues from sales of franchise and development rights and collection of royalties from our franchisees located in the United States and Canada. The international operations segment principally consists of our Company-owned restaurants in China and distribution sales to franchised Papa Johns restaurants located in the United Kingdom, Mexico and China and our franchise sales and support activities, which derive revenues from sales of franchise and development rights and the collection of royalties from our international franchisees. International franchisees are defined as all franchise operations outside of the United States and Canada. All other business units that do not meet the quantitative thresholds for determining reportable segments, which are not operating segments, we refer to as our all other segment, which consists of operations that derive revenues from the sale, principally to Company-owned and franchised restaurants, of printing and promotional items, risk management services, and information systems and related services used in restaurant operations, including our point-of-sale system, online and other technology-based ordering platforms.
20. Segment Information (continued)
Generally, we evaluate performance and allocate resources based on profit or loss from operations before income taxes and intercompany eliminations. Certain administrative and capital costs are allocated to segments based upon predetermined rates or actual estimated resource usage. We account for intercompany sales or transfers as if the sales or transfers were to third parties and eliminate the activity in consolidation.
Our reportable segments are business units that provide different products or services. Separate management of each segment is required because each business unit is subject to different operational issues and strategies. No single external customer accounted for 10% or more of our consolidated revenues. The accounting policies of the segments are the same as those described in the summary of significant accounting policies (see Note 2).
Our segment information is as follows:
|
(In thousands) |
|
2014 |
|
2013 |
|
2012 |
| |||
|
|
|
|
|
|
|
|
| |||
|
Revenues from external customers: |
|
|
|
|
|
|
| |||
|
Domestic Company-owned restaurants |
|
$ |
701,854 |
|
$ |
635,317 |
|
$ |
592,203 |
|
|
Domestic commissaries |
|
629,492 |
|
578,870 |
|
545,924 |
| |||
|
North America franchising |
|
90,169 |
|
82,873 |
|
80,373 |
| |||
|
International |
|
102,455 |
|
88,640 |
|
72,930 |
| |||
|
All others |
|
74,179 |
|
53,322 |
|
51,223 |
| |||
|
Total revenues from external customers |
|
$ |
1,598,149 |
|
$ |
1,439,022 |
|
$ |
1,342,653 |
|
|
|
|
|
|
|
|
|
| |||
|
Intersegment revenues: |
|
|
|
|
|
|
| |||
|
Domestic commissaries |
|
$ |
220,406 |
|
$ |
191,756 |
|
$ |
171,212 |
|
|
North America franchising |
|
2,400 |
|
2,222 |
|
2,267 |
| |||
|
International |
|
320 |
|
280 |
|
229 |
| |||
|
All others |
|
22,851 |
|
14,197 |
|
11,606 |
| |||
|
Total intersegment revenues |
|
$ |
245,977 |
|
$ |
208,455 |
|
$ |
185,314 |
|
|
|
|
|
|
|
|
|
| |||
|
Depreciation and amortization: |
|
|
|
|
|
|
| |||
|
Domestic Company-owned restaurants |
|
$ |
13,829 |
|
$ |
13,284 |
|
$ |
13,242 |
|
|
Domestic commissaries |
|
6,776 |
|
5,690 |
|
4,738 |
| |||
|
International |
|
3,903 |
|
3,966 |
|
2,824 |
| |||
|
All others |
|
6,156 |
|
5,320 |
|
4,801 |
| |||
|
Unallocated corporate expenses |
|
9,301 |
|
6,845 |
|
7,193 |
| |||
|
Total depreciation and amortization |
|
$ |
39,965 |
|
$ |
35,105 |
|
$ |
32,798 |
|
|
|
|
|
|
|
|
|
| |||
|
Income (loss) before income taxes: |
|
|
|
|
|
|
| |||
|
Domestic Company-owned restaurants |
|
$ |
40,969 |
|
$ |
34,590 |
|
$ |
38,114 |
|
|
Domestic commissaries |
|
39,317 |
|
37,804 |
|
34,317 |
| |||
|
North America franchising |
|
77,009 |
|
70,201 |
|
69,332 |
| |||
|
International |
|
7,250 |
|
2,803 |
|
3,063 |
| |||
|
All others |
|
(9 |
) |
3,490 |
|
2,889 |
| |||
|
Unallocated corporate expenses |
|
(49,440 |
) |
(41,025 |
) |
(48,958 |
) | |||
|
Elimination of intersegment profits |
|
(841 |
) |
(1,754 |
) |
(362 |
) | |||
|
Total income before income taxes |
|
$ |
114,255 |
|
$ |
106,109 |
|
$ |
98,395 |
|
20. Segment Information (continued)
|
(In thousands) |
|
2014 |
|
2013 |
|
2012 |
| |||
|
|
|
|
|
|
|
|
| |||
|
Property and equipment: |
|
|
|
|
|
|
| |||
|
Domestic Company-owned restaurants |
|
$ |
208,488 |
|
$ |
195,526 |
|
$ |
184,322 |
|
|
Domestic commissaries |
|
107,992 |
|
104,509 |
|
101,082 |
| |||
|
International |
|
25,443 |
|
27,225 |
|
22,389 |
| |||
|
All others |
|
46,013 |
|
41,064 |
|
37,221 |
| |||
|
Unallocated corporate assets |
|
169,105 |
|
158,462 |
|
142,950 |
| |||
|
Accumulated depreciation and amortization |
|
(337,584 |
) |
(314,689 |
) |
(291,303 |
) | |||
|
Net property and equipment |
|
$ |
219,457 |
|
$ |
212,097 |
|
$ |
196,661 |
|
|
|
|
|
|
|
|
|
| |||
|
Expenditures for property and equipment: |
|
|
|
|
|
|
| |||
|
Domestic Company-owned restaurants |
|
$ |
23,475 |
|
$ |
13,149 |
|
$ |
9,319 |
|
|
Domestic commissaries |
|
5,756 |
|
9,791 |
|
14,314 |
| |||
|
International |
|
1,708 |
|
3,754 |
|
4,865 |
| |||
|
All others |
|
5,906 |
|
4,689 |
|
3,342 |
| |||
|
Unallocated corporate |
|
11,810 |
|
19,367 |
|
10,788 |
| |||
|
Total expenditures for property and equipment |
|
$ |
48,655 |
|
$ |
50,750 |
|
$ |
42,628 |
|
21. Quarterly Data - Unaudited, in Thousands, except Per Share Data
Our quarterly select financial data is as follows:
|
|
|
Quarter |
| ||||||||||
|
2014 |
|
1st |
|
2nd |
|
3rd |
|
4th |
| ||||
|
|
|
|
|
|
|
|
|
|
| ||||
|
Total revenues |
|
$ |
401,377 |
|
$ |
380,864 |
|
$ |
390,399 |
|
$ |
425,509 |
|
|
Operating income |
|
32,002 |
|
26,999 |
|
25,186 |
|
33,443 |
| ||||
|
Net income attributable to the Company |
|
19,311 |
|
16,748 |
|
16,075 |
|
21,181 |
| ||||
|
Basic earnings per common share |
|
$ |
0.46 |
|
$ |
0.40 |
|
$ |
0.39 |
|
$ |
0.53 |
|
|
Diluted earnings per common share |
|
$ |
0.45 |
|
$ |
0.40 |
|
$ |
0.39 |
|
$ |
0.52 |
|
|
Dividends declared per common share |
|
$ |
0.125 |
|
$ |
0.125 |
|
$ |
0.14 |
|
$ |
0.14 |
|
|
|
|
Quarter |
| ||||||||||
|
2013 |
|
1st |
|
2nd |
|
3rd |
|
4th |
| ||||
|
|
|
|
|
|
|
|
|
|
| ||||
|
Total revenues |
|
$ |
355,604 |
|
$ |
349,186 |
|
$ |
346,342 |
|
$ |
387,890 |
|
|
Operating income |
|
29,625 |
|
26,948 |
|
21,448 |
|
28,482 |
| ||||
|
Net income attributable to the Company |
|
19,306 |
|
17,150 |
|
14,276 |
|
18,805 |
| ||||
|
Basic earnings per common share |
|
$ |
0.43 |
|
$ |
0.39 |
|
$ |
0.33 |
|
$ |
0.42 |
|
|
Diluted earnings per common share |
|
$ |
0.42 |
|
$ |
0.39 |
|
$ |
0.32 |
|
$ |
0.41 |
|
|
Dividends declared per common share |
|
$ |
|
|
$ |
|
|
$ |
0.125 |
|
$ |
0.125 |
|
All quarterly information is presented in 13-week periods. Quarterly earnings per share on a full-year basis may not agree to the consolidated statements of income due to rounding.
Item 9. Changes in and Disagreements with Accountants on Accounting and Financial Disclosure
None.
Item 9A. Controls and Procedures
(a) Evaluation of Disclosure Controls and Procedures
As of the end of the period covered by this report, we carried out an evaluation, under the supervision and with the participation of our management, including our Chief Executive Officer (CEO) and Chief Financial Officer (CFO), of the effectiveness of our disclosure controls and procedures (as defined in Rules 13a-15(e) and 15d-15(e) of the Exchange Act). Based upon this evaluation, the CEO and CFO concluded that the Companys disclosure controls and procedures are effective.
(b) Managements Report on our Internal Control over Financial Reporting
Our management is responsible for establishing and maintaining adequate internal control over financial reporting, as such term is defined in Rule 13a-15(f) promulgated under the Exchange Act. Our internal control system is designed to provide reasonable assurance to our management and the board of directors regarding the preparation and fair presentation of published financial statements. All internal control systems, no matter how well designed, have inherent limitations. Therefore, even those systems determined to be effective can provide only reasonable assurance with respect to financial statement preparation and presentation.
Under the supervision and with the participation of our management, including our CEO and CFO, we conducted an evaluation of the effectiveness of our internal control over financial reporting based on the 2013 framework established in Internal Control Integrated Framework issued by the Committee of Sponsoring Organizations of the Treadway Commission. Based on our evaluation under the 2013 framework established in Internal Control Integrated Framework, our management concluded that our internal control over financial reporting was effective as of December 28, 2014.
Ernst & Young LLP, an independent registered public accounting firm, has audited the Consolidated Financial Statements included in this Annual Report on Form 10-K and, as part of its audit, has issued an attestation report, included herein, on the effectiveness of our internal control over financial reporting.
Report of Independent Registered Public Accounting Firm
The Board of Directors and Stockholders of Papa Johns International, Inc. and Subsidiaries
We have audited Papa Johns International, Inc. and Subsidiaries internal control over financial reporting as of December 28, 2014, based on criteria established in Internal ControlIntegrated Framework issued by the Committee of Sponsoring Organizations of the Treadway Commission (2013 Framework) (the COSO criteria). Papa Johns International, Inc. and Subsidiaries management is responsible for maintaining effective internal control over financial reporting, and for its assessment of the effectiveness of internal control over financial reporting included in the accompanying Managements Report on our Internal Control over Financial Reporting. Our responsibility is to express an opinion on the companys internal control over financial reporting based on our audit.
We conducted our audit in accordance with the standards of the Public Company Accounting Oversight Board (United States). Those standards require that we plan and perform the audit to obtain reasonable assurance about whether effective internal control over financial reporting was maintained in all material respects. Our audit included obtaining an understanding of internal control over financial reporting, assessing the risk that a material weakness exists, testing and evaluating the design and operating effectiveness of internal control based on the assessed risk, and performing such other procedures as we considered necessary in the circumstances. We believe that our audit provides a reasonable basis for our opinion.
A companys internal control over financial reporting is a process designed to provide reasonable assurance regarding the reliability of financial reporting and the preparation of financial statements for external purposes in accordance with generally accepted accounting principles. A companys internal control over financial reporting includes those policies and procedures that (1) pertain to the maintenance of records that, in reasonable detail, accurately and fairly reflect the transactions and dispositions of the assets of the company; (2) provide reasonable assurance that transactions are recorded as necessary to permit preparation of financial statements in accordance with generally accepted accounting principles, and that receipts and expenditures of the company are being made only in accordance with authorizations of management and directors of the company; and (3) provide reasonable assurance regarding prevention or timely detection of unauthorized acquisition, use or disposition of the companys assets that could have a material effect on the financial statements.
Because of its inherent limitations, internal control over financial reporting may not prevent or detect misstatements. Also, projections of any evaluation of effectiveness to future periods are subject to the risk that controls may become inadequate because of changes in conditions, or that the degree of compliance with the policies or procedures may deteriorate.
In our opinion, Papa Johns International, Inc. and Subsidiaries maintained, in all material respects, effective internal control over financial reporting as of December 28, 2014, based on the COSO criteria.
We also have audited, in accordance with the standards of the Public Company Accounting Oversight Board (United States), the consolidated balance sheets as of December 28, 2014 and December 29, 2013, and the related consolidated statements of income, comprehensive income, stockholders equity, and cash flows for each of the three years in the period ended December 28, 2014 of Papa Johns International, Inc. and Subsidiaries and our report dated February 24, 2015 expressed an unqualified opinion thereon.
|
|
/s/ Ernst & Young LLP |
Louisville, Kentucky
February 24, 2015
(c) Changes in Internal Control over Financial Reporting
There were no changes in our internal control over financial reporting during the quarter ended December 28, 2014 that have materially affected, or are likely to materially affect, the Companys internal control over financial reporting.
On February 19, 2015, the Compensation Committee of the Board of Directors approved new employment agreements effective March 1, 2015, originally entered into for 3-year terms in March 2012, with members of the Companys executive leadership team (other than Founder, Chairman, President and Chief Executive Officer, John H. Schnatter), including Senior Vice President and Chief Operating Officer, Stephen M. Ritchie; Senior Vice President, Chief Financial Officer, Chief Administrative Officer and Treasurer, Lance F. Tucker; and Senior Vice President and Chief Development Officer, Timothy C. OHern (collectively, the Employment Agreements). The Employment Agreements are on substantially the same terms as the prior agreements, and have a three-year term and automatically renew for successive one-year terms unless either party gives written notice of termination at least 60 days prior to the expiration of the current term. The Employment Agreements provide for a minimum annual base salary (currently $550,000 in the case of Mr. Ritchie, $500,000 in the case of Mr. Tucker, and $395,000 in the case of Mr. OHern), annual cash bonus and equity awards opportunities, and benefits as afforded to similarly situated employees. During the term of the Employment Agreements, base salary increases, and the amount and terms of bonus awards and equity awards are at the discretion of the Compensation Committee of the Board of Directors.
In the event the executives employment is terminated by the Company prior to the end of the term of the Employment Agreement other than for cause (as defined in the Employment Agreement), the executive is entitled to receive 9 months base salary, pro rata cash bonus for the year of termination and a credit for an additional 6 months of service for purposes of vesting in outstanding stock options and time-based restricted stock. In the event of an executives termination without cause following a change in control before the end of the term of the Employment Agreement, or by the executive for good reason following a change in control (as defined in the Employment Agreement), the executive is entitled to receive the lesser of the total of the executives base salary and pro rata cash bonus through the remainder of the term or 9 months base salary. In the case of termination of employment due to death or disability, the Employment Agreements provide for payment of base salary through the date of termination and pro rata cash bonus. In addition to the Employment Agreements, our equity plans provide for certain benefits upon change in control, death and disability, as previously disclosed.
The foregoing summary of the Employment Agreements is qualified in its entirety by reference to the full text of the Employment Agreements filed as Exhibits 10.1, 10.2, and 10.3 hereto and incorporated by reference herein.
Item 10. Directors, Executive Officers and Corporate Governance
Information regarding executive officers is included above under the caption Executive Officers of the Registrant at the end of Part I of this Report. Other information regarding directors, executive officers and corporate governance appearing under the captions Corporate Governance, Item 1, Election of Directors, Section 16(a) Beneficial Ownership Reporting Compliance and Executive Compensation / Compensation Discussion and Analysis is incorporated by reference from the Companys definitive
proxy statement, which will be filed with the Securities and Exchange Commission no later than 120 days after the end of the fiscal year covered by this Report.
We have adopted a written code of ethics that applies to our directors, officers and employees. We intend to post all required disclosures concerning any amendments to or waivers from, our code of ethics on our website to the extent permitted by NASDAQ. Our code of ethics can be found on our website, which is located at www.papajohns.com.
Item 11. Executive Compensation
Information regarding executive compensation appearing under the captions Executive Compensation / Compensation Discussion and Analysis, Compensation Committee Report and Certain Relationships and Related Transactions Compensation Committee Interlocks and Insider Participation is incorporated by reference from the Companys definitive proxy statement, which will be filed with the Securities and Exchange Commission no later than 120 days after the end of the fiscal year covered by this Report.
Item 12. Security Ownership of Certain Beneficial Owners and Management and Related Stockholder Matters
The following table provides information as of December 28, 2014 regarding the number of shares of the Companys common stock that may be issued under the Companys equity compensation plans.
|
|
|
|
|
|
|
(c) |
| |
|
|
|
(a) |
|
(b) |
|
Number of securities |
| |
|
|
|
Number of |
|
Weighted |
|
remaining available |
| |
|
|
|
securities to be |
|
average |
|
for future issuance |
| |
|
|
|
issued upon exercise |
|
exercise price |
|
under equity |
| |
|
|
|
of outstanding |
|
of outstanding |
|
compensation plans, |
| |
|
|
|
options, warrants |
|
options, warrants |
|
excluding securities |
| |
|
Plan Category |
|
and rights |
|
and rights |
|
reflected in column (a) |
| |
|
|
|
|
|
|
|
|
| |
|
Equity compensation plans approved by security holders |
|
1,563,977 |
|
$ |
24.52 |
|
7,485,725 |
|
|
Equity compensation plans not approved by security holders * |
|
166,728 |
|
|
|
|
| |
|
Total |
|
1,730,705 |
|
$ |
24.52 |
|
7,485,725 |
|
* Represents shares of common stock issuable pursuant to the non-qualified deferred compensation plan. The weighted average exercise price (column b) does not include any assumed price for issuance of shares pursuant to the non-qualified deferred compensation plan.
Information regarding security ownership of certain beneficial owners and management and related stockholder matters appearing under the caption Security Ownership of Certain Beneficial Owners and Management is incorporated by reference from the Companys definitive proxy statement, which will be filed with the Securities and Exchange Commission no later than 120 days after the end of the fiscal year covered by this Report.
Item 13. Certain Relationships and Related Transactions, and Director Independence
Information regarding certain relationships and related transactions, and director independence appearing under the captions Corporate Governance and Certain Relationships and Related Transactions is
incorporated by reference from the Companys definitive proxy statement, which will be filed with the Securities and Exchange Commission no later than 120 days after the end of the fiscal year covered by this Report.
Item 14. Principal Accounting Fees and Services
Information regarding principal accounting fees and services appearing under the caption Ratification of the Selection of Independent Auditors is incorporated by reference from the Companys definitive proxy statement, which will be filed with the Securities and Exchange Commission no later than 120 days after the end of the fiscal year covered by this Report.
Item 15. Exhibits, Financial Statement Schedules
(a)(1) Financial Statements:
The following consolidated financial statements, notes related thereto and report of independent auditors are included in Item 8 of this Report:
· Report of Independent Registered Public Accounting Firm
· Consolidated Statements of Income for the years ended December 28, 2014, December 29, 2013 and December 30, 2012
· Consolidated Statements of Comprehensive Income for the years ended December 28, 2014, December 29, 2013 and December 30, 2012
· Consolidated Balance Sheets as of December 28, 2014 and December 29, 2013
· Consolidated Statements of Stockholders Equity for the years ended December 28, 2014, December 29, 2013 and December 30, 2012
· Consolidated Statements of Cash Flows for the years ended December 28, 2014, December 29, 2013 and December 30, 2012
· Notes to Consolidated Financial Statements
(a)(2) Financial Statement Schedules:
Schedule II Valuation and Qualifying Accounts
|
|
|
|
|
Charged to |
|
|
|
|
| ||||
|
|
|
Balance at |
|
(recovered from) |
|
|
|
Balance at |
| ||||
|
|
|
Beginning of |
|
Costs and |
|
Additions / |
|
End of |
| ||||
|
Classification |
|
Year |
|
Expenses |
|
(Deductions) |
|
Year |
| ||||
|
(in thousands) |
|
|
|
|
|
|
|
|
| ||||
|
|
|
|
|
|
|
|
|
|
| ||||
|
Fiscal year ended December 28, 2014: |
|
|
|
|
|
|
|
|
| ||||
|
|
|
|
|
|
|
|
|
|
| ||||
|
Deducted from asset accounts: |
|
|
|
|
|
|
|
|
| ||||
|
Reserve for uncollectible accounts receivable |
|
$ |
4,318 |
|
$ |
2,297 |
|
$ |
(2,801 |
) (1) |
$ |
3,814 |
|
|
Reserve for franchisee notes receivable |
|
3,387 |
|
(502 |
) |
247 |
(1) |
3,132 |
| ||||
|
Valuation allowance on foreign net operating losses |
|
7,682 |
|
(4,750 |
) |
|
|
2,932 |
| ||||
|
|
|
$ |
15,387 |
|
$ |
(2,955 |
) |
$ |
(2,554 |
) |
$ |
9,878 |
|
|
|
|
|
|
|
|
|
|
|
| ||||
|
Fiscal year ended December 29, 2013: |
|
|
|
|
|
|
|
|
| ||||
|
|
|
|
|
|
|
|
|
|
| ||||
|
Deducted from asset accounts: |
|
|
|
|
|
|
|
|
| ||||
|
Reserve for uncollectible accounts receivable |
|
$ |
3,057 |
|
$ |
2,416 |
|
$ |
(1,155 |
) (1) |
$ |
4,318 |
|
|
Reserve for franchisee notes receivable |
|
5,028 |
|
(495 |
) |
(1,146 |
) (1) |
3,387 |
| ||||
|
Valuation allowance on foreign net operating losses |
|
8,240 |
|
(558 |
) |
|
|
7,682 |
| ||||
|
|
|
$ |
16,325 |
|
$ |
1,363 |
|
$ |
(2,301 |
) |
$ |
15,387 |
|
|
|
|
|
|
|
|
|
|
|
| ||||
|
Fiscal year ended December 30, 2012: |
|
|
|
|
|
|
|
|
| ||||
|
|
|
|
|
|
|
|
|
|
| ||||
|
Deducted from asset accounts: |
|
|
|
|
|
|
|
|
| ||||
|
Reserve for uncollectible accounts receivable |
|
$ |
3,034 |
|
$ |
1,394 |
|
$ |
(1,371 |
) (1) |
$ |
3,057 |
|
|
Reserve for franchisee notes receivable |
|
5,905 |
|
280 |
|
(1,157 |
) (1) |
5,028 |
| ||||
|
Valuation allowance on foreign net operating losses |
|
7,474 |
|
766 |
|
|
|
8,240 |
| ||||
|
|
|
$ |
16,413 |
|
$ |
2,440 |
|
$ |
(2,528 |
) |
$ |
16,325 |
|
(1) Uncollectible accounts written off, net of recoveries and reclassifications between accounts and notes receivable reserves.
All other schedules for which provision is made in the applicable accounting regulation of the Securities and Exchange Commission are not required under the related instructions or are inapplicable and, therefore, have been omitted.
(a)(3) Exhibits:
The exhibits listed in the accompanying index to Exhibits are filed as part of this Form 10-K.
SIGNATURES
Pursuant to the requirements of Section 13 or 15(d) of the Securities Exchange Act of 1934, the Registrant has duly caused this report to be signed on its behalf by the undersigned, thereunto duly authorized.
|
Date: February 24, 2015 |
|
PAPA JOHNS INTERNATIONAL, INC. |
|
|
|
|
|
|
|
|
By: |
/s/ John H. Schnatter |
|
|
|
|
John H. Schnatter |
|
|
|
|
Founder, Chairman, President and |
|
|
|
|
Chief Executive Officer |
|
Pursuant to the requirements of the Securities Exchange Act of 1934, this report has been signed below by the following persons on behalf of the Registrant and in the capacities and on the dates indicated.
|
Signature |
|
Title |
|
Date |
|
|
|
|
|
|
|
/s/ John H. Schnatter |
|
Founder, Chairman, President |
|
February 24, 2015 |
|
John H. Schnatter |
|
and Chief Executive Officer |
|
|
|
|
|
(Principal Executive Officer) |
|
|
|
|
|
|
|
|
|
/s/ Norborne P. Cole, Jr. |
|
Director |
|
February 24, 2015 |
|
Norborne P. Cole, Jr. |
|
|
|
|
|
|
|
|
|
|
|
/s/ Christopher L. Coleman |
|
Director |
|
February 24, 2015 |
|
Christopher L. Coleman |
|
|
|
|
|
|
|
|
|
|
|
/s/ Philip Guarascio |
|
Director |
|
February 24, 2015 |
|
Philip Guarascio |
|
|
|
|
|
|
|
|
|
|
|
/s/ Olivia F. Kirtley |
|
Director |
|
February 24, 2015 |
|
Olivia F. Kirtley |
|
|
|
|
|
|
|
|
|
|
|
/s/ Laurette T. Koellner |
|
Director |
|
February 24, 2015 |
|
Laurette T. Koellner |
|
|
|
|
|
|
|
|
|
|
|
/s/ Mark S. Shapiro |
|
Director |
|
February 24, 2015 |
|
Mark S. Shapiro |
|
|
|
|
|
|
|
|
|
|
|
/s/ W. Kent Taylor |
|
Director |
|
February 24, 2015 |
|
W. Kent Taylor |
|
|
|
|
|
|
|
|
|
|
|
/s/ Lance F. Tucker |
|
Senior Vice President, Chief |
|
February 24, 2015 |
|
Lance F. Tucker |
|
Financial Officer, Chief Administrative |
|
|
|
|
|
Officer and Treasurer (Principal Financial |
|
|
|
|
|
Officer and Principal Accounting Officer) |
|
|
EXHIBIT INDEX
|
Exhibit |
|
|
|
Number |
|
Description of Exhibit |
|
|
|
|
|
3.1 |
|
Our Amended and Restated Certificate of Incorporation. Exhibit 3.1 to our Quarterly Report on Form 10-Q for the quarterly period ended June 29, 2014, is incorporated herein by reference. |
|
|
|
|
|
3.2 |
|
Our Restated By-Laws. Exhibit 3.1 to our report on Form 8-K dated December 5, 2007 is incorporated herein by reference. |
|
|
|
|
|
4.1 |
|
Specimen Common Stock Certificate. Exhibit 4.1 to our Annual Report on Form 10-K for the fiscal year ended December 31, 1995 (Commission File No. 0-21660) is incorporated herein by reference. |
|
|
|
|
|
4.2 |
|
Amended and Restated Certificate of Incorporation and Restated By-Laws (see Exhibits 3.1 and 3.2 above) are incorporated herein by reference. |
|
|
|
|
|
10.1* |
|
Employment Agreement between Papa Johns International, Inc. and Steve M. Ritchie effective March 1, 2015. |
|
|
|
|
|
10.2* |
|
Employment Agreement between Papa Johns International, Inc. and Lance F. Tucker effective March 1, 2015. |
|
|
|
|
|
10.3* |
|
Employment Agreement between Papa Johns International, Inc. and Timothy C. OHern effective March 1, 2015. |
|
|
|
|
|
10.4* |
|
Employment Agreement between Papa Johns International, Inc. and Robert C. Kraut effective October 7, 2013. |
|
|
|
|
|
10.5 |
|
$400,000,000 First Amendment to First Amended and Restated Credit Agreement by and among Papa Johns International, Inc.; the Guarantors party thereto; PNC Bank, National Association, as a lender and in its capacity as Administrative Agent for the lenders; JPMorgan Chase Bank, N.A., as a lender and in its capacity as Co-Syndication Agent for the lenders; U.S. Bank, National Association, as a lender and in its capacity as Co-Syndication Agent for the lenders; Bank of America, N.A., as a lender and in its capacity as Documentation Agent for the lenders; and Branch Banking and Trust Company, as a lender. Exhibit 10.1 to our Report on Form 8-K as filed on November 4, 2014 is incorporated herein by reference. |
|
|
|
|
|
10.6* |
|
Papa Johns International, Inc. Deferred Compensation Plan, as amended through December 5, 2012. Exhibit 10.1 to our report on Form 10-K as filed on February 28, 2013 is incorporated herein by reference. |
|
|
|
|
|
10.7* |
|
Papa Johns International, Inc. 2008 Omnibus Incentive Plan. Exhibit 10.1 to our Registration Statement on Form S-8 (Registration No. 333-150762) dated May 5, 2008 is incorporated herein by reference. |
|
10.8* |
|
Papa Johns International, Inc. 2011 Omnibus Incentive Plan. Exhibit 4.1 to our report on Form 8-K as filed on May 3, 2011 is incorporated herein by reference. |
|
|
|
|
|
10.9* |
|
Agreement for Service as Chairman between John H. Schnatter and Papa Johns International, Inc. Exhibit 10.1 to our report on Form 8-K as filed on August 15, 2007 is incorporated herein by reference. |
|
|
|
|
|
10.10* |
|
Agreement for Service as Founder between John H. Schnatter and Papa Johns International, Inc. Exhibit 10.1 to our report on Form 8-K as filed on August 15, 2007 is incorporated herein by reference. |
|
|
|
|
|
10.11* |
|
Amendment and Restated Exclusive License Agreement between John H. Schnatter and Papa Johns International, Inc. Exhibit 10.1 to our report on Form 8-K as filed on May 19, 2008 is incorporated herein by reference. |
|
|
|
|
|
10.12* |
|
Papa Johns International, Inc. Severance Pay Plan. Exhibit 10.1 to our report on Form 10-Q filed on May 1, 2012, is incorporated herein by reference. |
|
|
|
|
|
21 |
|
Subsidiaries of the Company. |
|
|
|
|
|
23 |
|
Consent of Ernst & Young LLP. |
|
|
|
|
|
31.1 |
|
Section 302 Certification of Chief Executive Officer Pursuant to Exchange Act Rule 13a-15(e). |
|
|
|
|
|
31.2 |
|
Section 302 Certification of Chief Financial Officer Pursuant to Exchange Act Rule 13a-15(e). |
|
|
|
|
|
32.1 |
|
Section 906 Certification of Chief Executive Officer Pursuant to 18 U.S.C. Section 1350, As Adopted Pursuant to Section 906 of the Sarbanes-Oxley Act of 2002. |
|
|
|
|
|
32.2 |
|
Section 906 Certification of Chief Financial Officer Pursuant to 18 U.S.C. Section 1350, As Adopted Pursuant to Section 906 of the Sarbanes-Oxley Act of 2002. |
|
|
|
|
|
101 |
|
Financial statements from the Annual Report on Form 10-K of Papa Johns International, Inc. for the year ended December 28, 2014, filed on February 24, 2015, formatted in XBRL: (i) the Consolidated Statements of Income, (ii) the Consolidated Statements of Comprehensive Income, (iii) the Consolidated Balance Sheets, (iv) the Consolidated Statements of Stockholders Equity, (v) the Consolidated Statements of Cash Flows and (vi) the Notes to Consolidated Financial Statements. |
*Compensatory plan required to be filed as an exhibit pursuant to Item 15(c) of Form 10-K.